Download to read offline

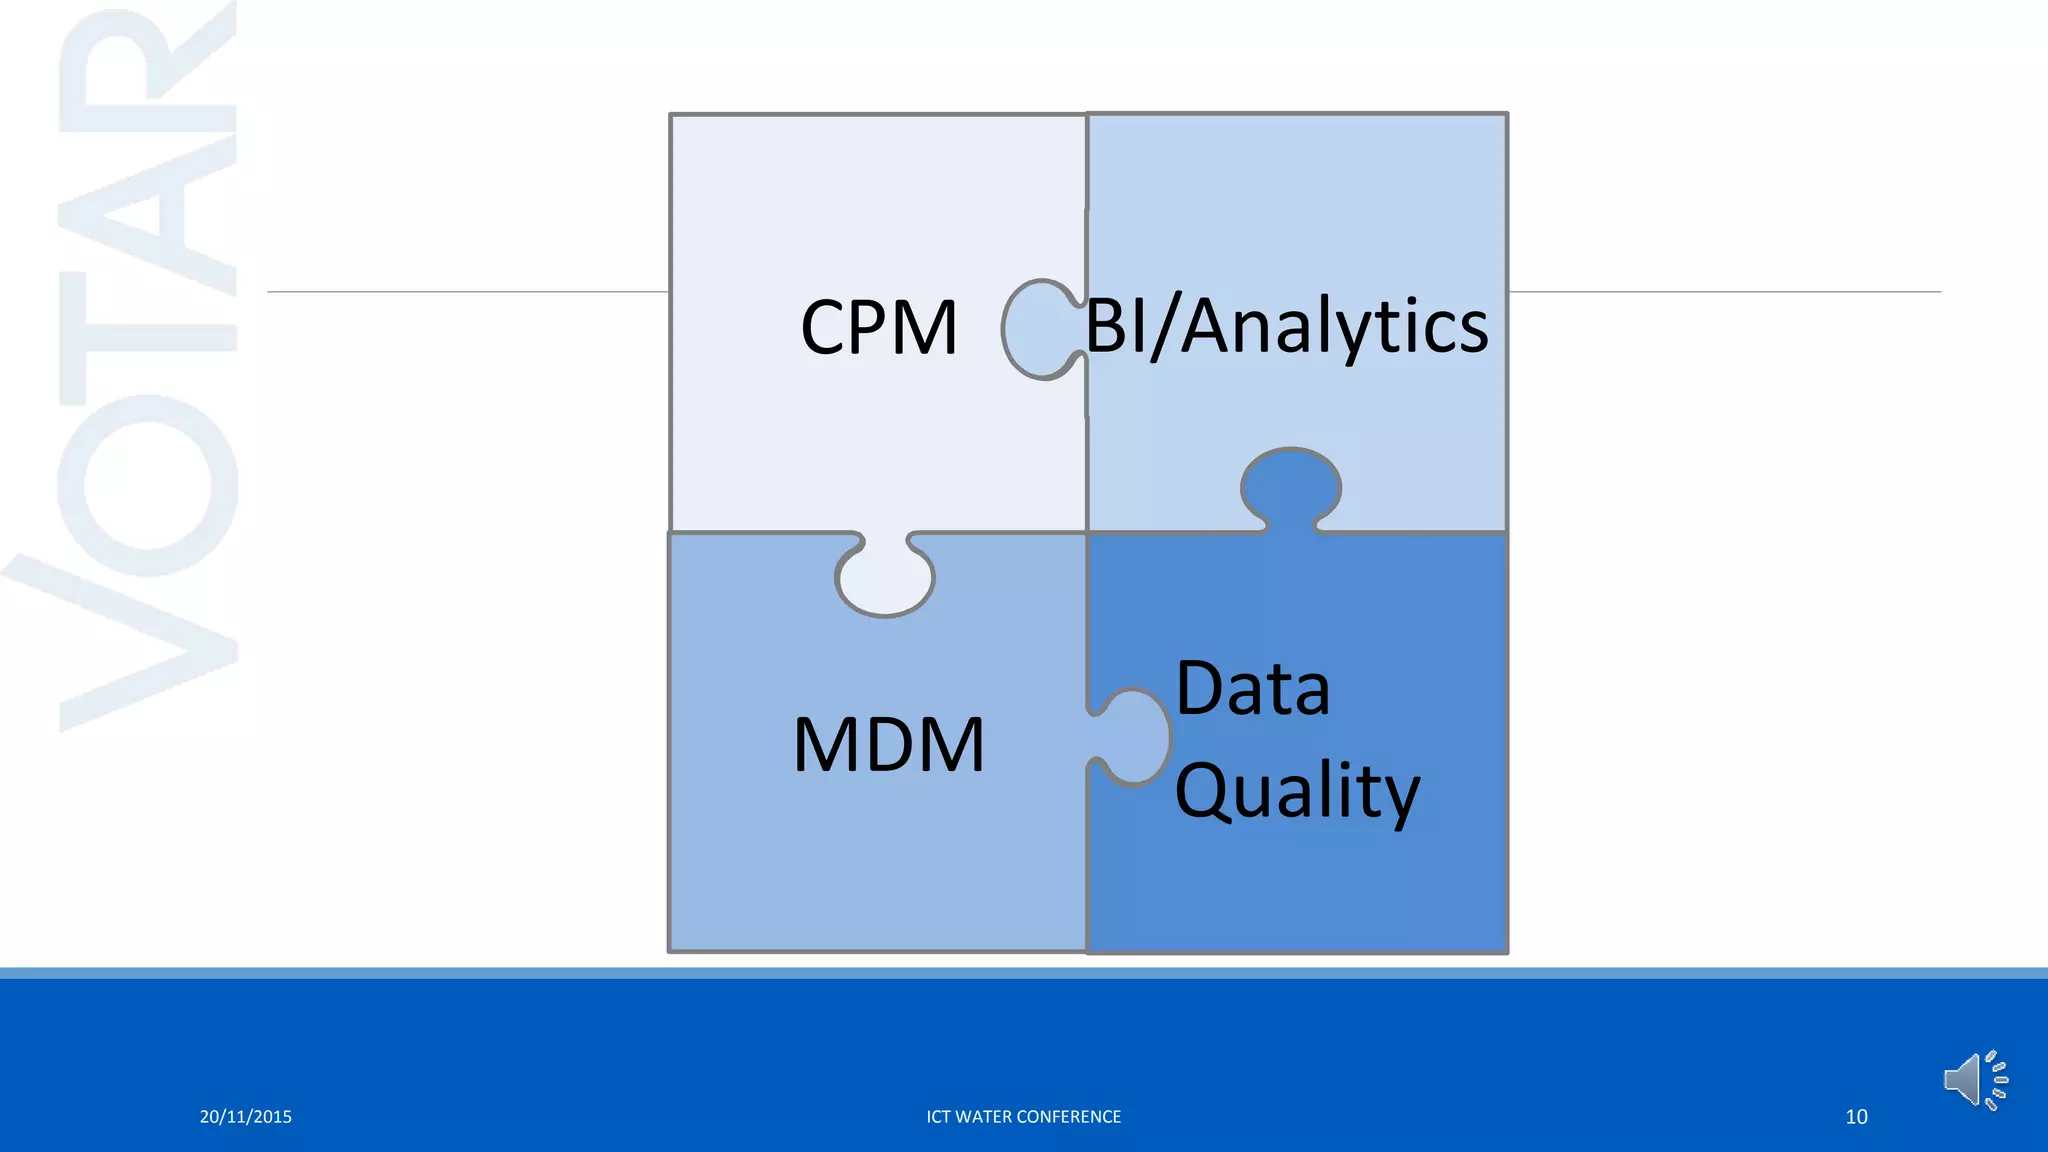
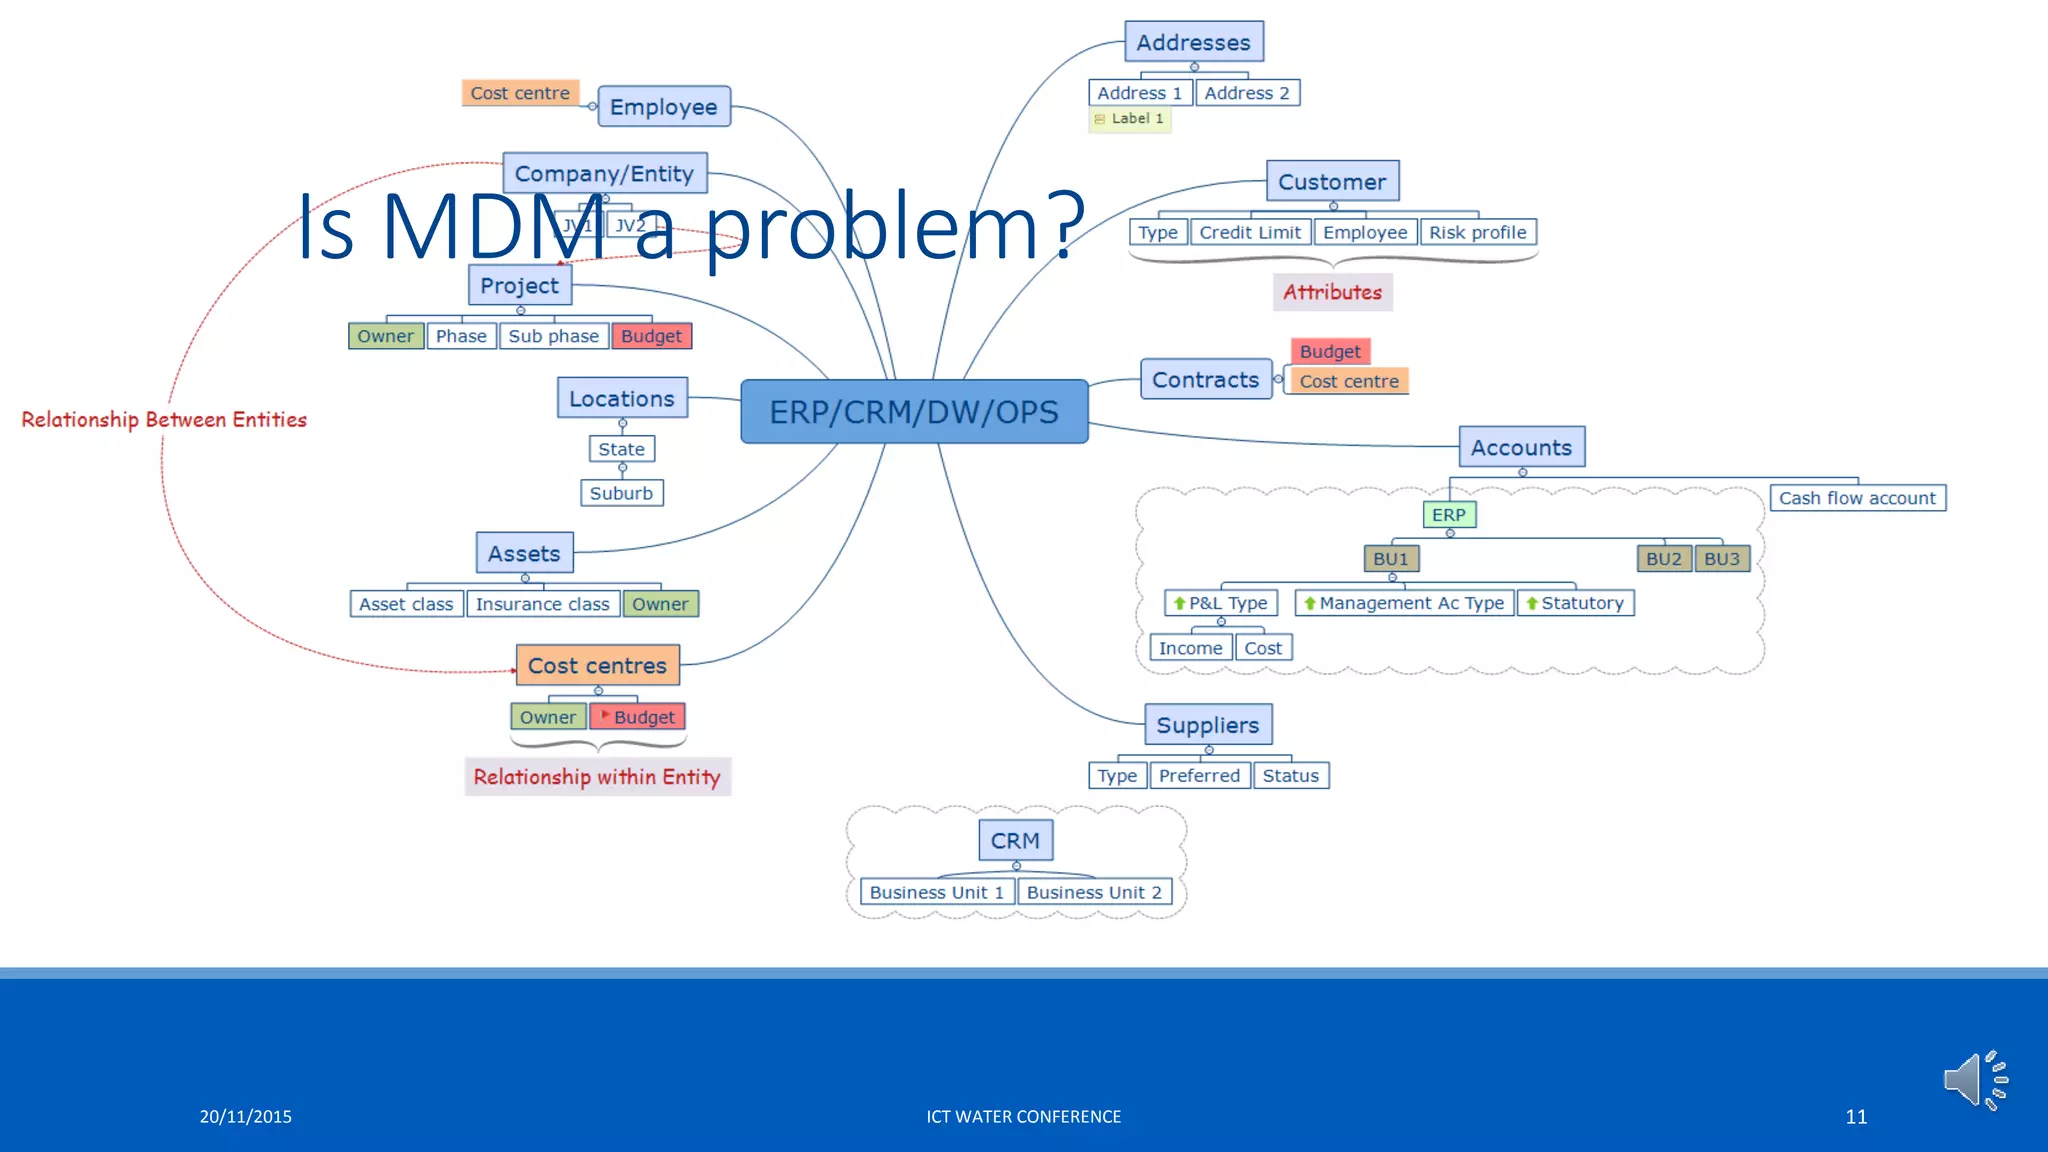
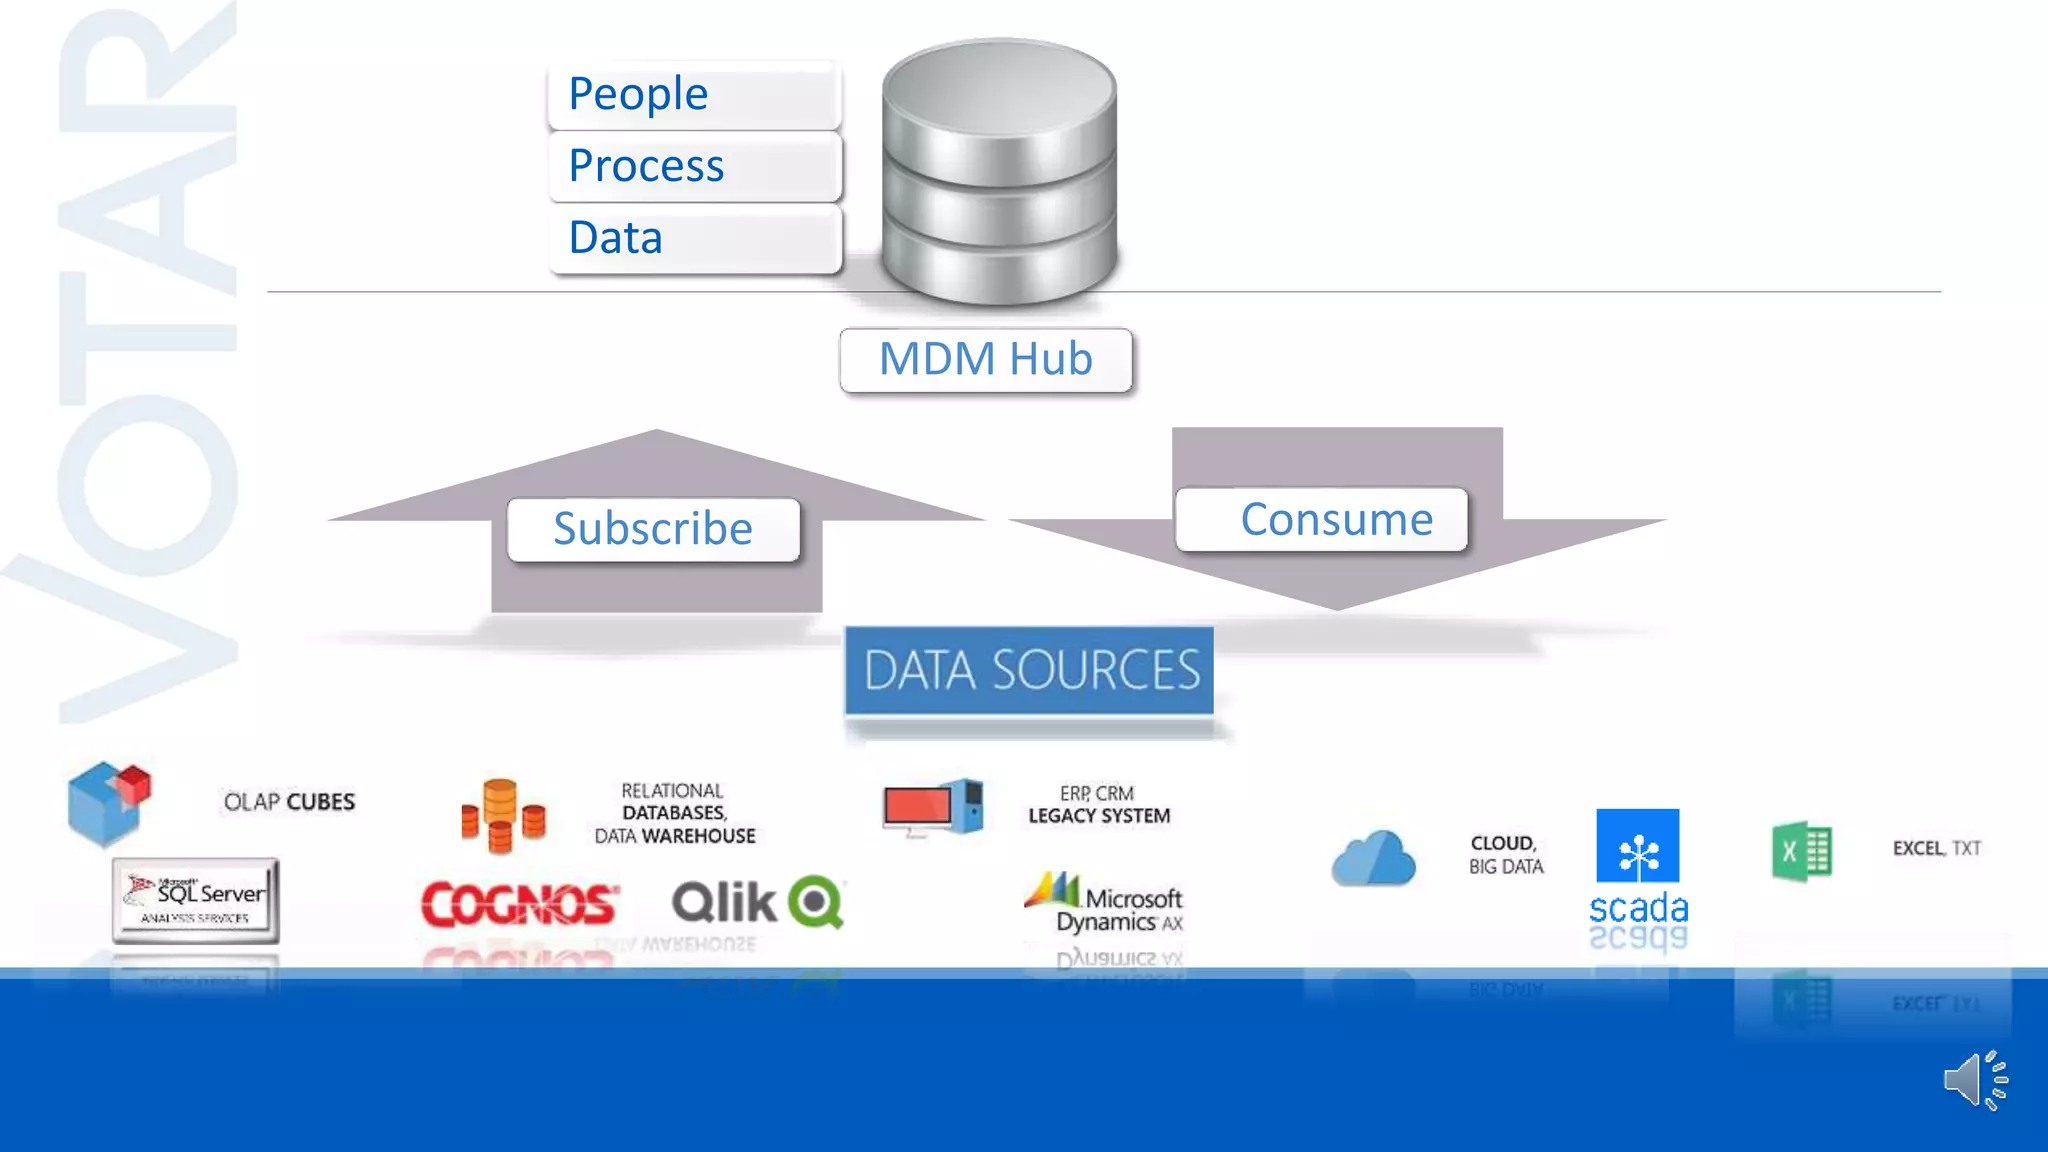
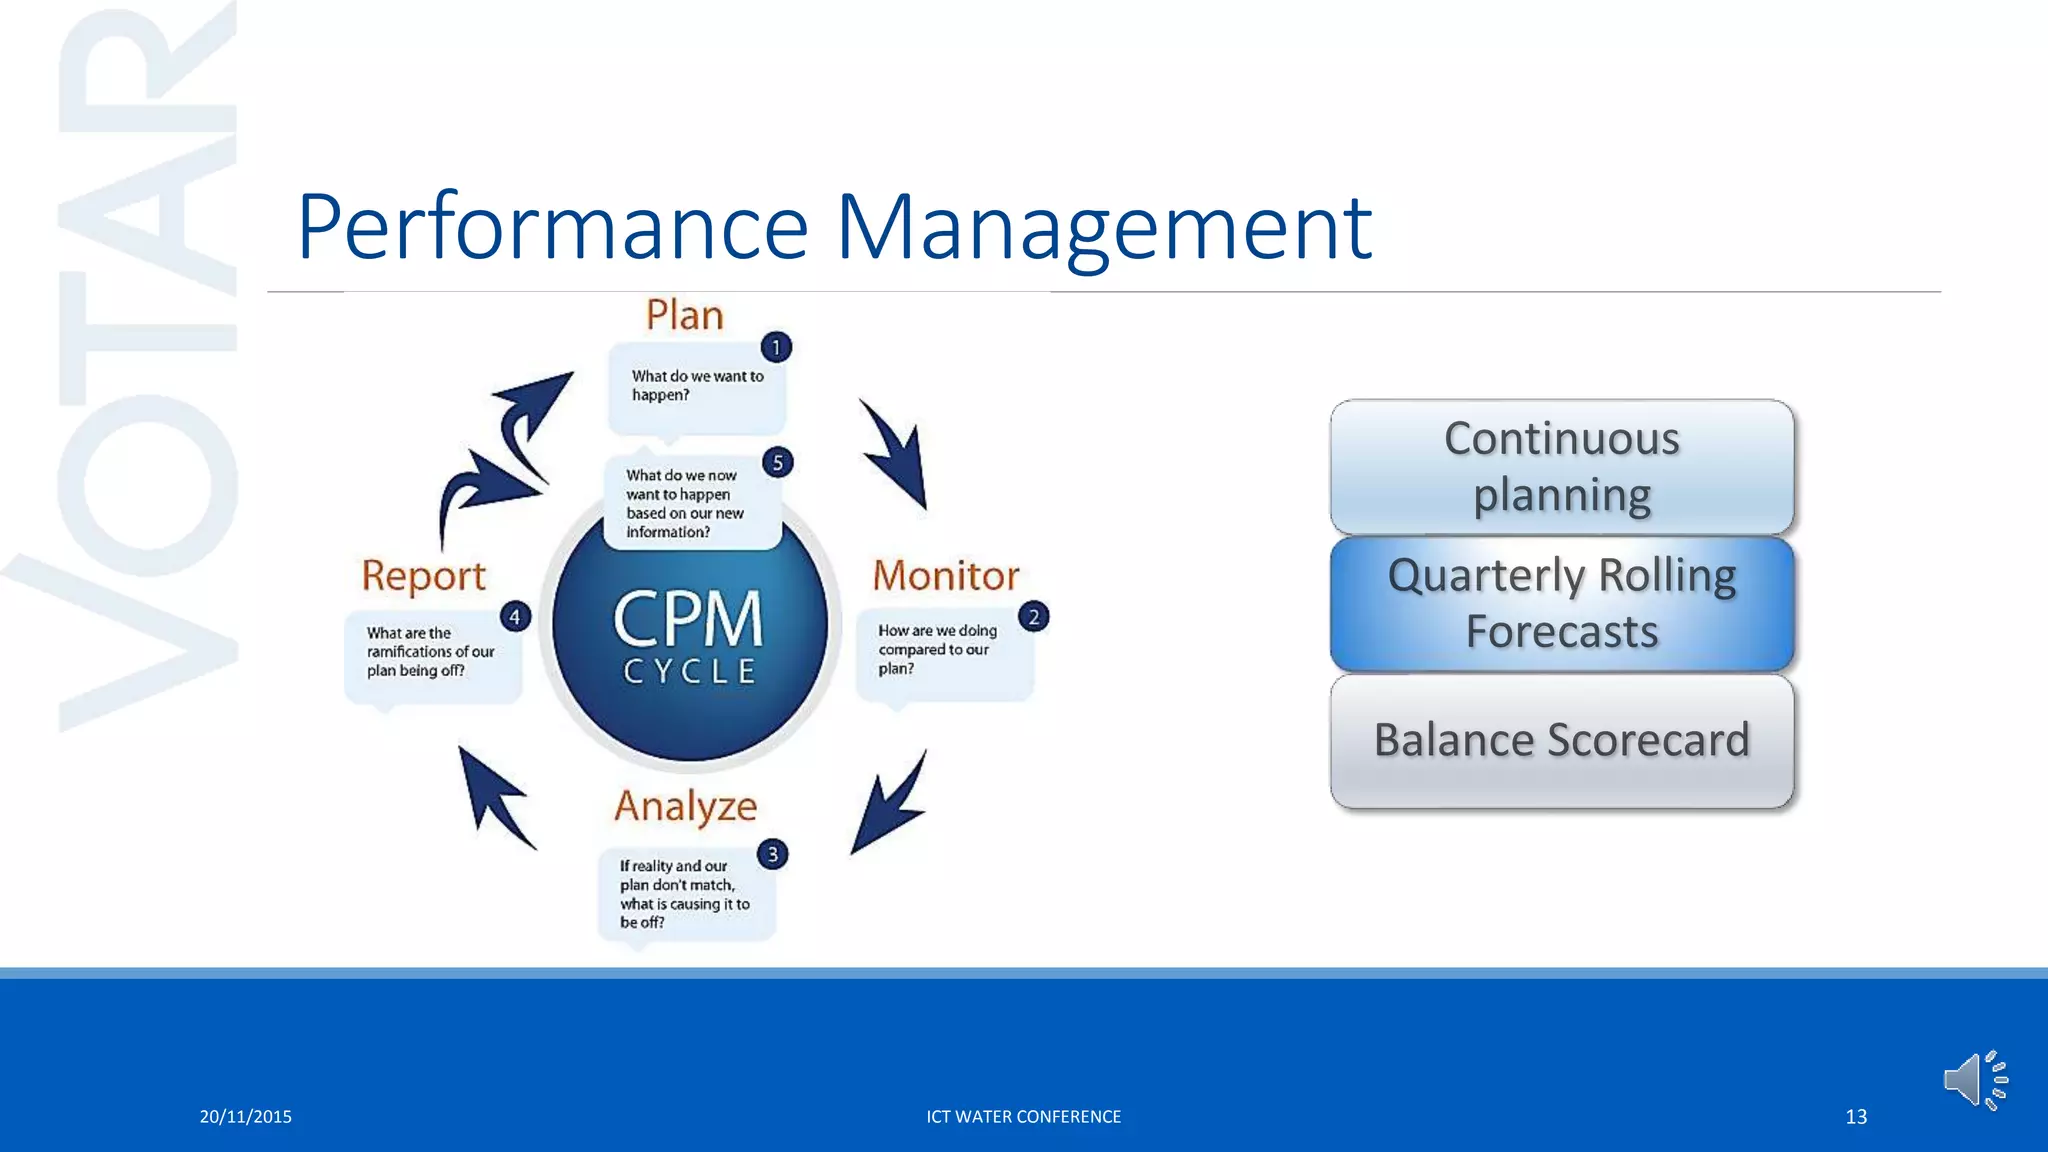
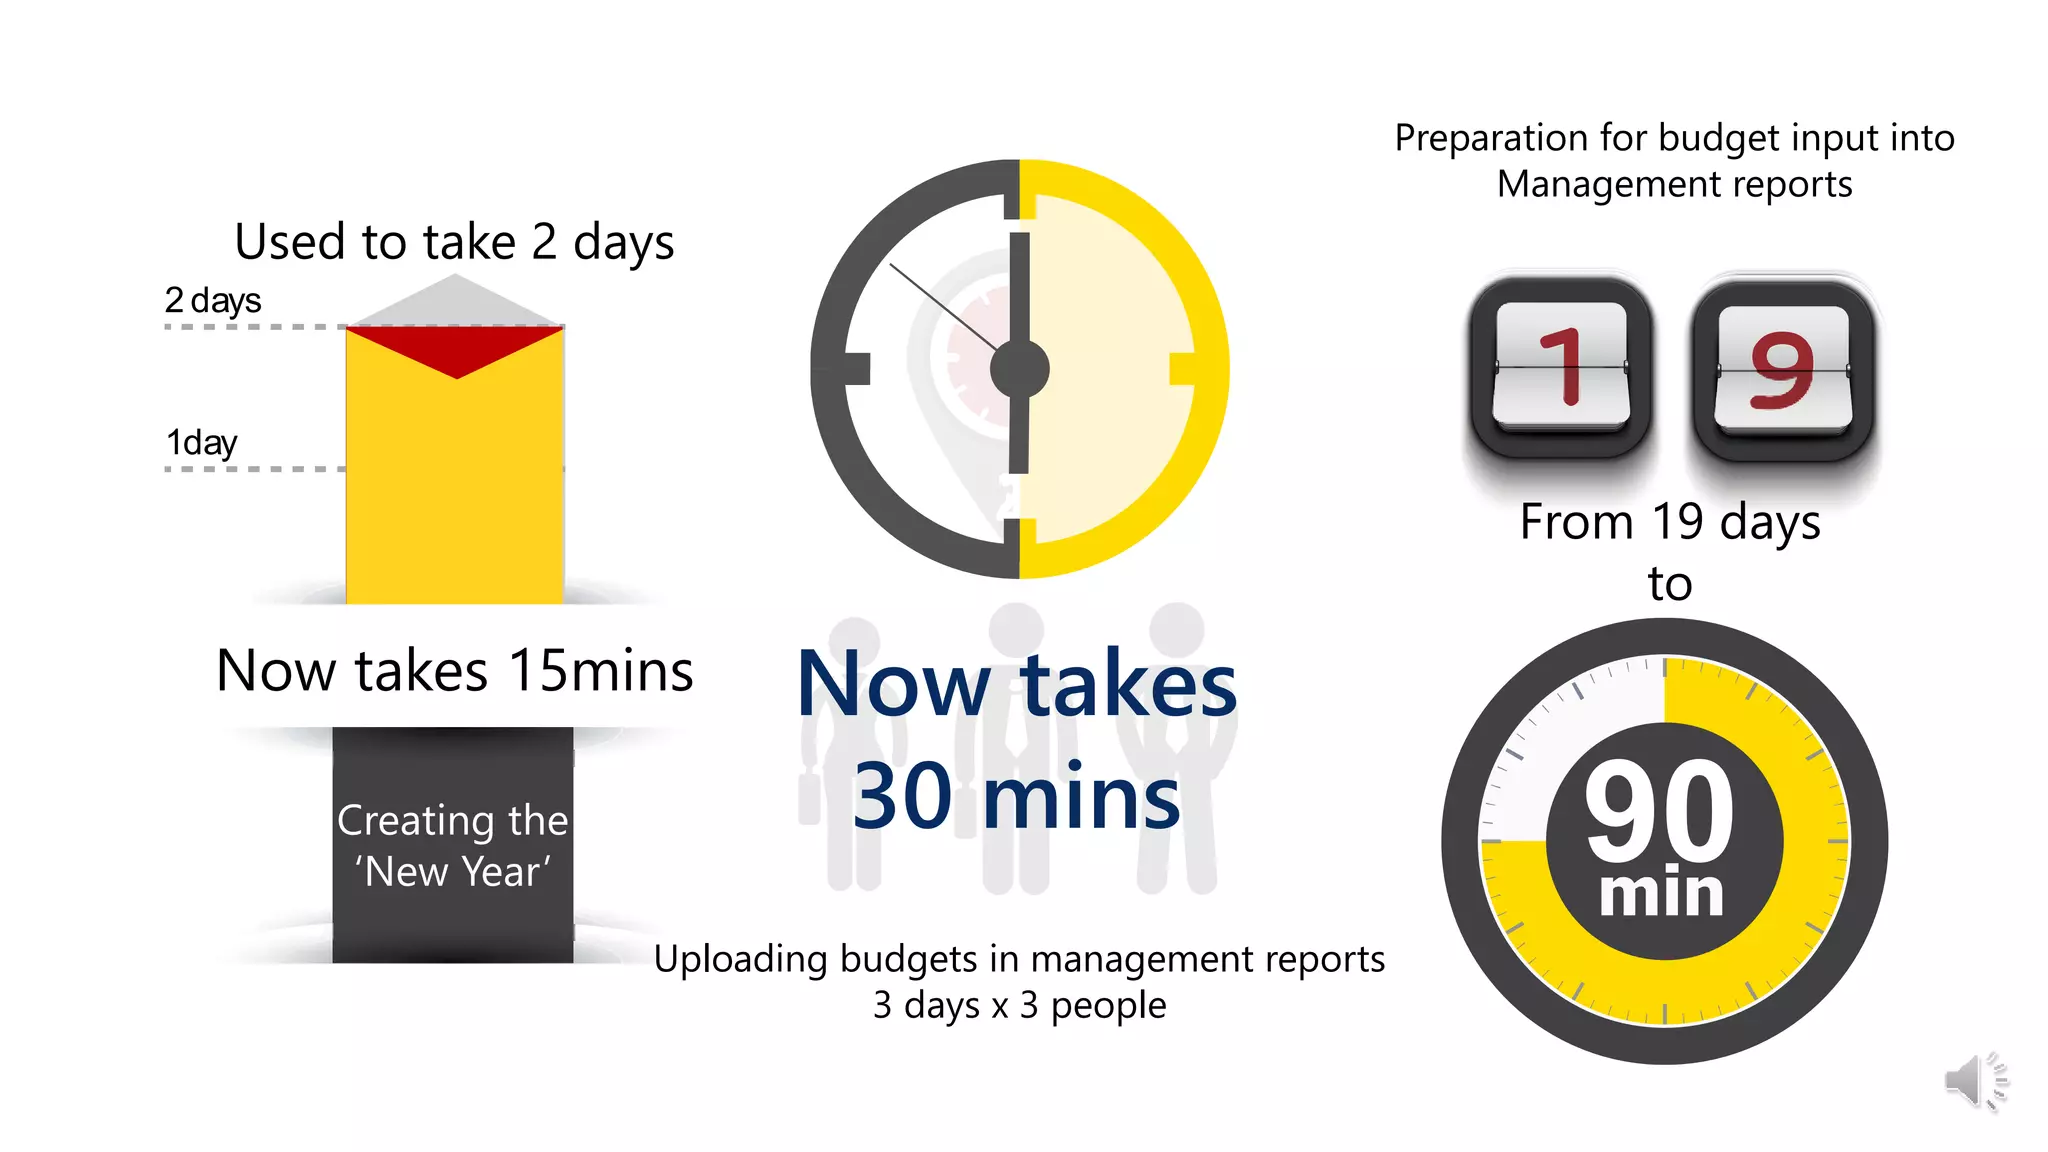
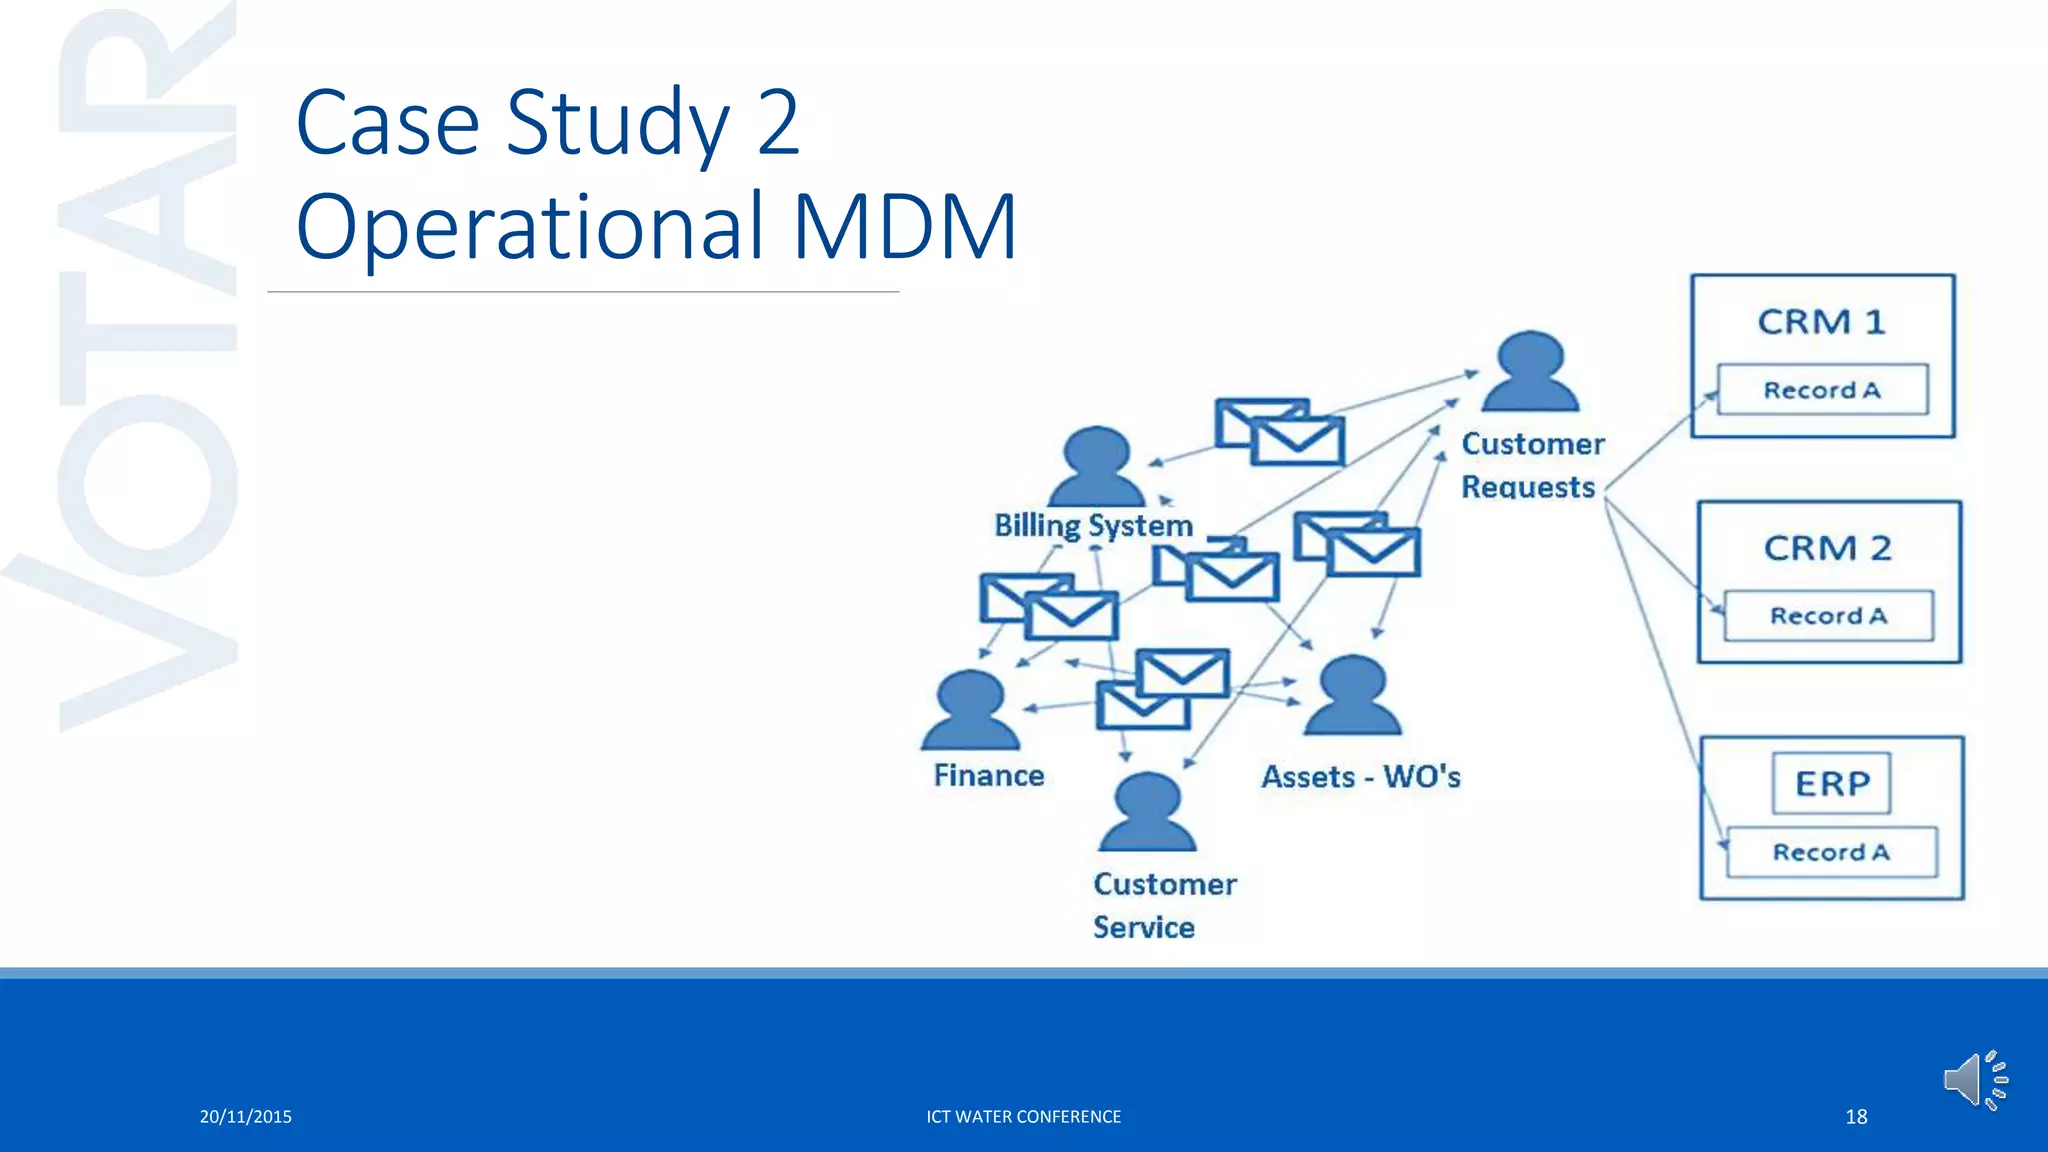
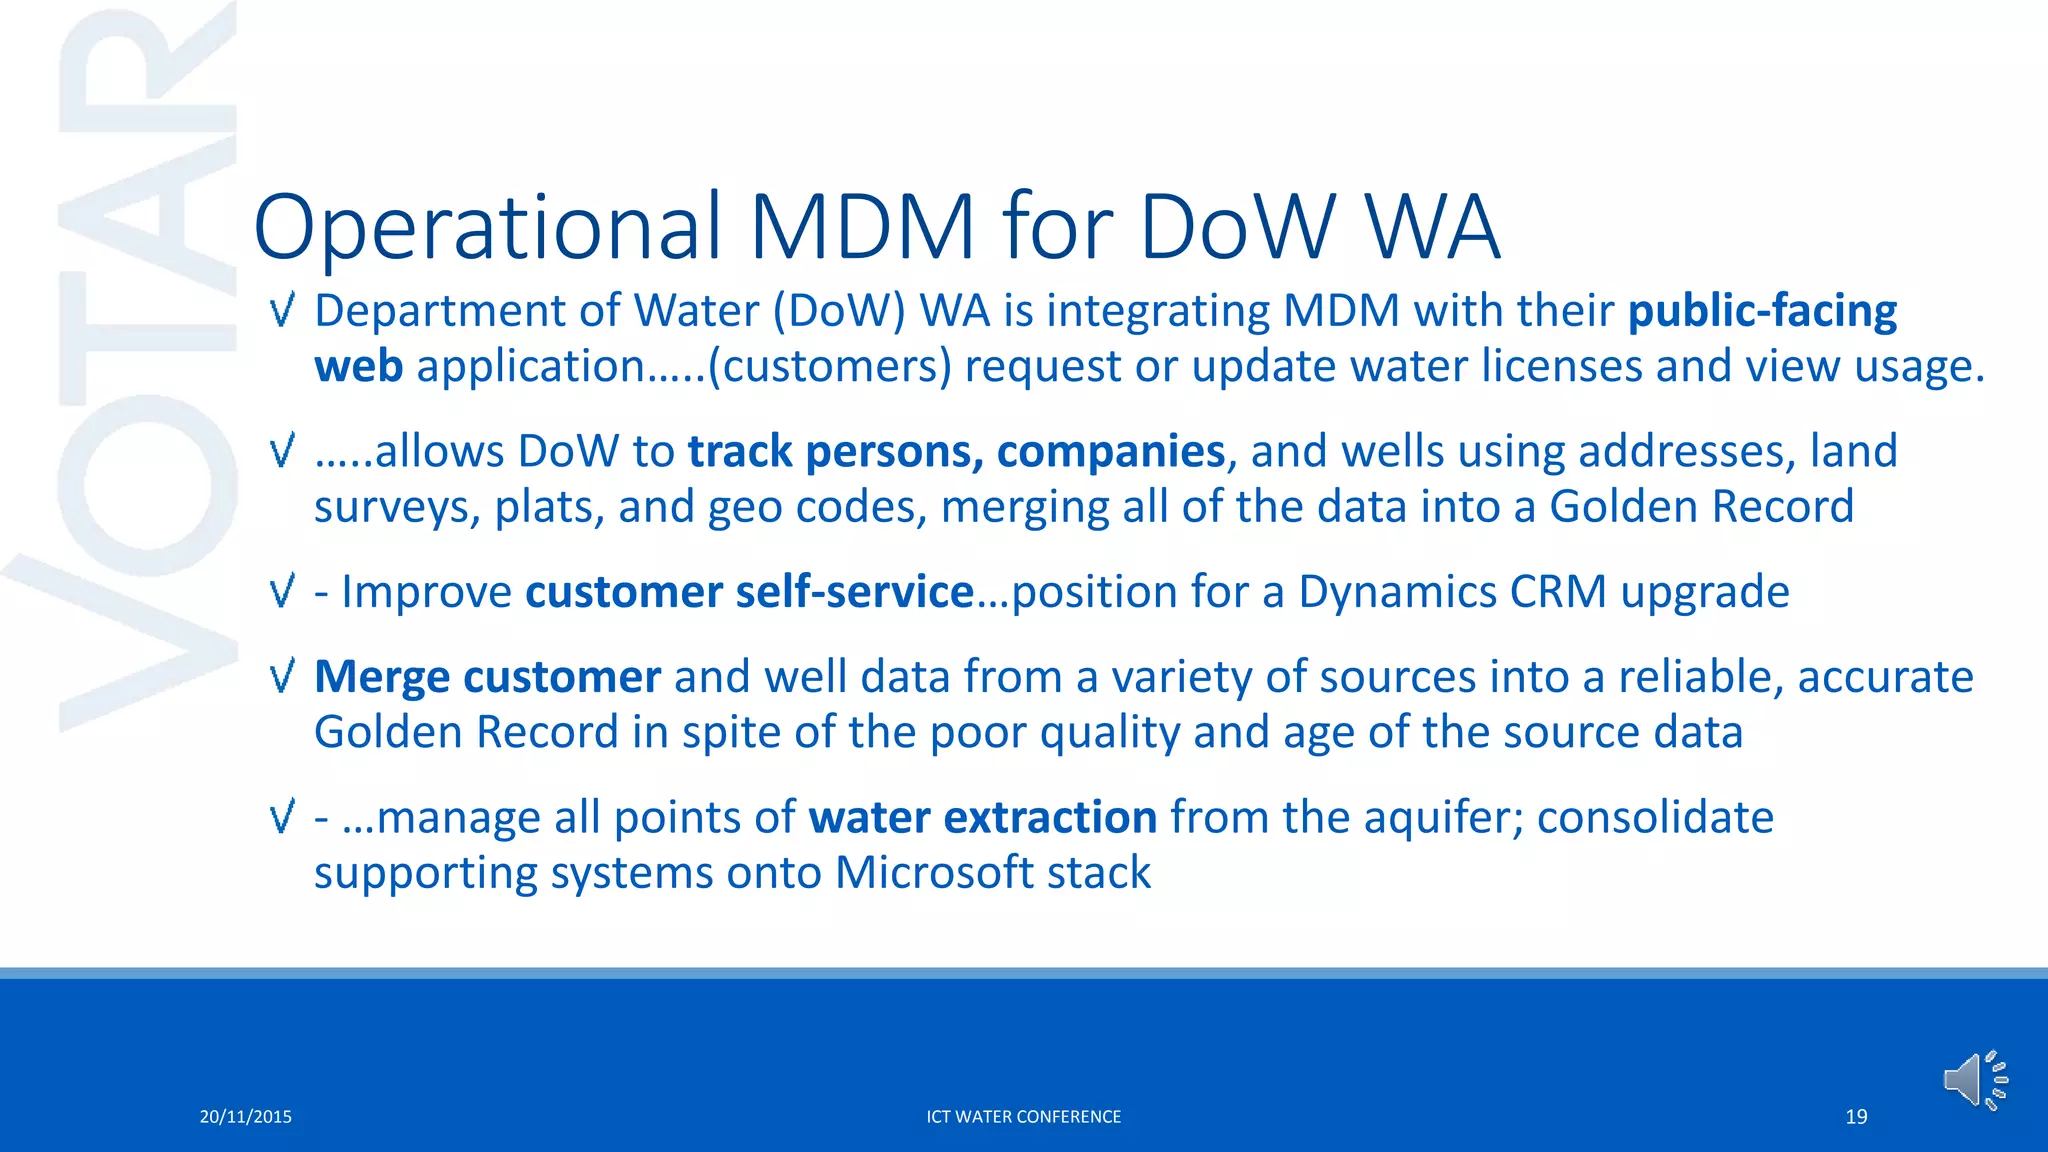


The document discusses the importance of high quality data and performance management systems in business. It provides examples of how utilities have used master data management (MDM) and business intelligence (BI) solutions to improve data quality, integrate systems, and enable faster and more effective decision-making. Specifically, one case study describes how a utility reduced budget preparation time from 19 to 3 days by centralizing data and systems. Another case study outlines how a Department of Water used MDM to improve customer self-service and consolidate various water usage data sources.


![[Webinar] 7 Reasons to Change Your Budgeting & Forecasting Process](https://cdn.slidesharecdn.com/ss_thumbnails/infographic-office-of-finance-slideshare-170320125614-thumbnail.jpg?width=640&height=640&fit=bounds)


