Download to read offline
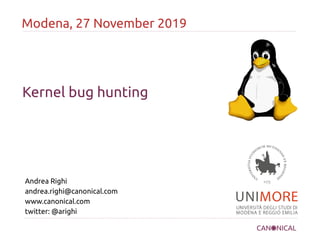
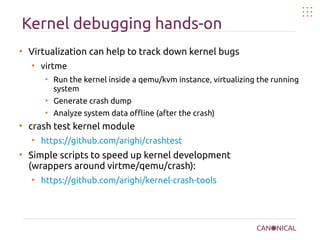
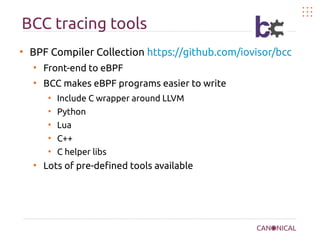
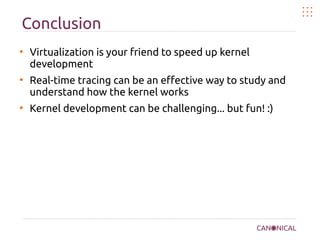
![Linux kernel is complex
●
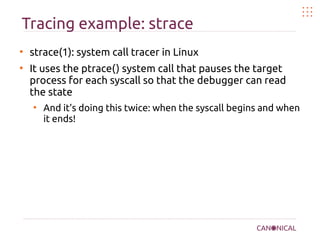
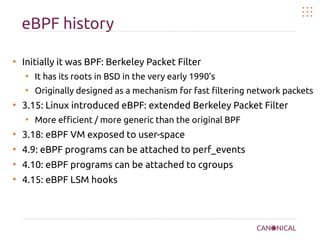
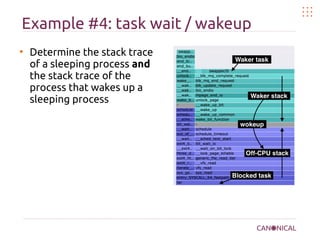
25.590.567 lines of code right now
find -type f -name '*.[chS]' -exec wc -l {} ; | awk 'BEGIN{sum=0}{sum+=$1}END{print sum}'
●
229 patches last week week
git log --oneline v5.4-rc7..v5.4-rc8 | wc -l
●
195 files changed, 3398 insertions(+), 4081 deletions(-)
git diff --stat v5.4-rc7..v5.4-rc8 | tail -1](https://image.slidesharecdn.com/kernel-bug-hunting-191127064108/85/Kernel-bug-hunting-2-320.jpg)
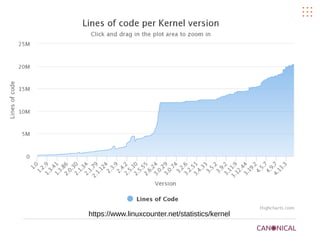
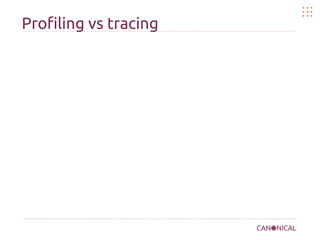
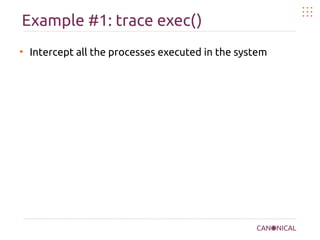
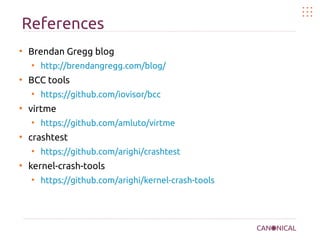
![eBPF as a VM
●
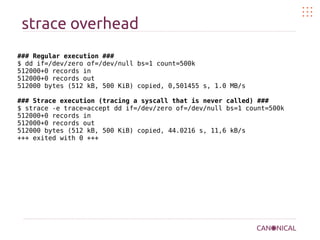
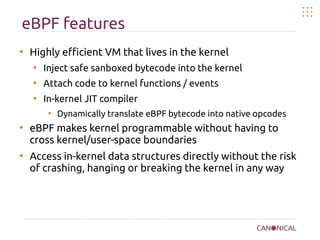
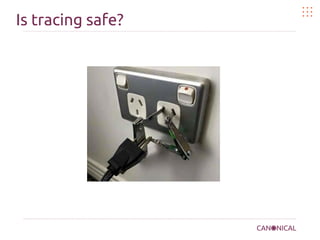
Example assembly of a simple
eBPF filter
●
Load 16-bit quantity from offset
12 in the packet to the
accumulator (ethernet type)
●
Compare the value to see if the
packet is an IP packet
●
If the packet is IP, return TRUE
(packet is accepted)
●
otherwise return 0 (packet is
rejected)
●
Only 4 VM instructions to filter
IP packets!
ldh [12]
jeq #ETHERTYPE_IP, l1, l2
l1: ret #TRUE
l2: ret #0](https://image.slidesharecdn.com/kernel-bug-hunting-191127064108/85/Kernel-bug-hunting-16-320.jpg)
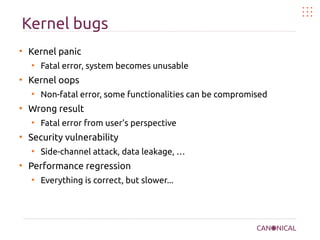
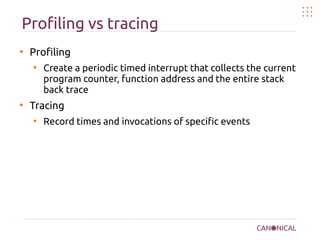
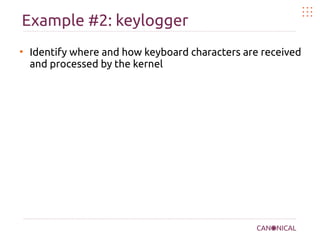
![Flame graphs
●
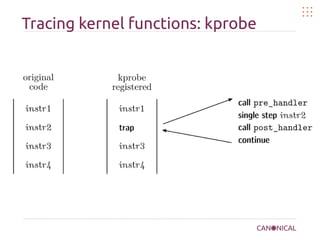
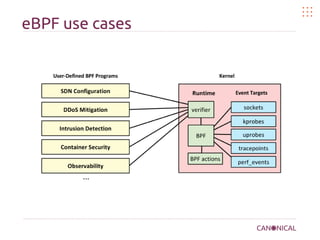
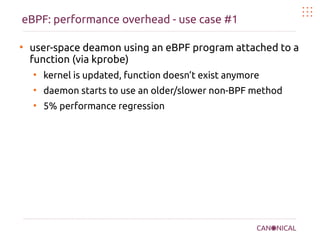
CPU flame graphs
●
x-axis
sample population
●
y-axis
●
stack depth
●
Wider boxes =
More samples =
More CPU time =
More overhead!
Flame Graph Search
s..
sun/nio/ch/SocketChannel..
org/mozi..
org..
io..
d..
tcp_v4_rcv
i..
org..
vfs_write
io/netty/channel/AbstractChannelHandlerContext:.fireChannelRead
JavaCalls::call_virtual
o..
ip_q..
org/mozi..
tcp_sen..
cpu..
org/..
[unknown]
io/netty/channel/AbstractCha..
JavaCalls::call_virtual
org/mozilla/javascript/gen/file__root_vert_x_2_1_..
ip..
io/netty/channel/nio/AbstractNioByteChannel$NioByteUnsafe:.read
io/netty/channel/nio/Abstr..
t..
s..
o..
JavaCalls::call_helper
Interpreter
ip_..
__do_softirq
ip_local_out
ep_p..
org/mozilla/javas..
s..
org/mozilla/javascript/gen/file__root_vert_x_2_1_5_sys_mods_io..
system_ca..
s..
_..
[unkn..
__..
sta..
sun..
_..
tcp_transmit_skb
do_softirq
org/m..
__..
JavaThread::thread_main_inner
io/netty/channel/ChannelDupl..
io/netty/channel/DefaultCha..
java
ip_rcv_fi..
t..
G..
o..
tcp_v4_..
__tcp..
do_sync_write
v..
x..
call_stub
ip_finish_out..
net_rx_act..
io/netty/channel/ChannelOut..
wrk
tcp_write_xmit
ip_..
loc..
syste..
i..
aeProcessEvents
system_call_fastpath
org..
do..
local_bh_en..
or..
swapper
org/mozilla/javascript/gen/file__root_vert_x_2_1_5..
JavaThread::run
sun/nio/ch/FileDispatch..
[..
__tcp_push_pendi..
tc..
sun/re..
tcp_..
tcp_w..
process_ba..
io/ne..
[..
inet_se..
ip..or..
thread_entry
Interpreter
org/vertx/java/core/http/impl/DefaultHttpServer$ServerHandler:.doM..
tcp_rcv..
vfs_write
ip_queue_xmit
sock_aio..
aeMain
_..
org/vertx/java/core/net/impl/VertxHandler:.channelRead
org/moz..
__netif_r..
__netif_r..
io/netty/channel/AbstractCh..
do_softirq_..
org/mozilla/javascript/gen/file__root_vert_x_2_1_5_sys_mods_io_..
io/netty/channel/nio/NioEventLoop:.processSelectedKeys
org/mozilla/javas..
Interpreter
so..
_..
[unknown]
io/netty/channel/AbstractCh..
or..
io/netty/channel/AbstractChannelHandlerContext:.fireChannelRead
ip_local_..
__..
org/vertx/java/core/net/impl..
io/..
sock_aio_write
ip_rcv
tcp_sendmsg
e..
do..
thread_main
ip_..
io..
ip_output
io/netty/channel/nio/NioEventLoop:.processSelectedKeysOptimized
java_start
org/vertx/java/core/http/impl/ServerConnection:.handleRequests..
pr..
socke..
sys_e..
org/moz..
or..
io/netty/channel/AbstractCha..
io/netty/handler/codec/ByteToMessageDecoder:.channelRead
x..
io/netty/channel/AbstractCha..
h..
start_thread
ne..
inet_sendmsg
start_thread
r..
ip_local_..
org/mozilla/javas..
o..
sys_write
socket_wri..
i..
io/netty/handler/codec/ByteT..
org/..
do_sync_..
sys_write](https://image.slidesharecdn.com/kernel-bug-hunting-191127064108/85/Kernel-bug-hunting-19-320.jpg)


The document discusses kernel bug hunting in Linux, highlighting the complexity and size of the Linux kernel, as well as common kernel bugs and debugging techniques. It covers the role of eBPF in kernel programming, profiling versus tracing, usage of flame graphs for performance analysis, and various tools for kernel tracing. The conclusion emphasizes the benefits of virtualization and real-time tracing in kernel development while providing references for further reading.


![谷歌留痕技术教程[ 𝙩𝙤𝙥 𝟮𝟯𝟯. 𝙘 𝙤𝙢 ]](https://cdn.slidesharecdn.com/ss_thumbnails/top233-260130173900-2eb784f9-thumbnail.jpg?width=640&height=640&fit=bounds)


