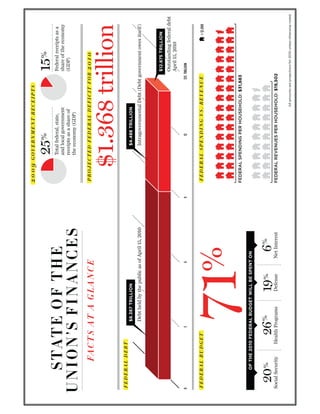
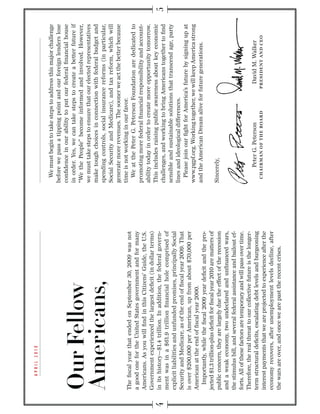
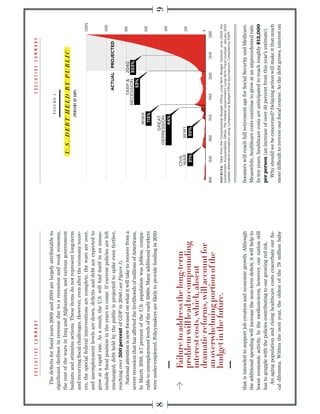
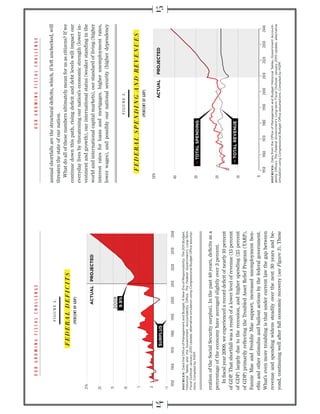
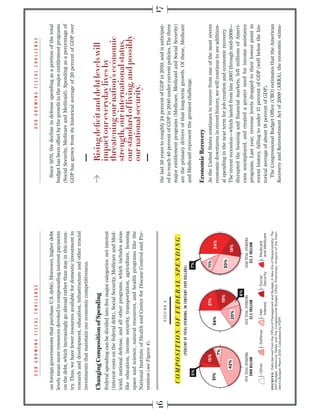
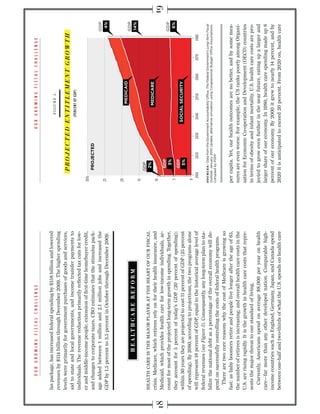
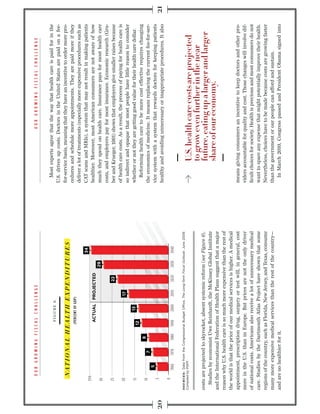
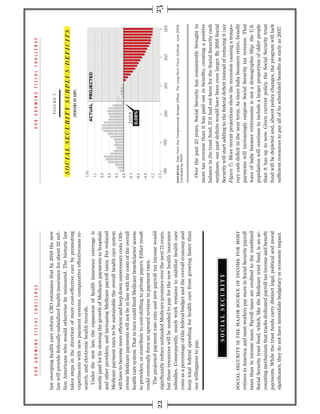
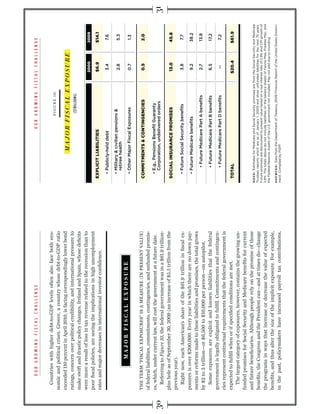
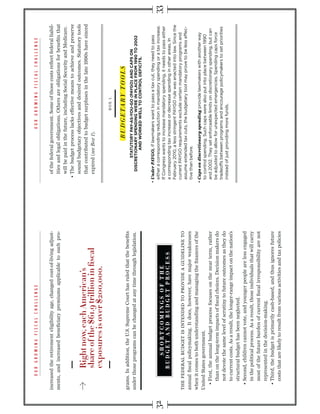
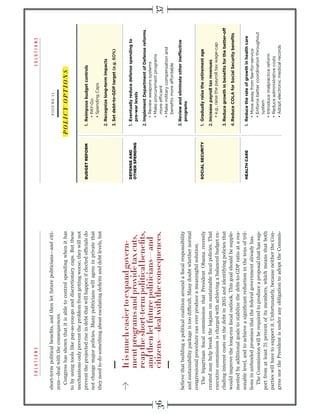
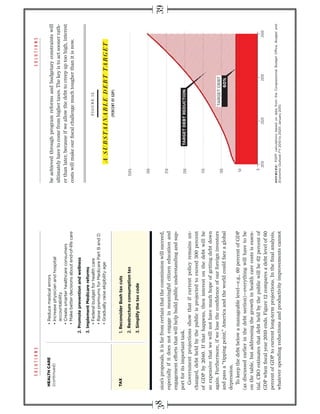
The document discusses the growing fiscal challenges facing the United States, including rising budget deficits and national debt levels. It notes that while near-term deficits are largely due to temporary factors like the recession and stimulus measures, long-term structural deficits pose a serious threat if left unaddressed. In particular, rising healthcare costs and spending on entitlement programs like Medicare and Medicaid are projected to account for an unsustainable portion of the federal budget going forward. Urgent action is needed to put the country's fiscal policies on a more sustainable path.
- Missouri is facing major budget issues as state revenues have declined significantly due to the economic downturn. Federal stabilization funds have helped but will run out, leaving a large shortfall.
- State revenues are down 10% in the first quarter of FY2010 and are projected to decline further. Unemployment will remain high.
- Governor Nixon has already implemented $200M in budget cuts for FY2010 but further cuts will likely be needed. The stabilization funds have masked the true budget problems.
- When the federal funds expire after FY2011, Missouri faces a major fiscal crisis without new revenue sources or job growth to boost the economy.
The document discusses the national debt of the United States, which currently stands at over $18 trillion. It explores the history of rising US debt levels and the economic effects of increasing versus consolidating the debt. Increasing debt leads to higher interest rates, less investment, and reduced GDP growth. Consolidating debt has short-term negative effects but long-term benefits like lower interest rates and more funding for programs. The document also examines threats of sovereign default and financial crises based on examples from other countries.
The Development of the Reverse Mortgage MarketTom Roughan
The document discusses the emerging retirement liquidity crisis facing Baby Boomers in the US and the development of the reverse mortgage market as a solution. It notes that many Boomers are unprepared for retirement due to low savings rates and problems with Social Security funding. Reverse mortgages allow homeowners to use home equity as retirement income. The government played a key role in standardizing regulations and creating an insurance program to encourage the reverse mortgage market to develop, addressing earlier issues around complexity and costs that limited adoption.
The document discusses the causes and effects of the global financial crisis that began in 2007. It describes how the crisis originated from risky subprime mortgages in the US that were packaged into securities and spread throughout the global financial system. When housing prices declined and borrowers defaulted, it triggered a financial crisis that caused stock market declines, limited investment banking, and severe recessions around the world. Governments responded with stimulus packages, interest rate cuts, and bank bailouts to stabilize markets and economies. Reforms are still needed to prevent future crises through improved financial regulations and oversight.
The document discusses federal spending and revenue levels from 1965 to 2022. It notes that mandatory spending, which includes entitlement programs and interest on the debt, has increased nearly six times faster than discretionary spending. Runaway spending, not low tax revenue, is the main driver of future budget deficits, as spending is projected to remain above its historical average as a percentage of GDP, while revenue returns to its average. Cutting spending is necessary to put the budget on a sustainable path.
State of the Construction and Surety Industry Report (2009)Lisa Dehner
This document provides an overview of the state of the U.S. economy, construction industry, and surety industry. It finds that the current recession began in December 2007 and is the longest since the Great Depression. Both the construction industry and stock market typically follow trends in GDP. While the private construction sector has declined, public construction is forecast to grow due to a $131 billion stimulus package. Contractor profits are decreasing and surety losses are expected to rise in the coming years as economic conditions remain challenging.
The document provides an overview of public debt including its definition, history, types and trends in developing countries. It discusses how the role of governments has increased over time leading to rising public debt levels. Developing countries in particular have experienced growing debt burdens due to factors like budget deficits, economic crises, and infrastructure development needs. Prudent management of public debt is important to control costs and risks. The objectives of debt management include meeting government borrowing needs at minimum cost while developing domestic capital markets.
Get the Highlights of the Heritage Plan in our quick, easy-to-read overview. Saving the American Dream comes to life in a simple, condensed, graphics-rich format, simply presenting how The Heritage Foundation proposes to reform Medicare, Social Security, Medicaid, taxes, health insurance, and government spending. Published 2011.
State of the Construction and Surety Industry Report (2010)Lisa Dehner
The document provides an overview of the state of the construction and surety industries in 2010. It summarizes that the recession officially ended in June 2009 according to the National Bureau of Economic Research, though the economic recovery has been slow. The construction industry continues to struggle with low growth across most sectors. Contractor failures are rising as fewer projects lead to increased competition. Surety industry losses grew nearly 50% from 2008 to 2009 and the fourth surety loss cycle is expected to result in increasing loss ratios through 2012.
Charting the Financial Crisis: A Narrative eBookShavondaBrandon
The global financial crisis of 2007-2009 and subsequent Great Recession constituted the worst shocks to the United States economy in generations. Books have been and will be written about the housing bubble and bust, the financial panic that followed, the economic devastation that resulted, and the steps that various arms of the U.S. and foreign governments took to prevent the Great Depression 2.0. But the story can also be told graphically, as these charts aim to do.
What comes quickly into focus is that as the crisis intensified, so did the government’s response. Although the seeds of the harrowing events of 2007-2009 were sown over decades, and the U.S. government was initially slow to act, the combined efforts of the Federal Reserve, Treasury Department, and other agencies were ultimately forceful, flexible, and effective. Federal regulators greatly expanded their crisis management toolkit as the damage unfolded, moving from traditional and domestic measures to actions that were innovative and sometimes even international in reach. As panic spread, so too did their efforts broaden to quell it. In the end, the government was able to stabilize the system, re-start key financial markets, and limit the extent of the harm to the economy.
No collection of charts, even as extensive as this, can convey all the complexities and details of the crisis and the government’s interventions. But these figures capture the essential features of one of the worst episodes in American economic history and the ultimately successful, even if politically unpopular, government response.
Following Presentation deals with brief outline over what is known as "Global Recession". It has novice friendly language and attention seeking approach.
Government spending has been steadily increasing over the past 40 years, even when adjusted for inflation and population growth. This rising government spending has caused economic growth and standards of living to slow down, with each successive decade seeing smaller gains. If current trends continue, future government spending will dramatically outpace GDP growth and cause the national debt to reach unsustainable levels, potentially limiting prosperity for future generations. Cutting government spending is necessary to increase economic growth and standards of living going forward.
The document provides commentary on macroeconomic conditions and trends in various countries/regions. Key points include:
1) A second Greek bailout is likely as the country works to implement austerity measures to reduce its deficit. However, there is uncertainty around reaching agreements on debt restructuring.
2) Consumer confidence fell in the US, Eurozone, and UK as economies showed signs of slowing. Growth is expected to remain weak.
3) The Portuguese government unveiled new fiscal measures but the country's fiscal position may be worse than expected due to risks from state-owned enterprises and public-private partnerships.
4) German unemployment declined further but the resilience of its economy is unsustainable amid the debt crisis; French
Mark Neumann's 5-Year Plan to Balance the Budgetneumannforsenate
The document discusses America's growing federal debt and proposes a plan called America's New Way Forward to balance the budget and pay off the debt within 30 years. It would repeal Obamacare, make Bush tax cuts permanent, cut $1.364 trillion in spending over 5 years, cut $368 billion in taxes/spending, and limit annual spending growth to 2.5% after 2017. It also outlines 150 government programs that could be cut or eliminated to reduce spending. The plan aims to balance the budget by 2017, repay the debt by 2041, and strengthen programs like Social Security, Medicare and defense.
The document discusses the recent turmoil in global financial markets and argues that governments have failed to address the root causes of the economic crisis. It makes three key points:
1) Stock market declines show that the recovery is fragile and a double-dip recession may be on the horizon.
2) Governments have kicked the can down the road rather than fixing underlying problems, and the global economic landscape now has additional constraints making responses more difficult.
3) The US economy in particular remains weak with high unemployment, stagnant GDP, and a large budget deficit, showing similarities to Japan's "lost decade" raising the risk of prolonged low growth in the US.
The document discusses national debt and deficits. It notes that the US national debt was $5.6 trillion in 1999 and $12.8 trillion in 2010. It explains that debt is the accumulation of yearly deficits and surpluses, with deficits added to the debt and surpluses reducing it. The document also discusses "pork barrel" spending projects by Congress and debates around taxation and proportional versus progressive tax systems.
Learn about the expiring tax breaks and automatic spending cuts scheduled to take effect at the end of 2012 in the United States, including the forecasted economic impact and where Democrats and Republicans stand.
The document analyzes debt levels across various sectors in the US economy following the 2008 financial crisis to determine if conditions are ripe for a sequel to the book and film "The Big Short." It finds that household, financial institution, corporate, and state/local government debt all improved significantly from crisis levels. While federal debt ballooned, interest payments remain a small percentage of spending for now. With debt trends healthier overall, the conditions that caused the crisis are unlikely to reoccur, so a sequel called "The Big Short 2" would lack a true story to be based on.
This document provides information about the national debt of the United States from an organization called "Fix the Debt". It discusses that the current national debt is over $13 trillion and is projected to continue rising without action. It outlines some of the main causes of the debt as well as the effects, including higher costs of living and reduced ability to respond to future crises. It argues that reforms are needed to entitlement programs, taxes, and spending to put the debt on a sustainable long-term path.
The document summarizes the economic situation in the United States from 1981 to 2011 under different presidents. It discusses Ronald Reagan's economic policies of reducing taxes and government spending which led to strong economic growth during his terms. It then discusses the policies and economies under George H.W. Bush, Bill Clinton, George W. Bush, including the 2008 financial crisis and recession at the end of Bush's second term.
The document discusses the history and current state of the U.S. public debt. As of November 2016, the debt was over $19.9 trillion, nearly double what it was in November 2008. Past administrations, including Reagan, Clinton, Bush, and Obama, pursued different strategies to manage the debt such as deficit reduction acts, stimulus packages, and quantitative easing. The Trump administration plans to focus on 4% GDP growth, trade reform, lowering interest payments on the debt, and budget cuts to entitlement programs to address the debt over the long run through policy changes rather than sole focus on debt reduction.
"The Economy under President Obama" tells the story of the 2009-2016 period using a series of economic and budgetary charts. Definitive non-partisan sources such as the Federal Reserve Economic Database (FRED) and Congressional Budget Office (CBO) are used, along with major media sources.
The presentation covers the Great Recession and response, fiscal policies, trends in major economic variables, income inequality and the ACA/Obamacare. Key questions covered include: 1) What did President Obama and Congress do to help or hinder the recovery? 2) What were the important decisions President Obama had to make? 3) How much of the national debt addition was due to the President's policies? 4) What were the trends in the key economic and budget variables? 5) What economic and budgetary legacy did he pass along?
The US debt crisis stems from political disagreements over raising the debt ceiling to continue paying bills. While Democrats sought to raise taxes on the wealthy and protect entitlement programs, Republicans demanded deep spending cuts without tax increases. After bitter negotiations, Congress passed a last-minute deal to raise the debt ceiling in exchange for $917 billion in spending cuts over 10 years and a joint committee tasked with finding $1.5 trillion more in cuts. However, Standard & Poor's downgraded US credit for the first time, citing political dysfunction and rising debt. The crisis increased uncertainty and weakened the dollar.
This document discusses the current economic challenges and provides suggestions for protecting assets during difficult financial times. It outlines six major obstacles slowing economic recovery, including accumulated debt, wealth destruction, declining incomes, the slow pace of government rescues, sinking confidence, and how to finance government programs. Specific concerns mentioned include declining asset prices, taxes, inflation, and unknown factors. The document recommends building cash reserves, selling bonds, considering inverse ETFs and gold funds, avoiding high-risk investments, and being wary of fraud. It offers to provide ongoing information and answers questions to help investors navigate the challenging environment.
Una central hidroeléctrica aprovecha la energía hidráulica de los ríos para generar energía eléctrica. La presa eleva el nivel del agua y el canal la conduce a las turbinas hidráulicas que transforman la energía hidráulica en mecánica para mover los generadores eléctricos. De esta forma, la naturaleza ofrece saltos de agua que pueden transformarse en energía eléctrica de forma limpia y sostenible.
All-Party Parliamentary Groups (APPG) Enterprise Forum (House of Lords) - Whi...enterpriseresearchcentre
This document discusses policies to support sustained growth among small and medium enterprises (SMEs). It reviews evidence that a small percentage of fast-growing SMEs generate a disproportionate share of new jobs. The paper examines international models of support for sustained SME growth, including systemic, holistic, and thematic approaches. It identifies seven guidelines for effective policy: enabling self-selection, selectivity, recognizing spillovers, sustained engagement, holistic support, partnership-based delivery, and regional organization. The overall aim is to develop proposals to improve support for sustained UK SME growth.
El documento proporciona instrucciones para abrir un correo adjunto, enviar un correo adjunto, y reenviar un correo. Explica los pasos para encontrar y abrir un archivo adjunto, agregar archivos adjuntos a un nuevo correo, y reenviar un correo existente a otro destinatario.
El documento describe los procesos de aprendizaje en un programa de mecánica diesel y automotriz del SENA, los cuales se enfocan en lo práctico, el mantenimiento de vehículos y su normatividad. Explica las tecnologías disponibles en los talleres como electrónica, hidráulica y motores, y las ocupaciones a las que pueden aspirar los estudiantes como técnicos en diferentes áreas automotrices. Finalmente, presenta ejemplos de proyectos en ejecución relacionados con el mantenimiento de vehículos y
Este documento resume un trabajo de investigación que analiza el nivel de satisfacción de los estudiantes con la enseñanza de los docentes de la carrera de Administración de Empresas de la U.A.G.R.M. a través de una encuesta aplicada a una muestra de 329 estudiantes. Los resultados muestran que los estudiantes están poco satisfechos con un promedio de 3.06 en una escala del 1 al 5. Se concluye que es necesario que las autoridades y docentes implementen programas para mejorar la calidad de la enseñanza y
La familia como agencia socializadora en el niñoteresapelaez8
La familia es el primer agente socializador y juega un papel fundamental en el desarrollo del niño. A través de la interacción, las relaciones afectivas y el modelado de conductas, la familia transmite valores, normas, roles y una identidad al niño. Además, la familia influye en la personalidad y autoestima del niño. El proceso de socialización familiar varía según factores como el sexo y ambiente sociocultural.
Certified Health Education Specialists (CHES) and Master Certified Health Education Specialists (MCHES) must renew their certification annually and recertify every five years. Recertification requires earning 75 continuing education contact hours over five years, with a minimum of 15 hours per year. Credits can be earned through various professional development activities and are categorized as either Category I (pre-approved events) or Category II (non-pre-approved events). MCHES must also earn 30 hours related to advanced competencies. Certification may be maintained through continuing education or re-taking the
Este documento estabelece uma política distrital para a integração de pessoas com deficiência no Distrito Federal. A lei define deficiência e estabelece categorias de deficiência, princípios da política, direitos fundamentais como o direito à vida e à saúde, e obrigações do poder público para promover a inclusão e o bem-estar das pessoas com deficiência.
O documento descreve um projeto de conscientização ambiental realizado por alunos do Ensino Médio Inovador da Escola de Educação Básica São Miguel. Os alunos participaram de oficinas sobre reciclagem, produção de papel e sabão, e construção de um biodecompositor. O objetivo era ensinar os alunos a reduzir, reutilizar e reciclar resíduos, beneficiando o meio ambiente.
100 perguntas e respostas versao final ebookVivianecxf
A improbidade administrativa é caracterizada pela Lei n. 8.429/1992 como condutas inadequadas praticadas por agentes públicos no exercício de suas funções, que incluem enriquecimento ilícito, lesão ao erário e violação dos princípios da administração pública. Embora a lei seja a principal fonte sobre o tema, a noção de improbidade extrapola o texto legal e está ligada ao dever de probidade no serviço público. Não há um conceito único da improbidade, mas deve-se considerar o padrão ético esperado
The document discusses the development of railroads, standardized time zones, and prominent inventors and innovations in the railroad industry like George Pullman's sleeping cars and George Westinghouse's air brake. It also covers the consolidation of railroad companies, challenges faced by farmers, and the rise of steel and industrialists like Andrew Carnegie.
El documento proporciona instrucciones para elaborar documentos académicos como resúmenes, informes y ensayos. Explica los pasos para seleccionar un tema, recopilar información relevante, formular objetivos y crear un borrador. Además, describe las características y tipos de resúmenes, informes y ensayos, así como cómo elaborarlos de manera efectiva.
Capacitacion es estrategias y tecnicas[1]melbacorral
Este documento describe las diferencias entre estrategias, técnicas y actividades didácticas. Explica que las estrategias son planes de enseñanza general que usan varias técnicas para lograr objetivos, mientras que las técnicas son procedimientos específicos que se enfocan en una parte del aprendizaje. Las actividades son acciones específicas dentro de las técnicas. También proporciona ejemplos de cada uno y destaca que a veces la distinción depende de la intención del curso.
O documento discute a história, origem e processo de obtenção do petróleo. Aborda os principais métodos de perfuração de poços de petróleo e a composição química do petróleo cru. Também descreve as etapas de refino do petróleo cru, incluindo destilação, cracking e outros processos para obter derivados como gasolina e óleos lubrificantes.
Este projeto de lei cria as carreiras de Agente Comunitário de Saúde e Agente de Combate às Endemias no município de Picuí-PB de acordo com a Constituição Federal e a Medida Provisória 297/2006. Ele define as atribuições e requisitos para estas posições e estabelece diretrizes para contratação, progressão e financiamento.
Este documento presenta lineamientos para el tratamiento de la diarrea en el primer y segundo nivel de atención en Costa Rica. Incluye recomendaciones sobre la evaluación del paciente, medidas terapéuticas como la rehidratación oral y consideraciones para el manejo de disentería, diarrea persistente y diarrea asociada a otras enfermedades. El objetivo es mejorar la efectividad del tratamiento y apoyar los estándares de calidad basándose en la mejor evidencia científica disponible.
1. Type 2 diabetes is a common chronic disease characterized by progressively rising blood glucose levels and worsening insulin resistance, which are major causes of morbidity and mortality. It is estimated that over 16 million people suffering from diabetes live in the Eastern Mediterranean Region alone.
2. The document discusses the different types of diabetes, including type 1, type 2, and gestational diabetes. It provides details on the causes and complications of diabetes, noting that uncontrolled diabetes can cause numerous serious complications affecting many organs and tissues over time.
3. The goal of diabetes treatment is to control blood sugar levels, but the methods vary depending on the type of diabetes. Current therapies have problems with compliance, effectiveness, and side effects, highlighting the need
The Peter G. Peterson's State of the Union's Finances: A Citizen's Guide provides a comprehensive look at America's finances. The guide is broken out in the three sections 1.) Executive Summary 2.) Our Growing Fiscal Challenge 3.) Solutions
This document discusses how the US federal budget deficit and national debt affect different individuals and institutions. It states that taxpayers, future Social Security and Medicaid recipients, unemployed individuals, and University of Phoenix students are all impacted by fiscal policy. The effects on these groups in terms of things like income-based student loan repayment options and changes to federal grant programs are briefly outlined. The document also mentions exploring impacts on the US's international financial reputation, exports and imports, and GDP.
Running hHead UNITED STATES NATIONAL DEBT1UNITED STATES N.docxrtodd599
Running hHead: UNITED STATES NATIONAL DEBT
1
UNITED STATES NATIONAL DEBT 4
UNITED STATES NATIONAL DEBT Comment by Writing Center: Not in all caps
Akhil Gadiparthi
BUS 505 Managerial Economics
Jun 30, 2019
Simin Hojat
Westcliff University
United States National Debt Comment by Writing Center: Great, just not bolded
Latest reports indicate that the United States nNational dDebt has now hit $22 tTrillion. This being is the highest point it has ever reached in the country’s history. Over the years, we have witnessed a drastic drop in tax revenue and a significant rise in federal spending. From the time President Trump assumed office in 2017, the nNational dDebt has increased by approximately $2 trillion in two years (Hallender, 2019). Despite the country being the most powerful country in the world, annual budget deficits keep on increasing, leaving the national dDebt to soaring. up. Comment by Writing Center: Where did you find this fact? Cite
(Author’s Last Name, year) Comment by Writing Center: Thesis statement? Remember: https://edpuzzle.com/media/5abe932cff173e40f02ef96d
History of the United States National Debt
The American Revolutionary War saw the first instance when the United Statescountry incurred national dDebt. This was undertaken by the first United States tTreasurer, Michael Hillegas. From this time, the Public Debt has been escalating significantly, although it did but decreased between 1835 and 1836. It is was during the periods of recessions and wars, that the country has seen high national debts. It has, therefore, been measured against the country’s GDP. Under these measurements, the National Debt had reached its highest during Truman’s pPresidential term, which was subsequently after World Wwar II 11 (Hall & Sargent, 2015). When Jimmy Carter and Bill Clinton came into power, there was seen a significantly low level of Public Debt. Comment by Writing Center: What is this? Specify Comment by Writing Center: Not capitalized Comment by Writing Center: Specify what ‘it’ refers to Comment by Writing Center: Not capitalized Comment by Writing Center: Not capitalized
Decreased military expenditure in the subsequent years made the dDebt to drop significantly (Hall & Sargent, 2015). Over those years, the public debt graph has been erratic with instances of high and low states. In the 1980s, there was an increase ind military spending, especially during the reign of President Reagan. Under President’s George W. Bush reign, the national debt went up by $5.9 trillion, which was the second largest. The 9/11 terrorist attacks dramatically reshaped the U.S. economy. Military spending surged to $600 billion/year, and thus, the wWar on terror attributed greatly to this the rise in national debt (Hall & Sargent, 2015). Further, Tax Relief and .
The document provides an update from Agcapita on various economic issues in April 2010. It discusses the large fiscal deficits governments have incurred to deal with the financial crisis and how this has made governments insolvent. It argues that to finance deficits, governments will likely resort to inflation. It also notes Americans are underestimating how much they need saved for retirement and that demographic trends may make it difficult for governments to fund programs like social security and Medicare. Overall the update discusses rising government debt levels, the risk of higher inflation, and challenges with funding entitlement programs.
Essay On United States National DeficitAshley Fisher
Based on the information provided, here are the key factors that indicate Morocco has a healthier economy than Libya:
- Population size: Morocco has a much larger population of 34 million compared to Libya's 6.2 million, giving it a larger domestic market and workforce.
- GDP: Morocco has a GDP of $118 billion compared to Libya's GDP of $70 billion, indicating its economy produces more goods and services.
- Economic diversity: Morocco has a more diverse economy focused on agriculture, phosphate mining, tourism, and manufacturing. Libya is heavily dependent on oil production.
- Political stability: Morocco has had greater long-term political stability compared to Libya, which experienced conflict and regime change in recent
The US national debt originated from government spending exceeding revenue in a given year. This includes response to economic crises like the 2008 financial crisis and wars in Iraq and Afghanistan, which increased debt levels. Mandatory spending like social security makes up over half the budget and is difficult to cut. Without tax increases or strong economic growth, it will be challenging to reduce the deficit and debt. China is currently the largest foreign creditor to the US, holding around $1 trillion of US debt.
The document discusses the US federal budget deficit and national debt. It notes that the US debt has reached over $15 trillion and the debt-to-GDP ratio is over 60%. It explains the differences between the deficit, debt, outlays, and budget surplus/deficit. Rising mandatory spending on programs like Social Security and Medicare, as well as increased spending after 9/11, have contributed to growing deficits. The large deficit and debt levels can negatively impact the economy and future generations.
The document discusses the differences between the national debt and the federal deficit of the United States. The federal deficit refers to the amount of money the government spends beyond what it collects in revenue each year. The national debt is the total accumulation of all past deficits minus any surpluses. Interest payments on the national debt contribute to the annual deficit. While deficits are not always negative, sustained large deficits pose risks if the money is not spent on investments that improve economic growth over the long term.
After the US dollar replaced gold, the US debt became the attention worldwide, thus the demand for the US dollar continued, furthermore the extremely low interest of the dollar. This helped the US government to borrow great amounts of debt as well as kept the creditors pleased. Due to the pandemic, the US economy retrograded because of the tax cut and unproductive rescue spending plan plus surpassing spending of the government. The rising inflation starts to increase to high levels, which certainly the government must cut back spending or its patterns, while this will lead to uncertain consequences for the long future. This paper discusses several different perspectives on the US government's sustainability as its ability to settle the debt in future, the fate of growth burdened with that debt through the neoclassical mode of growth, and also the effect of anxiety of defaults and unfunded obligations. Inversely, it explores the strength of the dollar with a low-interest rate and its sustainability worldwide. We also propose ways helping of strengthen the fiscal government position and solutions to help the economy recover in long term and to easiest the situation. In the synopsis, we propose something that could affect and shake the global market.
Most states are facing significant budget shortfalls due to declining tax revenues during the recession. The crisis has led to widespread budget cuts, layoffs, and proposals for new taxes or reliance on federal stimulus funds. Massachusetts faces a projected $5.4 billion budget deficit for fiscal year 2010 due to a $3.4 billion loss in tax revenues over the previous year. Addressing the large deficit will require difficult choices about funding priorities and revenue sources.
Saving the American Dream: The Heritage Plan to Fix the Debt, Cut Spending, a...The Heritage Foundation
In this landmark report, The Heritage Foundation presents a comprehensive plan to grow the economy and balance the budget. Saving the American Dream boldly reforms Medicare, Social Security, Medicaid, taxes, health insurance, and government spending. Dive deep into these policy ideas with seven full-color charts and six in-depth tables. Originally published May 2011.
This document provides an overview of indexing and various applications that can be used with FamilySearch. It discusses the indexing process and how to get started indexing records. It then reviews several applications including BillionGraves, Record Seek, TreeSeek, Relative Finder, Puzzilla, RootsMapper, and Find A Grave that connect with FamilySearch. It also discusses the Family Tree application and some games like Little Family Tree, Geneopardy, and Two Sisters that can engage kids with family history.
This document provides instructions for adding various types of media to memories in a genealogy software or website. It describes how to add photos, documents, stories, audio files and how to tag people in photos. It also provides directions for organizing memories into albums and navigating between different views of a person's memories.
This document provides an overview of how to use FamilySearch.org to research family history and find records, including searching for records, modifying search criteria, finding children through parent searches, searching within specific collections, getting help through FamilySearch's support resources, and properly attaching internet sources to a family tree. It outlines different search and browsing functions on FamilySearch and gives tips for expanding searches to find more records.
This document provides instructions for editing information, relationships, and merging duplicate records in FamilySearch. It discusses adding or editing vital information and relationships, using record hints to find additional records, searching for records in FamilySearch, finding and merging duplicate records, and other ways to identify duplicates. The steps provided include selecting the correct information, adding sources and reasons, and reviewing all relationships and information to ensure accurate merging of duplicate records.
This document provides an overview of the key features and functionality of the FamilySearch family history website and tools. It explains how to set up a free FamilySearch account, access the Family Tree tool to build your family tree, view and navigate different layouts of the family tree, add individuals to your tree, view and edit person pages with details about an ancestor, attach sources and media like photos, and find research assistance features. The document is intended help new users understand the basic features and navigation of FamilySearch.
This document lists various genealogy research websites organized into categories. It includes general search engines like Google, websites for free genealogy forms, census records, land records, and several websites focused on immigration records and passenger lists that can help with tracing family history who immigrated to the United States or United Kingdom. The websites provided cover a wide range of genealogical source material to aid people in their family history research.
The document lists various occupations found in historical records, including: ship's supplier (acater), falconer (accipitrary), accountant (accomptant), midwife (accoucheur), military outfitter (accoutre/accoutrement maker), ploughman or ox herder (ackerman/acreman), tax assessor (affeeror), crossbowman (alblastere), innkeeper (albergatore), medieval chemist (alchemist), elected council member or noble officer (alderman), ale tester (ale conner), ale seller (ale-draper), ale barrel worker (ale-tunner), grocer (all spice), ale house land
This document provides an overview of various records related to businesses, employment, and occupations that can contain genealogical information about ancestors. These include apprenticeship, indenture, tax, school, church, town meeting, and census records as well as city directories, newspapers, and records specific to certain occupations like farming, law, medicine, coal mining, and railroads. The document discusses where to find these records and how they can provide clues about an ancestor's residence, family members, economic status, life events, and more.
The document provides a list of websites that are useful resources for tracking immigration ancestors who came to the United States. The websites contain information on indentured servants and convict servants who were sent to the colonies, as well as passenger arrival records, immigration statistics and summaries, and resources for researching immigration records from various countries and arrival ports. Michelle Christie compiled the list of websites to share good sources for ancestry research related to immigration to the United States.
This document outlines several key land records and resources for researching family history related to land: 1) Census records can provide information on where a family lived. 2) Deeds contain details about land transactions like names and prices. 3) The Homestead Act of 1862 gave settlers ownership of land after living on it for 5 years. 4) Wills often mention the distribution of a deceased person's land among heirs. 5) The Bureau of Land Management website provides access to records of land grants and warrants from the U.S. government.
The document discusses wills and probate records, including:
- Probate records provide proof of relationships between heirs listed in a will or determined by intestacy laws.
- The probate process usually begins 30-90 days after death and involves appointing an executor, conducting an inventory, notifying heirs, settling debts and obligations, and distributing the estate.
- Dower and curtesy rights gave surviving spouses rights to portions of the deceased spouse's real property.
- Guardianship records may provide information about minor children if their father died.
- Court minutes record all court cases and appointments and provide additional genealogical details.
- Not all estates were probated before 1900 but rural landowners
This document summarizes resources for genealogical research, including genealogical societies in the Houston area, libraries with genealogy collections, books on genealogy research techniques, and maps useful for historical research. It provides contact information for the Houston Genealogical Forum, Bear Creek Genealogical Society, Texas State Genealogical Society District 4, Afro-American Historical & Genealogical Society Houston Chapter, and Cypress Historical Society. Libraries mentioned include the Houston Public Library, Clayton Library Center for Genealogical Research, Texas State Library & Archives Commission, Fort Worth Library's genealogy collection, the National Archives, and the Library of Congress. Examples of relevant genealogy books and maps resources are also
The document discusses the probate court systems and records of several original 13 colonies - Connecticut, Delaware, Georgia, and Maryland. It notes that Connecticut established probate districts within counties, while neighboring Rhode Island handled probate matters at the town level. It provides details on the specific counties and time periods of surviving probate records in each colony. The document also discusses the types of early records that exist for each colony, including land grants and court proceedings.
This document provides a list of 19 links to online vital records for various US states, including birth, death, and marriage records. Some of the states covered include Arizona, Idaho, Illinois, Kansas, Maine, Maryland, Massachusetts, Michigan, Minnesota, Missouri, North Dakota, Ohio, South Carolina, South Dakota, Tennessee, Utah, West Virginia, Virginia, and resources for researching burned county records. The links give researchers access to searchable indexes and databases of historical vital records to aid in genealogy and family history research.
This document provides an overview of various types of vital records useful for genealogical research, including birth, death, marriage, and Social Security records in the United States. It discusses the sparseness of early records and increased detail over time. For marriage records specifically, it explains that jurisdiction and record types varied by state and time period, with banns, bonds, licenses, certificates, and registers all potentially containing relevant information.
This document provides instructions for building a cross out of clothespins. It details the supplies needed, which include 16 clothespins and glue. The instructions are broken into 4 phases: in phase 1 the clothespins are prepared by removing springs and gluing them together in pairs; phase 2 provides directions for starting to assemble the cross shape; phase 3 adds supporting pins to strengthen the structure; and phase 4 attaches pins to form the arms of the cross. Proper alignment and adequate drying time for the glue are emphasized throughout.
This document appears to be a census record from 1900 containing information about individuals in a household. It includes each person's name, relationship to the head of household, personal details like age, birthplace, occupation, and other demographic information. The document contains instructions for enumerators on how to fill out the form and the types of information being collected for each member of the household.
The document provides an overview of United States census records from 1790 through 1940. It details the information collected in each census, including names, ages, occupations, birthplaces, and more. It also summarizes special schedules and records including slave schedules, mortality schedules, agricultural schedules, and manufacturing schedules that supplemented the main census and provide additional genealogical insights. United States censuses have been taken every ten years as mandated by the Constitution and have become invaluable resources for family historians seeking details about their ancestors.
2. 25% 15%
Total federal, state, Federal receipts as a
and local government share of the economy
receipts as a share of (GDP)
the economy (GDP)
Debt held by the public as of April 15, 2010 Intragovernmental Debt (Debt government owes itself)
Outstanding federal debt
April 15, 2010
Social Security Health Programs Defense Net Interest
3. We must begin to take steps to address this major challenge
before we pass a tipping point and our foreign lenders lose
confidence in our ability to put our federal financial house
in order. Yes, we can take steps to create a better future if
“We the People” become informed and involved. However,
we must take steps to ensure that our elected representatives
make tough choices in connection with federal budget and
spending controls, social insurance reforms (in particular,
Social Security and Medicare), and tax reform, which will
generate more revenues. The sooner we act the better because
time is not working in our favor.
The fiscal year that ended on September 30, 2009 was not
We at the Peter G. Peterson Foundation are dedicated to
a good one for the United States government and for many
promoting more federal financial responsibility and account-
Americans. As you will find in this Citizens’ Guide, the U.S.
ability today in order to create more opportunity tomorrow.
Government experienced the largest deficit (in dollar terms)
This includes raising public awareness about key economic
in its history—$1.4 trillion. In addition, the federal govern-
challenges, and working to bring Americans together to find
ment was in a $61.9 trillion financial hole comprised of
sensible and sustainable solutions that transcend age, party
explicit liabilities and unfunded promises, principally Social
lines and ideological differences.
Security and Medicare, as of the end of fiscal year 2009. That
Please join our fight for America’s future by signing up at
is over $200,000 per American, up from about $70,000 per
www.pgpf.org. Working together, we will keep America strong
American at the end of fiscal year 2000.
and the American Dream alive for future generations.
Importantly, while the fiscal 2009 year deficit and the pro-
jected $1.3 trillion-plus deficit for fiscal year 2010 are matters of
public concern, they are largely due the effect of the recession Sincerely,
and a weak economy, two undeclared and unfinanced wars,
the stimulus bill, and several federal assistance and bailout ef-
forts. All of these factors are temporary and will pass over time.
Therefore, the real threat to our collective future is the longer-
term structural deficits, escalating debt levels and burgeoning Peter G. Peterson David M. Walker
C H A I R M A N O F T H E B OA R D PRESIDENT AND CEO
interest payments that we are projected to experience after the
economy recovers, after unemployment levels decline, after
the wars are over, and once we are past the recent crises.
4. Last year, at $1.4 trillion or 9.9 percent of gross domestic product
(GDP), the US deficit was the largest since the end of World War II. By
the end of this year the estimated deficit will again reach $1.4 trillion.
Our current national debt is $12.9 trillion, or nearly 90 percent of GDP.
Of this debt, the amount held by the public (i.e., by individuals, corpo-
rations, state or local governments, and foreign entities) is over $8 tril-
lion, or 57 percent of GDP. Even adjusting for inflation, both of these
numbers are more than double their size from just 10 years ago.
1.
5. The deficits for fiscal years 2009 and 2010 are largely attributable to
FIGURE 1.
significant declines in revenue due to a recession and weak economy,
the cost of the wars in Iraq and Afghanistan, and various government
bailouts and stimulus actions. These items do not represent long-term
and recurring fiscal challenges. However, even after the economy recov-
ers, the special federal interventions are complete, the wars are over, 1200%
and unemployment levels are down, deficits and debt are expected to
grow at a rapid rate. As a result, the U.S. will find itself in an unsus-
tainable fiscal position in the years to come. If current policies are left 1000
unchanged, debt held by the public is projected to spike even further, ACTUAL PROJECTED
reaching over 300 percent of GDP in 2040 (see Figure 1).
National attention is now focused on what it will take to recover from a TARP & 2040 800
RECESSION 303%
severe recession that has affected the livelihoods of millions of Americans. 53%
In March 2010, 9.7 percent of the U.S. population was jobless, compa- WWII
600
rable to unemployment levels of the early 1980s. Many additional workers 113%
were under-employed. Policymakers are likely to provide funding in 2010
GREAT
DEPRESSION
400
44%
CIVIL
WAR WWI 200
31% 30%
0
1800 1840 1880 1920 1960 2000 2040 2080
SOURCES:
that is intended to support job creation and economic growth. Although boomers will reach full retirement age for Social Security and Medicare.
the additional spending will increase the near-term deficit, it will help to Meanwhile, healthcare costs continue to grow at an unprecedented rate.
boost economic activity. In the medium-term, however, our nation still In ten years, healthcare costs are anticipated to reach roughly $12,000
has to grapple with the policies contributing to our growing red ink. per person (an increase of over 50 percent from this year’s estimate).
An aging population and rising healthcare costs exacerbate our fis- Why should we be concerned? Delaying action will make it that much
cal dilemma. Within the next year, the oldest of the 78 million baby more difficult to reverse our fiscal course. As the debt grows, interest on
6. the debt will skyrocket. In fact, in just a dozen years based on our pres- rity, Medicare and Medicaid. This means the government will need to
ent path, our interest expenses will quadruple, becoming the largest borrow to pay for other essential programs such as education, transpor-
single line item in the federal budget —larger than defense, Medicare tation, national defense and homeland security.
or Social Security. Today the U.S. government spends 1 percent of the To help address our fiscal challenges, the President established the
total economy on interest on the debt. By 2040, assuming that the U.S. National Commission on Fiscal Responsibility and Reform on February
does not have to pay a risk premium, federal interest costs will account 18, 2010. This bipartisan commission is charged with the task of provid-
for 14 percent of the entire U.S. economy. ing recommendations on how to balance the budget by 2015 (excluding
interest costs on the federal debt) and examining long-term solutions
for our growing entitlement programs. The commission, chaired by
former Clinton Chief of Staff Erskine Bowles and former Republican
Senate Whip Alan Simpson, will issue its recommendations by Decem-
ber 1, 2010. While the outcome from this commission remains to be
seen, the undeniable truth is that the time for meaningful action to
defuse our fiscal time bomb has come.
Current interest rates are low compared to historical levels. If inter-
est rates rise just two percentage points, interest costs alone could rep-
resent about 20 percent of the economy by 2040. Failure to address
the long-term problem will lead to compounding interest costs, which,
absent dramatic reforms, will account for an overwhelming portion of
the budget in the future.
Borrowing at the levels projected under our current policy path
would call into question our ability to manage our nation’s fiscal affairs,
and result in sharply higher interest rates. That, in turn, would be like-
ly to cause even more severe economic challenges, including further
downward pressure on the dollar; higher prices for oil, food and other
goods; and greater levels of unemployment. Hard as it is to imagine,
our nation is on course towards an even worse economic crisis than
during the past few years.
What needs to be done? Our elected officials must wake up and,
once the economy recovers, take steps to close the gap between spend-
ing and revenue. By 2024, historical revenue levels of about 18 percent
of GDP will not even cover projected costs of net interest, Social Secu-
7. They also determine how to finance those decisions, whether through
collecting taxes from individuals and businesses, assessing various pre-
miums or fees, or borrowing from domestic and international lenders.
Up until the Great Depression in the 1930s, the U.S. experienced
more budget surpluses than deficits. Since World War II, we have bal-
anced the federal budget only a dozen times, with only four of those,
fiscal years 1998-2001, occurring in the past 40 years (see Figure 2). Of
the four years when we had surpluses, only in fiscal year 2000 did the
federal government have an operating surplus (which excludes consid-
2.
8. annual shortfalls are the structural deficits, which, if left unchecked, will
FIGURE 2.
threaten the state of our nation.
What do all of these numbers ultimately mean for us as citizens? If we
continue down this path, rising deficit and debt levels will impact our
everyday lives by threatening our nation’s economic strength (lower in-
vestment and growth), our international status (weaker standing in the
ACTUAL PROJECTED world and international capital markets), our standard of living (higher
interest rates for loans and mortgages, higher unemployment rates,
lower wages), and possibly our national security (higher dependency
2009
9.9%
FIGURE 3.
SURPLUS
SOURCES:
eration of the Social Security surplus). In the past 40 years, deficits as a
percentage of the economy have averaged slightly over 3 percent.
In fiscal year 2009, we experienced a record deficit of nearly 10 percent
of GDP. That shortfall was a result of a lower level of revenue (15 percent
of GDP) largely due to the recession, and higher spending (25 percent
of GDP) primarily reflecting the Troubled Asset Relief Program (TARP),
Fannie Mae and Freddie Mac support, increased unemployment ben-
efits and other stimulus and bailout actions by the federal government.
What’s even more troubling is that under current law the gap between
revenue and spending widens steadily over the next 30 years and be- SOURCES:
yond, continuing well after full economic recovery (see Figure 3). These
9. on foreign governments that purchase U.S. debt). Moreover, higher debt Since 1970, the decline in defense spending as a portion of the total
levels mean more resources devoted to compounding interest payments budget has been offset by the growth in the major entitlement programs
on the debt, which increasingly go abroad rather than stay in this coun- (Social Security, Medicare and Medicaid). Spending as a percentage of
try. Thus, we have fewer resources available for domestic investment in GDP has grown from its historical average of 20 percent of GDP over
research and development, education, infrastructure and other crucial
investments that maintain our economic competitiveness.
Changing Composition of Spending
Federal spending can be divided into five major categories: net interest
(interest costs on the federal debt), Social Security, Medicare and Med-
icaid, national defense, and all other programs, which includes areas
like education, income security, transportation, agriculture, housing
space and science, natural resources, and health programs like the
National Institute of Health and Center for Disease Control and Pre-
vention (see Figure 4).
the last 50 years to roughly 24 percent of GDP in 2010, and is anticipat-
FIGURE 4.
ed to reach 40 percent of GDP in 2040 under current policies. The three
major entitlement programs (Medicare, Medicaid and Social Security)
are the primary drivers of that long-term growth. Of these, Medicare
and Medicaid represent the greatest challenge.
Economic Recovery
As the United States continues to recover from one of the most severe
economic downturns in recent history, we will continue to see addition-
al spending in the near term for job creation and economic recovery.
The recent recession—which lasted from late 2007 through mid-2009—
disrupted the housing and financial markets, left millions of Ameri-
cans unemployed, and created a greater need for income assistance
programs. Last year, revenue levels dropped to their lowest point in
recent history, falling to under 15 percent of GDP (well below the his-
torical average of about 18 percent of GDP).
SOURCES: The Congressional Budget Office (CBO) estimates that the American
Recovery and Reinvestment Act of 2009 (ARRA), the economic stimu-
10. lus package, has increased federal spending by $158 billion and lowered
FIGURE 5.
revenues by $114 billion through December 2009. The higher spending
levels were primarily for government purchases of goods and services,
aid to state and local governments, and income transfer payments to
individuals. The revenue reduction primarily reflected tax cuts for low-
er and middle-income people, extension of first-time homebuyer credit,
and changes to corporate taxes. CBO estimates that the stimulus pack-
age added between 1 million and 2.1 million jobs and increased the
GDP by 1.5 percent to 3.5 percent in October through December 2009.
HEALTH CARE IS THE MAJOR PLAYER AT THE HEART OF OUR FISCAL
crisis. Medicare, which retirees rely on for their health insurance, and
Medicaid, which provides health care for low-income individuals, ac-
count for most of the projected long-term growth in spending. Together,
they account for 5 percent of today’s GDP (20 percent of spending);
within 30 years they are projected to cost 11 percent of GDP (25 percent
of spending). By 2080, according to projections, the two programs alone
will represent 18 percent of GDP, equal to the historical average level of
federal revenues (see Figure 5). Consequently, any long-term plan to sta-
SOURCES:
bilize the national debt as a percentage of the overall economy will de-
pend on successfully controlling the costs of federal health programs.
There are two core reasons why the cost of Medicare is growing so
fast: as baby boomers retire and people live longer after the age of 65, per capita. Yet, our health outcomes are no better, and by some mea-
the number of retirees is increasing; and overall health care costs in the sures are even worse. For example, the US ranks poorly among Organi-
U.S. are rising rapidly. It is the growth in health care costs that repre- sation for Economic Co-operation and Development (OECD) countries
sents the major threat to our standard of living. in terms of obesity and infant mortality. U.S. health care costs are pro-
Currently, Americans spend on average $8,000 per year on health jected to grow even further in the near future, eating up a larger and
care—far more than any other developed nation. Comparable high- larger share of our economy. In 1980, health care spending made up 8
income countries such as England, Germany, Japan, and Canada spend percent of our economy. By 2000 it grew to nearly 14 percent, and by
between one-half and two-thirds of what the U.S. spends on health care 2020 it is anticipated to exceed 20 percent. From 2020 on, health care
11. Most experts agree that the way that health care is paid for in the
FIGURE 6.
U.S. drives up costs. Doctors in the United States are paid on a fee-
for-service basis, meaning that they have an incentive to order more pro-
cedures and schedule more appointments. They are paid more if they
deliver a lot of treatments (especially more expensive procedures such as
34 CAT scans and MRIs), a system that may not result in making patients
35%
ACTUAL PROJECTED healthier. Moreover, most American consumers are not aware of how
30 29 much they spend on health care. Insurance pays for most health care
costs, and employers pay for most insurance. Economic research (Gru-
25 22 ber and Krueger, 1991) shows that employers give smaller raises because
of health care costs. As a result, the process of paying for health care is
20 17
so indirect and opaque that most people have little reason to consider
15 13 whether or not they are getting good value for their health care dollar.
12
Reforming health care to be more cost effective requires changing
10 8
7 the economics of medicine. It means replacing the current fee-for-ser-
5
5
vice system with a system that rewards doctors for keeping patients
healthy and avoiding unnecessary or inappropriate procedures. It also
0
1960 1970 1980 1990 2000 2010 2020 2030 2040
SOURCES:
costs are projected to skyrocket, absent systemic reform (see Figure 6).
Studies by economist Uwe Reinhardt, the McKinsey Global Institute
and the International Federation of Health Plans suggest that a major
reason why U.S. health care is so much more expensive than the rest of
the world is that the price of our medical services is higher. A medical
appointment, prescription drug, surgery or test will, in general, cost means giving consumers an incentive to keep doctors and other pro-
more in the U.S. than in Europe. But prices are not the only driver viders accountable for quality and cost. Those changes will involve dif-
of national costs. Americans also receive a lot of unnecessary medical ficult choices for society. Health is precious and most consumers do not
care. Studies by the Dartmouth Atlas Project have shown that some want to spare any expense that might potentially improve their health.
regions of the country, such as Florida, New Jersey, and Texas, consume Nevertheless, choices have to be made because costs are growing faster
many more expensive medical services than the rest of the country— than the government or our people can afford and sustain.
and are no healthier for it. In March 2010, Congress passed and President Obama signed into
12. law sweeping health care reform. CBO estimates that by 2019 the new
F I G U R E 7.
law will provide federally-subsidized health insurance for about 32 mil-
lion Americans who would otherwise be uninsured. The historic law
takes steps in the direction of more cost-effective care by promoting
experiments with new payment systems, comparative effectiveness re-
search, and electronic health records.
Under the new law, the expansion of health insurance coverage is
mostly paid for by slowing the growth of Medicare payments to hospitals
and other providers, and increasing Medicare payroll taxes. For reduced
Medicare payment rates to be sustainable the overall health care system
will have to become more efficient and keep down unnecessary costs. Oth-
erwise Medicare payments will not be in line with the costs of the overall
health care system. That in turn could limit Medicare beneficiaries’ access
to providers, or contribute to cost-shifting to private payers. Either result
could eventually force an upward revision in payment rates.
The projected payment rate cuts and new payroll tax income would
significantly reduce unfunded Medicare promises over the next 75 years,
but those resources will be needed to pay for the new health insurance
subsidies. Consequently, much work remains to stabilize health care SOURCES:
costs as a percentage of the federal budget and the overall economy and
keep total federal spending for health care from growing faster than
our willingness to pay. Over the past 25 years, Social Security has consistently brought in
more tax revenue than it has paid out in benefits, creating a positive
balance in the trust fund. If it had not been for the Social Security cash
surpluses, our past deficits would have been even larger. By 2016 Social
Security will start adding to the federal deficit instead of reducing it (see
Figure 7). More recent projections show the recession causing a tempo-
SOCIAL SECURITY IS THE MA JOR SOURCE OF INCOME FOR MOST rary cash deficit in the near term. As more baby boomers retire, benefit
retirees in America, and most workers pay more in Social Security payroll payments will increasingly outgrow Social Security tax revenue. That
taxes than in income taxes. Payroll taxes are credited to the combined wave of baby boomer retirements is not a demographic blip: the U.S.
Social Security trust fund, which, like the Medicare trust fund, is an ac- population will continue to include a larger proportion of older people
counting mechanism that tracks dedicated payroll tax income and benefit than it has up to now. Given current policy, the Social Security trust
payments. While the trust funds carry distinct legal, political and moral fund will be depleted and, absent policy changes, the program will lack
significance, they do not have immediate budgetary or economic impact. sufficient resources to pay all of its scheduled benefits as early as 2037.
13. The root cause of Social Security’s shortfalls is the same growth in re- budget. Since the end of World War II, we have gradually reduced de-
tirees that is affecting Medicare’s finances. Longer life spans mean more fense spending from over half of the budget to about one-sixth of the
years of collecting Social Security benefits and thus more financial de- budget by the year 2000. However, the invasions of Afghanistan and
Iraq have caused defense spending to increase as a share of the budget,
and it now stands at about one-fifth of all federal spending.
The discretionary budget also includes many vital non-defense pro-
grams. Such spending pays the salaries of most government employ-
ees and allows the government to operate. Homeland security, foreign
relations, education, research and development, disaster assistance,
highways, air traffic control, the Congress, the Supreme Court, and the
operations of the White House are all examples of discretionary spend-
ing. About 19 percent of the 2010 budget consists of nondefense discre-
tionary spending.
mands on the system. At the same time, people have been having fewer
children than they did when Social Security was created, slowing growth
in the number of younger workers paying Social Security taxes. In 1950,
there were 16 workers paying taxes to support each retiree. Now there NOTHING IS FREE, AND OUR GOVERNMENT COSTS AMERICANS MONEY.
are 3.3, and by 2040 there will be only 2. Unless Social Security taxes Most Americans pay taxes on their income, money that is used to support
increase, or benefit payments decrease, Social Security will require spe- the federal government. Historically, around 18 percent of national in-
cial appropriations from Congress to fulfill current benefit promises. come is paid to the federal government in the form of taxes. That money
is then used to fund government’s operations and spending programs.
The majority of the government’s revenue comes from three types of
taxes: individual income taxes, payroll taxes, and corporate income taxes.
Income taxes are progressive, meaning higher income individuals face
higher tax rates. However, payroll taxes are regressive because they only
ALTHOUGH MEDICARE, MEDICAID, AND SOCIAL SECURITY ARE MAN- apply to the first $106,800 of wage income (in 2010), and any earnings
datory spending programs that do not depend on annual congressional beyond that are not subject to payroll taxes. The more an individual earns
action to pay benefits, over one-third of the budget consists of discre- above the limit (which is indexed to inflation), the smaller his or her pay-
tionary programs that have to be funded through annual appropria- roll taxes are as a portion of income. Corporate income taxes reduce earn-
tions legislation. ings for the shareholders of corporations, who generally have larger in-
The largest category of discretionary spending is defense. In fact, for comes. Corporate income taxes also result in higher prices to consumers.
many years national defense was by far the largest portion of the federal The highest-earning 1 percent of Americans pay for about 24 percent
14. of the government’s tax revenue, and the top 20 percent pay about 71 insurance don’t get the similar tax benefits.
percent of total federal taxes (see Figure 8). In 2010, an estimated 45 All of these special exemptions and tax breaks are similar to direct
percent of taxpayers will pay no income taxes or will receive a refund- government spending in that they also have a cost (in the form of re-
able (cash) tax credit, but only 13 percent will have to pay no income tax duced revenues) that affects the government’s “bottom line.” The Trea-
(or receive a credit) and no payroll tax. sury reported that tax exemptions and deductions for health care cost
alone added over $250 billion per year (or nearly half of the cost of the
Department of Defense). Tax policy experts estimate that if we elimi-
FIGURE 8.
nated all of the special deductions and credits we could raise 44 percent
more revenue than we do now without actually raising tax rates.
Most Americans do not want higher taxes. But since the Federal
government does not have enough revenues to pay for the commit-
ments it has made, tax revenues will have to go up unless programs
TOP 1% TOP 1%
100%
are cut. The money for government programs will have to come from
18% 24%
highest somewhere: higher income tax rates, fewer special exemptions, or
quintile
perhaps a new tax altogether such as a consumption tax.
80 fourth
quintile
third
60
61% quintile
71% second
quintile
40 lowest
quintile
20% “The debt of the United States…
20 18% was the price of liberty.”
3% 11% 3%
6% 8% ALEXANDER HAMILTON
0 1790, First Report On The Public Credit
SHARE OF SHARE OF
PRE-TAX INCOME FEDERAL TAXES
THE DEBT IS THE CUMULATIVE TOTAL OF ALL OF OUR PREVIOUS
SOURCES:
deficits and surpluses and other federal financial transactions. Since
the founding of our country, when the Revolutionary leaders needed
The U.S. tax code is riddled with special exemptions, deductions, and to borrow to fight the war against the British for independence, the
credits that affect people’s tax liabilities. For example, homeowners can United States has dealt with the process of borrowing, repaying, and
deduct the interest cost on their primary mortgages from their taxable recording debt. Our debt has never, however, reached the levels that are
income, and the value of health insurance provided by an employer is currently projected for the near future, absent major policy changes.
exempt from taxation. Renters and people who buy their own health The federal debt—which is displayed in a “national debt clock”—is
15. comprised of two parts: intragovernmental debt—Treasury securities
FIGURE 9.
held by federal trust funds (e.g., Social Security and Medicare) and
other government accounts—and debt held by the public, which are
marketable securities issued by the Treasury and sold to both domes-
tic and foreign investors. Because Americans have low savings rates,
the federal government has become increasingly dependent on foreign
lenders to finance the nation’s deficits and debt. As of April 2010, for-
eign investors hold 47 percent of public debt.
In February 2010, Congress voted to raise the debt ceiling, or the
upper limit of our national debt, to $14.3 trillion. The debt ceiling is
now $2 trillion higher than it was just a year ago. The total debt more
than doubled in the past decade from $5.6 trillion to $12.9 trillion as
SOURCES:
of April 2010. Debt held by the public has also more than doubled in
the last decade, rising from about $3.4 trillion in 2000 to about $8.3
trillion as of April 2010.
With deficits projected to reach over $1 trillion through 2011, and to unsustainable, and could lead to lower standards of living, lower do-
remain above $700 billion for the next ten years, the national debt level mestic investment, and higher interest and inflation rates over time.
is expected to grow dramatically. Interest rates are currently at an historic low—three-month rates are
Debt levels, at the highest they have been since World War II, could close to zero, while they hovered around 8 percent as recently as 1990.
lead to substantial interest payments in the future, if they persist. By The interest cost on our debt would increase dramatically if rates rise
2012, projected spending on interest will exceed spending on Medicaid. in the future.
By 2018, interest spending will exceed Medicare spending. By 2046, The Maastricht criteria, which must be met by European Monetary
interest spending will exceed total federal revenues (see Figure 9). Union states looking to adopt the Euro as their currency, is an interna-
The implications of these high debt levels, however, extend beyond tionally recognized standard for fiscal policy. The criteria limits infla-
just higher interest payments and lower levels of investor confidence. tion and interest rates based on international averages, and caps deficit
The United States may be an unlikely candidate for defaulting on and public debt levels at 3 percent and 60 percent of a country’s GDP,
its debt, but debt at the level projected in coming decades would be respectively.
16. Countries with higher debt-to-GDP levels often also face both eco-
FIGURE 10.
nomic and political crises. Greece, a country whose debt-to-GDP ratio
exceeded 110 percent in April 2010, is facing correspondingly lower bond
ratings, concern over political credibility, and international pressure to
make swift and drastic policy changes. Ireland and Spain, whose deficits
were more a result of loss in tax revenue related to the recession than to
poor fiscal policies, are seeing the implications in high unemployment
rates and major decreases in international investor confidence.
THE TERM “FISCAL EXPOSURES” IS A MEASURE (IN PRESENT VALUE)
of federal liabilities, commitments, contingencies, and unfunded promis-
es, which, under current law, will cost the government at a future date.
Referring to Figure 10, the federal government was in a $61.9 trillion-
plus hole as of September 30, 2009 (an increase of $5.5 trillion from the
previous year).
Right now, each American’s share of the $61.9 trillion in fiscal ex-
posures is over $200,000. Every year in which there are no down pay-
ments or reforms made to these liabilities and promises, the total grows
by $2 to 3 trillion—or $6,500 to $10,000 per person—on autopilot.
Some exposures are explicit and known liabilities that the federal
government is legally obligated to fulfill. Commitments and contingen-
cies represent contractual requirements that the federal government is
expected to fulfill when or if specified conditions are met.
The largest category of exposures, however, contains the growing un-
funded promises for Social Security and Medicare benefits for current
and future beneficiaries. Although people rely on the promise of those NOTE:
benefits, the Congress and the President can—and at times do—change
the programs in ways that increase or decrease the value of expected
benefits, and thus alter the size of the implicit exposure. For example,
SOURCES:
in the past, policymakers have increased payroll tax contributions,
17. increased the retirement eligibility age, changed cost-of-living adjust- of the federal government. Some of those costs reflect federal liabil-
ments, and increased beneficiary premiums applicable to such pro- ities and legal obligations. Others are obligations for benefits that
will be paid in the future, including Social Security and Medicare.
sound budgetary objectives and desired outcomes. Statutory tools
that contributed to budget surpluses in the late 1990s have sinced
expired (see Box 1).
BOX 1.
grams. In addition, the U.S. Supreme Court has ruled that the benefits
under those programs can be changed at any time through legislation.
Under PAYGO,
THE FEDERAL BUDGET IS INTENDED TO PROVIDE A GUIDELINE TO
annual fiscal policymaking. It does, however, have major weaknesses
when it comes to both understanding and managing the finances of the
Caps on discretionary spending
United States government.
than on the long-term impacts of fiscal choices. Decision makers do
not devote the same level of scrutiny to future outcomes as they do
to current costs. As a result, the longer-range impact on the nation’s
structural budget has been neglected.
in the political process. As a result, those individuals that will carry
most of the future burden of current fiscal irresponsibility are not
represented in the decision-making.
costs that are likely to result from various activities and tax policies
18. Some policymakers may want to try to solve the problem with only spend-
ing cuts, while others may want to keep spending the same and only
raise taxes. Both approaches are unrealistic and the respective groups
will have to make concessions if we are going to solve the problem. Fig-
ure 11 displays a list of illustrative policy options that would help lower
the rising long-term debt levels. Many other solutions are possible.
Right now, our political institutions are generally ineffective at ad-
dressing our long-term fiscal challenges. Politicians fear the wrath of
an electorate that dislikes tax increases and spending cuts. It is much
easier to expand government programs and provide tax cuts, reap the
3.
19. short-term political benefits, and then let future politicians—and citi- FIGURE 11.
zens—deal with the consequences.
Congress has shown that it is able to control spending when it has
to by using tools like pay-as-you-go and discretionary caps. But these
mechanisms only prevent the problem from getting worse; they will not
prevent the projected rise in debt that will happen if elected officials do
not change major policies. Many politicians will agree in private that
they need to do something about escalating deficits and debt levels, but
believe that building a political coalition around a fiscal responsibility
and sustainability package is too difficult. Many doubt whether normal
congressional procedure can ever produce a meaningful solution.
The bipartisan fiscal commission that President Obama recently
created may help break the logjam on sustainable fiscal policies. That
executive commission is charged with achieving a balanced budget ex-
cluding interest costs on the debt in 2015 and identifying policies that
would improve the long-run fiscal outlook. This goal should be supple-
mented by additional goals to stabilize the debt-to-GDP ratio at a rea-
sonable level, and to achieve a significant reduction in the tens of tril-
lions in unfunded promises that the federal government already has.
The Commission will be required to produce a proposal that has sup-
port from at least 75 percent of its members, which means that both
parties will have to support it. Unfortunately, because neither the Con-
gress nor the President is under any obligation to adopt the Commis-
20. be achieved through program reforms and budgetary constraints will
ultimately have to come from higher taxes. The key is to act sooner rath-
er than later, because if we allow the debt to creep up too high, interest
costs will make our fiscal challenge much tougher than it is now.
FIGURE 12.
sion’s proposals, it is far from certain that the commission will succeed,
especially if it does not engage in meaningful citizen education and
engagement efforts that will help build public understanding and sup-
port for its important task.
Government projections show that if current policy remains un-
changed, debt held by the public is projected to exceed 300 percent
of GDP by 2040. If that happens, then interest on the debt will be
so expensive that we will not have much hope of getting debt down
again. Furthermore, if we lose the confidence of our foreign investors
and pass a “tipping point,” America and the world could face a global
depression.
To keep the debt below a manageable level—e.g., 60 percent of GDP
(as discussed earlier in the debt section)—everything will have to be
on the table, but addressing the growth in health care costs is essen-
tial. CBO estimates that debt held by the public will be 62 percent of
GDP when fiscal year 2010 ends. Figure 12 compares a debt level of 60
percent of GDP to current long-term projections. In the final analysis,
SOURCES:
whatever spending reductions and productivity improvements cannot
21. save for the future, and invest savings wisely
investing, and making responsible use of credit
but also in my family’s knowledge and education
and that candidates for federal office disclose their proposed solutions
growing key challenges and delivering on their promises
programs and policies that work and create a better future
- Assign to the government only the responsibilities we are Federal Government Websites
willing to pay for in taxes. Programs that are scheduled to grow www.cms.gov
faster than the economy are unsustainable www.cbo.gov
- Recognize that there are no easy answers www.recovery.gov
www.federalreserve.gov
by building and sharing awareness of the fiscal challenge, the need www.gao.gov
for timely action, and the cost of inaction www.budget.house.gov
waysandmeans.house.gov
challenges and support civic groups that are working to address them www.jct.gov
www.medpac.gov
www.whitehouse.gov/omb
www.appropriations.senate.gov
www.budget.senate.gov
www.finance.senate.gov
www.ssa.gov
www.treas.gov/offices/tax-policy
- What are my short- and long-term personal financial objectives?
- What major milestones do I need to prepare for Other Organizations
(e.g., education, family, retirement)? www.aei.org
- When do I see myself retiring? Have I considered that for www.brookings.edu
each year I delay my retirement, I can substantially increase www.cato.org
my retirement income for the rest of my life? www.americanprogress.org
www.cbpp.org
22. www.cepr.net
crr.bc.edu
www.choosetosave.org
www.cagw.org
www.ced.org
www.crfb.org,
and its blog, US Budget Watch: www.usbudgetwatch.org
www.concordcoalition.org
www.ebri.org
www.fpaforfinancialplanning.org
www.thefiscaltimes.org
www.heritage.org
www.kff.org
www.napawash.org
www.nasi.org
www.ombwatch.org
www.iie.com
www.ppionline.org
www.publicagenda.org
www.taxfoundation.org
www.taxpolicycenter.org
www.truthinaccounting.org
www.urban.org
23. Our mission is to increase public awareness
of the nature and urgency of key economic
challenges threatening America’s future
and accelerate action on them. To meet these
challenges successfully, we work to bring
Americans together to find sensible,
sustainable solutions that transcend age, party
lines and ideological divides in order
to achieve real results.