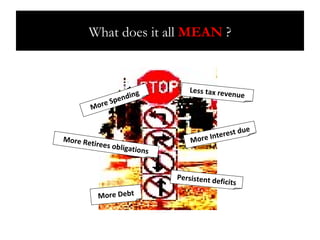
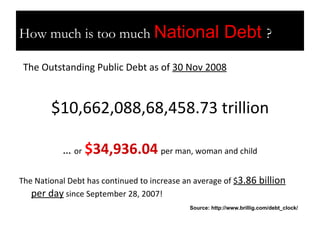
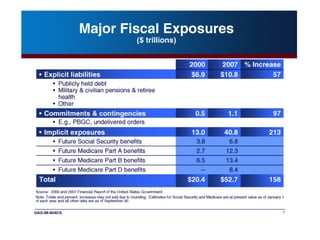
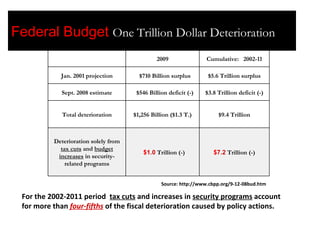
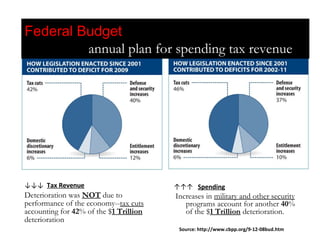
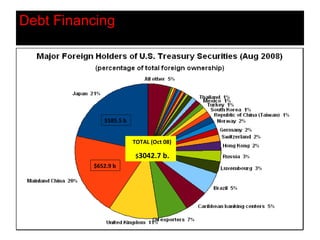
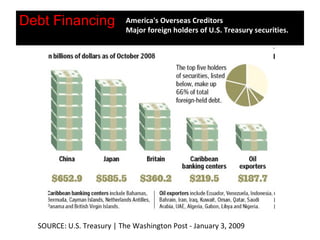
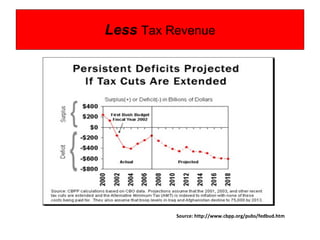
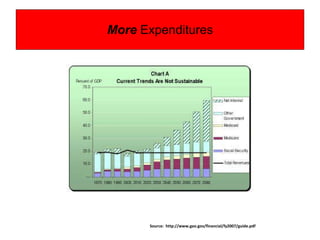
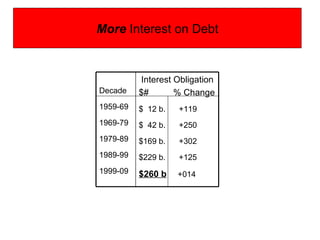
The document discusses the rising concerns regarding the U.S. federal budget, highlighting the unsustainable growth of national debt currently exceeding $10 trillion. It emphasizes the burden of consumer debt and required spending for public services versus tax revenue, leading to persistent deficits and future fiscal insecurity. The analysis projects a critical future where increasing retiree obligations and military expenditures further complicate the economy and threaten financial stability.


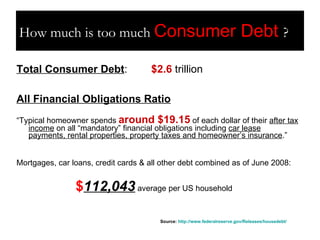
![U.S. Real GDP + $11.5 trillion U.S. National Debt - $ 10.6 trillion [92% of GDP] Real Median Income + $50,233 per Household Household Debt - $ 112,043 per Household [2.2* income] Unfunded Government - $ 500,000 per Household [10* income] Financial Obligations Source: “Taxpayers on the hook for $59 trillion” USA Today 5/29/2007 (2007 figures) How much is too much Unfunded? Reality Check](https://image.slidesharecdn.com/wfs09futureofus-budgetexpected21dec08k3-090925160934-phpapp01/85/Future-Of-US-Budget-Expected-Future-5-320.jpg)

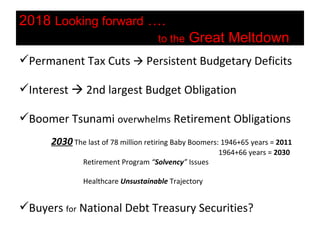
![Retiring Boomers sell-off investment Assets to cover living expenses [ ↓ price of assets?] KEY Dates For The Trust Fund EXHAUSTION OASI DI OASDI HI First year Outgo > Income - Interest . . . 2018 2005 2017 2008 First year Outgo > Income + Interest . . .2028 2012 2027 2010 Year Trust Fund Assets exhausted . . . . 2042 2025 2041 2019 Assets end 2007 (in billions) . . . . . . . . . . .$2,023.6 $214.9 $42.9 Loss of Confidence in Solvency of US, fewer foreign buyers, higher required yield/interest Fewer Buyers for National Debt ?](https://image.slidesharecdn.com/wfs09futureofus-budgetexpected21dec08k3-090925160934-phpapp01/85/Future-Of-US-Budget-Expected-Future-17-320.jpg)