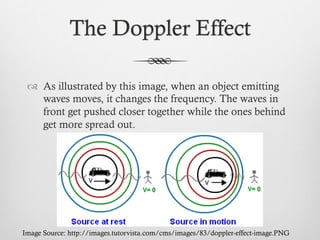
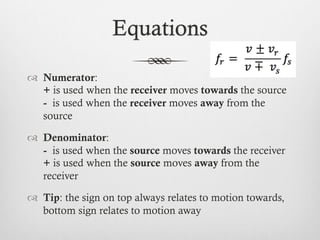
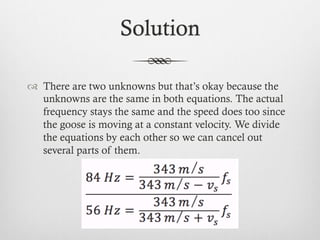
Sound waves are produced by the vibration of material objects. A disturbance in the form of a longitudinal wave travels away from the vibrating source. High-pitched sounds are produced by sources vibrating at high frequency, while low-pitched sounds are produced by low-frequency sources Sound waves consist of traveling pulses of high-pressure zones, or compression, alternating with pulses of low-pressures zones, or rarefaction. Sound can travel through gases, liquids, and solid, but not through a vacuum.
In this presentation, I explain what a standing wave on a string is, the difference between a standing wave and a travelling wave, and go over some practice problems.
Materials RequiredComputer and internet accessCalculator.docxwkyra78
Materials Required:
Computer and internet access
Calculator
Pen/pencil
Digital camera or scanner
Download and print the
Hubble Diagram Sheet
(as an additional option, you can create your graph with the Excel program or create your own graph by hand)
Total Time Required:
Approximately 2-3 Hours
Part 1. The Doppler Effect
Note:
For your lab report, only include your clearly labeled answers to the below questions in all parts. Copy/paste in your photos or diagrams when needed.
Among the great achievements of Einstein was his understanding of the speed of light. The speed of light, in a vacuum, is a constant at ~ 300,000 kilometers/second (the actual velocity is 299,792.458 km/s). The speed of light is essential to the viability of both Einstein’s theories of Special and General Relativity (since the speed of light is a constant it has been given its own mathematical symbol, c). If the speed of light is not constant than neither of Einstein’s theories are credible and would not be accurate in describing physics at the larger-scales of the Universe and objects moving at high velocities close to the speed of light.
Therefore, since the speed of light is a constant any motion by an object emitting light has no effect on the lights velocity nor does an object seeing light from a source moving towards it measure any change in the speed of the light coming towards it. For example, a car is driving at night with its headlights on at a speed of 75 miles per hour. What is the speed of the light coming from the headlights? Common sense would give its speed as the speed of light plus 75 miles per hour (c + 75) but the measured speed is still the speed of light ( c ). Something had to change in this situation however and in in this part of the lab you will be investigating the change that is occurring here which is known as the Doppler Effect.
Use this link to the
Doppler Shift Demonstrator Animation.
Click on the ‘Help’ button for instructions on how to run the animation. (Below is a screenshot of the Doppler Shift Demonstrator).
Click and move the emitting source towards the middle, left side of the screen and click and move the observer to the opposite side. You can control the frequency of the emitted wave with the rate slider bar and can move either the source or object by left-clicking, holding, and dragging the object towards the direction you want it to move. Answer the following questions based on the simulations being viewed.
With the emitting source and the observer on the opposite side of the screen press the ‘start emission’ button. Record your observations of the wave and its wavelength as seen by
both
the emitting source and the observer (be as detailed as possible).
Now click, hold, and drag the observer so it is moving to the left, towards the emitting source. Record your observations of the wave and its wavelength as seen by
both
the emitting source and the observer (try to make the motion as uniform as poss.
Modeling the Doppler Effect using Audacity. Can we model the Doppler Effect, observing higher frequencies of a sound as it approaches, and lower frequencies as it moves farther away?
How will our observed values compare to values calculated using known equations?. see here for answers.
Vijayan Thanasekaran, Ashley Rodde and Gabriela Quiroz
Nutraceutical market, scope and growth: Herbal drug technologyLokesh Patil
As consumer awareness of health and wellness rises, the nutraceutical market—which includes goods like functional meals, drinks, and dietary supplements that provide health advantages beyond basic nutrition—is growing significantly. As healthcare expenses rise, the population ages, and people want natural and preventative health solutions more and more, this industry is increasing quickly. Further driving market expansion are product formulation innovations and the use of cutting-edge technology for customized nutrition. With its worldwide reach, the nutraceutical industry is expected to keep growing and provide significant chances for research and investment in a number of categories, including vitamins, minerals, probiotics, and herbal supplements.
Salas, V. (2024) "John of St. Thomas (Poinsot) on the Science of Sacred Theol...Studia Poinsotiana
I Introduction
II Subalternation and Theology
III Theology and Dogmatic Declarations
IV The Mixed Principles of Theology
V Virtual Revelation: The Unity of Theology
VI Theology as a Natural Science
VII Theology’s Certitude
VIII Conclusion
Notes
Bibliography
All the contents are fully attributable to the author, Doctor Victor Salas. Should you wish to get this text republished, get in touch with the author or the editorial committee of the Studia Poinsotiana. Insofar as possible, we will be happy to broker your contact.
This presentation explores a brief idea about the structural and functional attributes of nucleotides, the structure and function of genetic materials along with the impact of UV rays and pH upon them.
Earliest Galaxies in the JADES Origins Field: Luminosity Function and Cosmic ...Sérgio Sacani
We characterize the earliest galaxy population in the JADES Origins Field (JOF), the deepest
imaging field observed with JWST. We make use of the ancillary Hubble optical images (5 filters
spanning 0.4−0.9µm) and novel JWST images with 14 filters spanning 0.8−5µm, including 7 mediumband filters, and reaching total exposure times of up to 46 hours per filter. We combine all our data
at > 2.3µm to construct an ultradeep image, reaching as deep as ≈ 31.4 AB mag in the stack and
30.3-31.0 AB mag (5σ, r = 0.1” circular aperture) in individual filters. We measure photometric
redshifts and use robust selection criteria to identify a sample of eight galaxy candidates at redshifts
z = 11.5 − 15. These objects show compact half-light radii of R1/2 ∼ 50 − 200pc, stellar masses of
M⋆ ∼ 107−108M⊙, and star-formation rates of SFR ∼ 0.1−1 M⊙ yr−1
. Our search finds no candidates
at 15 < z < 20, placing upper limits at these redshifts. We develop a forward modeling approach to
infer the properties of the evolving luminosity function without binning in redshift or luminosity that
marginalizes over the photometric redshift uncertainty of our candidate galaxies and incorporates the
impact of non-detections. We find a z = 12 luminosity function in good agreement with prior results,
and that the luminosity function normalization and UV luminosity density decline by a factor of ∼ 2.5
from z = 12 to z = 14. We discuss the possible implications of our results in the context of theoretical
models for evolution of the dark matter halo mass function.
Seminar of U.V. Spectroscopy by SAMIR PANDASAMIR PANDA
Spectroscopy is a branch of science dealing the study of interaction of electromagnetic radiation with matter.
Ultraviolet-visible spectroscopy refers to absorption spectroscopy or reflect spectroscopy in the UV-VIS spectral region.
Ultraviolet-visible spectroscopy is an analytical method that can measure the amount of light received by the analyte.
Deep Behavioral Phenotyping in Systems Neuroscience for Functional Atlasing a...Ana Luísa Pinho
Functional Magnetic Resonance Imaging (fMRI) provides means to characterize brain activations in response to behavior. However, cognitive neuroscience has been limited to group-level effects referring to the performance of specific tasks. To obtain the functional profile of elementary cognitive mechanisms, the combination of brain responses to many tasks is required. Yet, to date, both structural atlases and parcellation-based activations do not fully account for cognitive function and still present several limitations. Further, they do not adapt overall to individual characteristics. In this talk, I will give an account of deep-behavioral phenotyping strategies, namely data-driven methods in large task-fMRI datasets, to optimize functional brain-data collection and improve inference of effects-of-interest related to mental processes. Key to this approach is the employment of fast multi-functional paradigms rich on features that can be well parametrized and, consequently, facilitate the creation of psycho-physiological constructs to be modelled with imaging data. Particular emphasis will be given to music stimuli when studying high-order cognitive mechanisms, due to their ecological nature and quality to enable complex behavior compounded by discrete entities. I will also discuss how deep-behavioral phenotyping and individualized models applied to neuroimaging data can better account for the subject-specific organization of domain-general cognitive systems in the human brain. Finally, the accumulation of functional brain signatures brings the possibility to clarify relationships among tasks and create a univocal link between brain systems and mental functions through: (1) the development of ontologies proposing an organization of cognitive processes; and (2) brain-network taxonomies describing functional specialization. To this end, tools to improve commensurability in cognitive science are necessary, such as public repositories, ontology-based platforms and automated meta-analysis tools. I will thus discuss some brain-atlasing resources currently under development, and their applicability in cognitive as well as clinical neuroscience.
DERIVATION OF MODIFIED BERNOULLI EQUATION WITH VISCOUS EFFECTS AND TERMINAL V...Wasswaderrick3
In this book, we use conservation of energy techniques on a fluid element to derive the Modified Bernoulli equation of flow with viscous or friction effects. We derive the general equation of flow/ velocity and then from this we derive the Pouiselle flow equation, the transition flow equation and the turbulent flow equation. In the situations where there are no viscous effects , the equation reduces to the Bernoulli equation. From experimental results, we are able to include other terms in the Bernoulli equation. We also look at cases where pressure gradients exist. We use the Modified Bernoulli equation to derive equations of flow rate for pipes of different cross sectional areas connected together. We also extend our techniques of energy conservation to a sphere falling in a viscous medium under the effect of gravity. We demonstrate Stokes equation of terminal velocity and turbulent flow equation. We look at a way of calculating the time taken for a body to fall in a viscous medium. We also look at the general equation of terminal velocity.
Observation of Io’s Resurfacing via Plume Deposition Using Ground-based Adapt...Sérgio Sacani
Since volcanic activity was first discovered on Io from Voyager images in 1979, changes
on Io’s surface have been monitored from both spacecraft and ground-based telescopes.
Here, we present the highest spatial resolution images of Io ever obtained from a groundbased telescope. These images, acquired by the SHARK-VIS instrument on the Large
Binocular Telescope, show evidence of a major resurfacing event on Io’s trailing hemisphere. When compared to the most recent spacecraft images, the SHARK-VIS images
show that a plume deposit from a powerful eruption at Pillan Patera has covered part
of the long-lived Pele plume deposit. Although this type of resurfacing event may be common on Io, few have been detected due to the rarity of spacecraft visits and the previously low spatial resolution available from Earth-based telescopes. The SHARK-VIS instrument ushers in a new era of high resolution imaging of Io’s surface using adaptive
optics at visible wavelengths.
Toxic effects of heavy metals : Lead and Arsenicsanjana502982
Heavy metals are naturally occuring metallic chemical elements that have relatively high density, and are toxic at even low concentrations. All toxic metals are termed as heavy metals irrespective of their atomic mass and density, eg. arsenic, lead, mercury, cadmium, thallium, chromium, etc.
Professional air quality monitoring systems provide immediate, on-site data for analysis, compliance, and decision-making.
Monitor common gases, weather parameters, particulates.
The ability to recreate computational results with minimal effort and actionable metrics provides a solid foundation for scientific research and software development. When people can replicate an analysis at the touch of a button using open-source software, open data, and methods to assess and compare proposals, it significantly eases verification of results, engagement with a diverse range of contributors, and progress. However, we have yet to fully achieve this; there are still many sociotechnical frictions.
Inspired by David Donoho's vision, this talk aims to revisit the three crucial pillars of frictionless reproducibility (data sharing, code sharing, and competitive challenges) with the perspective of deep software variability.
Our observation is that multiple layers — hardware, operating systems, third-party libraries, software versions, input data, compile-time options, and parameters — are subject to variability that exacerbates frictions but is also essential for achieving robust, generalizable results and fostering innovation. I will first review the literature, providing evidence of how the complex variability interactions across these layers affect qualitative and quantitative software properties, thereby complicating the reproduction and replication of scientific studies in various fields.
I will then present some software engineering and AI techniques that can support the strategic exploration of variability spaces. These include the use of abstractions and models (e.g., feature models), sampling strategies (e.g., uniform, random), cost-effective measurements (e.g., incremental build of software configurations), and dimensionality reduction methods (e.g., transfer learning, feature selection, software debloating).
I will finally argue that deep variability is both the problem and solution of frictionless reproducibility, calling the software science community to develop new methods and tools to manage variability and foster reproducibility in software systems.
Exposé invité Journées Nationales du GDR GPL 2024
Deep Software Variability and Frictionless Reproducibility
The Doppler Effect
1.
2. The Doppler Effect
™ According to Sheldon Cooper of the Big Bang Theory,
the Doppler effect is “the apparent change in the
frequency of a wave caused by relative motion between
the source of the wave and the observer.”
™ It affects any type of wave including light and sound.
™ The Doppler effect only applies when the motion is
directly towards or away between the source and the
observer.
3. The Doppler Effect
™ As illustrated by this image, when an object emitting
waves moves, it changes the frequency. The waves in
front get pushed closer together while the ones behind
get more spread out.
Image Source: http://images.tutorvista.com/cms/images/83/doppler-effect-image.PNG
4. The Doppler Effect
™ You can see that the wavelength in front of the motion
of the object decreases. Although the object is moving,
the sound speed itself does not change. If the medium
stays the same, the speed also stays constant. Thus, the
frequency increases as a result.
™ It’s the opposite for the waves behind the motion of the
object. The wavelength increases and the frequency
decreases.
™ This relationship can be seen in the following equation:
v=fλ
5. Equations
™ The relationship between the frequencies of the
receiver and the source of the waves is denoted by the
following equation where v is the speed of sound, vr is
the speed of the receiver, vs is the speed of the source
and fr and fs are the frequencies of the source and the
receiver respectively.
6. Equations
™ Numerator:
+ is used when the receiver moves towards the source
- is used when the receiver moves away from the
source
™ Denominator:
- is used when the source moves towards the receiver
+ is used when the source moves away from the
receiver
™ Tip: the sign on top always relates to motion towards,
bottom sign relates to motion away
7. Question
™ You robbed a bank and speed away in a car at 80 m/s.
A police car is chasing you from behind at 95 m/s. Its
siren, sounding at a frequency of 775 Hz, makes you
anxious. Make a prediction. Do you expect the
frequency you hear to be higher or lower? Calculate the
frequency will you hear due to the motion of the cars.
95 m/s
775 Hz 80 m/s
Image Source: http://fc05.deviantart.net/fs71/f/2012/088/2/8/bmw_car_chase_by_domino3d-d4ub8uw.jpg
8. Solution
™ You should expect to hear a higher frequency because
the motion of the police car is headed towards you,
pushing the wave fronts of sound closer together and
increasing the frequency that you’ll hear them at.
™ Looking at the question, you are given vr= 80 m/s,
vs= 95 m/s, and fs= 775 Hz, and you know the speed
of sound in air is 343 m/s. The easy part is plugging
them into the equation. Then you just have to decide
on whether to use + or – signs.
9. Solution
™ Since you are moving away from the police car, you
use a – sign in the numerator, and since the police car
is moving towards you, you use a – sign in the
denominator. Plugging in the numbers gives you:
™ So you get fr= 822 m/s, which is the frequency you
hear from the siren which is higher than 775 m/s as
predicted.
10. Question
™ You are standing beside a lake when suddenly a scary
looking goose comes running through the grass towards you
at a constant speed, honking angrily. You hear a frequency of
84.0 Hz. The goose as it turns out, is not mad at you, but
rather at the kid chasing its goslings, and runs straight
through your legs. After it passes, you hear a frequency of
56.0 Hz. What is the speed of the goose?
Image Source: http://hollypointassociation.org/a_angry_goose_400p.jpg
11. Solution
™ We know 2 frequencies: As the goose comes towards
us and as it goes away from us. So, we need to use 2
equations. We don’t know the actual frequency. With
what we know, these are the 2 equations we get:
™ We have a – in the 1st equation because the goose is
moving towards us, + in the 2nd because it moves away
12. Solution
™ There are two unknowns but that’s okay because the
unknowns are the same in both equations. The actual
frequency stays the same and the speed does too since
the goose is moving at a constant velocity. We divide
the equations by each other so we can cancel out
several parts of them.
13. Solution
™ 84/56 is 3/2. fs and the 343 m/s in the numerator of
the top and the bottom equations cancel out leaving
you with:
14. Clarification
™ If you are confused about the previous slide, this is
where I will explain. If not, skip this slide.
™ These are equivalent to each other because when you
divide by a fraction, you simply multiply by the
reciprocal (flip the fraction). Since 343 m/s cancels
out, you are left with:
15. Solution
™ Cross multiply, distribute, gather the like terms on
separate sides to isolate the variable vs. Then solve for
vs.
™ Final answer: The goose was running at 68.6 m/s