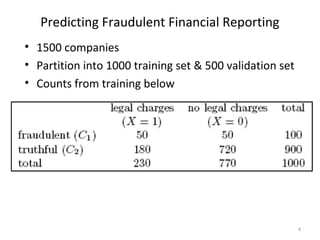
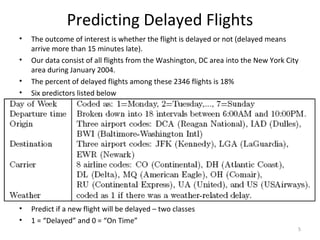
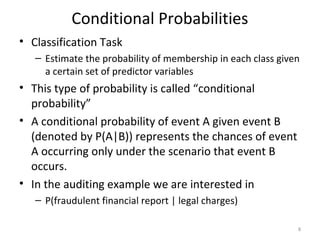
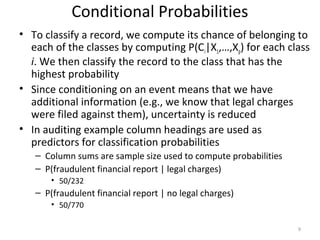
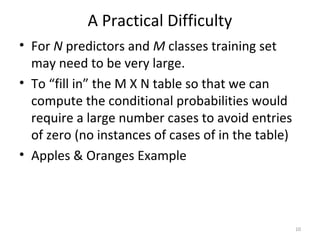
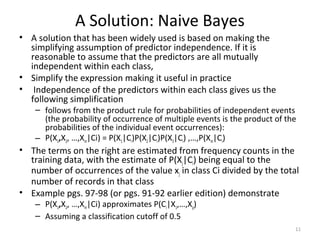
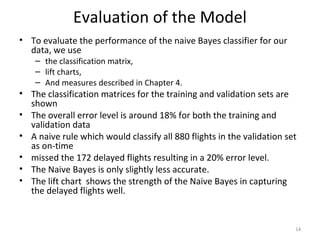
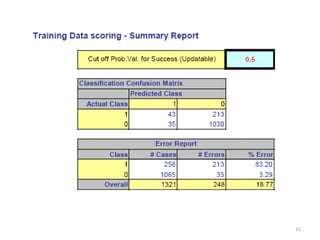
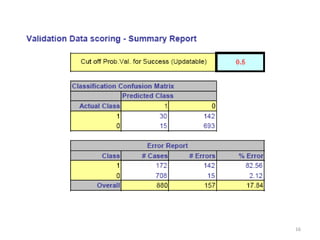
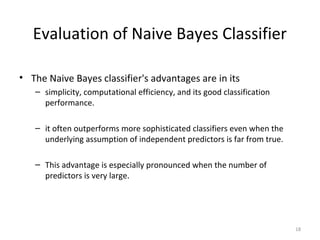
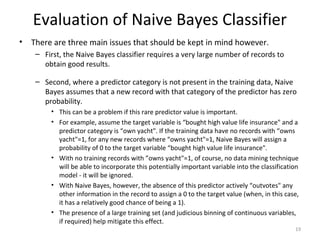
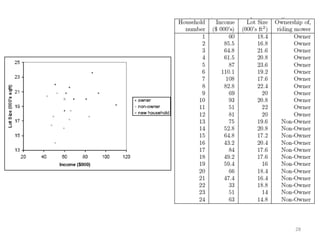
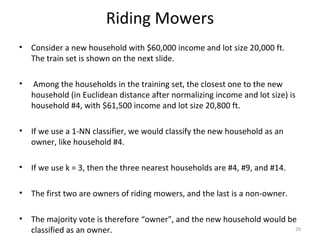
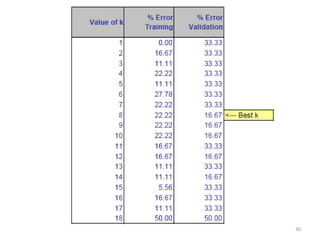
This document summarizes three simple classification methods: Naive Rule, Naive Bayes, and k-Nearest Neighbor (k-NN). It provides examples of using each method to predict fraudulent financial reporting and delayed flights. For Naive Rule, it classifies all cases based on the majority class in the training data. Naive Bayes improves on this by using predictor variables to estimate conditional probabilities of class membership. k-NN classifies new cases based on the classes of the k nearest cases in the training data in predictor space. The document evaluates the performance of Naive Bayes on these examples and discusses its advantages and limitations.
The document evaluates alternative methods to approximating historical value at risk (HsVaR) that can significantly reduce computational requirements compared to the full revaluation method, while maintaining acceptable accuracy. It considers a sample portfolio and calculates HsVaR using full revaluation and approximation methods involving delta, delta-gamma, and delta-gamma-theta. The results show the approximation methods produce HsVaR values close to full revaluation, within 1-18%, while requiring far fewer valuations, resulting in up to 99.6% reduction in computations. This demonstrates the tradeoff between accuracy and reduced processing from using approximation methods.
This document summarizes a presentation on maximizing profit from customer churn prediction models using cost-sensitive machine learning techniques. It discusses how traditional evaluation measures like accuracy do not account for different costs of prediction errors. It then covers cost-sensitive approaches like cost-proportionate sampling, Bayes minimum risk, and cost-sensitive decision trees. The results show these cost-sensitive methods improve savings over traditional models and sampling approaches when the business costs are incorporated into the predictive modeling.
POSSIBILISTIC SHARPE RATIO BASED NOVICE PORTFOLIO SELECTION MODELScscpconf
Â
This document summarizes a research paper that proposes new portfolio selection models using possibilistic Sharpe ratio to account for uncertainty in fuzzy environments. It defines possibilistic moments like mean, variance, skewness, and risk premium for fuzzy numbers. It then defines possibilistic Sharpe ratio as the ratio of possibilistic risk premium to standard deviation. New bi-objective and multi-objective portfolio models are presented that maximize possibilistic Sharpe ratio and skewness to allow for asymmetric returns. The models are solved using a genetic algorithm and tested on stock price data to demonstrate the approach.
Efficient Online Evaluation of Big Data Stream ClassifiersAlbert Bifet
Â
The evaluation of classifiers in data streams is fundamental so that poorly-performing models can be identified, and either improved or replaced by better-performing models. This is an increasingly relevant and important task as stream data is generated from more sources, in real-time, in large quantities, and is now considered the largest source of big data. Both researchers and practitioners need to be able to effectively evaluate the performance of the methods they employ. However, there are major challenges for evaluation in a stream. Instances arriving in a data stream are usually time-dependent, and the underlying concept that they represent may evolve over time. Furthermore, the massive quantity of data also tends to exacerbate issues such as class imbalance. Current frameworks for evaluating streaming and online algorithms are able to give predictions in real-time, but as they use a prequential setting, they build only one model, and are thus not able to compute the statistical significance of results in real-time. In this paper we propose a new evaluation methodology for big data streams. This methodology addresses unbalanced data streams, data where change occurs on different time scales, and the question of how to split the data between training and testing, over multiple models.
An introduction to frequent pattern mining algorithms and their usage in mining log data. Presented by Krishna Sridhar (Dato) at Seattle DAML meetup, Feb 2016.
In this Spark session Ravi Saraogi talks about why estimating default risk in fund structures can be a challenging task. He presents on how this process has evolved over the years and the current methodologies for assessing such risks.
Slides from my PhD defense
Example-Dependent Cost-Sensitive Classification
Applications in Financial Risk Modeling and Marketing Analytics
https://github.com/albahnsen/phd-thesis
K-Nearest Neighbor (KNN) is an instance-based learning algorithm where classification of new data points is based on the majority class of its k nearest neighbors. It works by storing all training examples and classifying new examples based on the majority class of its nearest neighbors, where distance between examples is measured using a metric like Euclidean distance. KNN can perform both classification and regression tasks, with classification being the majority class for discrete targets and regression being the average of the k nearest neighbors' values for continuous targets.
The document discusses k-nearest neighbors (k-NN) classification. k-NN classification involves relating new instances to past observations based on similarity, by finding the k closest training examples in a data set and using their class labels to determine the class of the new instance. The document uses an example of predicting whether a cup will break when dropped based on its hardness and the height dropped from. It shows how past observations of cups can be clustered based on these factors, and a new instance is classified based on the classes of its nearest neighbors using Euclidean distance.
The document discusses the K-nearest neighbor (K-NN) classifier, a machine learning algorithm where data is classified based on its similarity to its nearest neighbors. K-NN is a lazy learning algorithm that assigns data points to the most common class among its K nearest neighbors. The value of K impacts the classification, with larger K values reducing noise but possibly oversmoothing boundaries. K-NN is simple, intuitive, and can handle non-linear decision boundaries, but has disadvantages such as computational expense and sensitivity to K value selection.
For more information about http://www.zricks.com/Prestige-Gulmohar-Horamavu-Bangalore/14159
Prestige Gulmohar, Horamavu, Bangalore. Visit: http://www.zricks.com
For more information about https://www.zricks.com/Legacy-Tierra-Rajanukunte-Bangalore/15242
Legacy Tierra, Rajanukunte, Doddaballapur Road, Bangalore. Visit: http://www.zricks.com
This document contains 20 repetitions of the website URL www.Zricks.com. The high level information provided is simply the website address www.Zricks.com, which is listed 20 separate times consecutively with no other text or context.
For more information about http://www.zricks.com/Bren-Imperia-Harlur-Bangalore/15196
Bren Imperia, Sarjapur Road, Bangalore. Visit: http://www.zricks.com
The document contains the repeated URL www.Zricks.com listed over 30 times. It provides no other text or context. The high-level summary is that the document exclusively lists the same website address multiple times without any other accompanying information.
For more information about http://www.zricks.com/Prestige-IVY-Terraces-Bellandur-Bangalore/14196
Prestige Ivy Terraces, Bellandur, Bangalore. Visit: http://www.zricks.com
The document contains 25 repetitions of the URL www.Zricks.com. It provides no other text or context, but through repetition alone emphasizes this particular website address. In under 3 sentences, no meaningful high-level summary can be given due to the lack of substance or essential information in the source material.
For more information about http://www.zricks.com/Indiabulls-One-09-Sector-109-Gurgaon/14716
Indiabulls One 09, Sector 109, Gurgaon. Visit: http://www.zricks.com
For more information about http://www.zricks.com/Asset-Alcazar-Volagerekallahalli-Bangalore/15092
Asset Alcazar, Volagerekallahalli, Off Sarjapur Road, Bangalore. Visit: http://www.zricks.com
For more information about http://www.zricks.com/My-Home-Avatar-Puppalaguda-Hyderabad/14827
My Home Avatar, Puppalaguda, Nehru Outer Ring Road, Hyderabad. Visit: http://www.zricks.com
For more information about https://www.zricks.com/Paranjape-Athashri-Xion-Hinjawadi-Pune/15520
Paranjape Athashri Xion, Hinjawadi, Hinjawadi Phase 2 Road, Pune, Visit: http://www.zricks.com
UNIT2_NaiveBayes algorithms used in machine learningmichaelaaron25322
Â
This document provides an overview of Naive Bayes classifiers and Support Vector Machines (SVMs). It discusses the key concepts behind Naive Bayes, including Bayes' theorem and the assumption of independence among predictors. It also explains how Naive Bayes classifiers work and are implemented in scikit-learn. Specifically, it covers Bernoulli, Multinomial, and Gaussian Naive Bayes models. The document then discusses SVMs, focusing on linear and kernel-based classification as well as support vector regression. Examples of applications of Naive Bayes and pros/cons of the approach are also summarized.
The document discusses Naive Bayes classifiers and Support Vector Machines (SVM). It explains the concepts of Naive Bayes, including Bayes' theorem and the assumptions of Naive Bayes. It provides examples of using Naive Bayes for classification, including calculating posterior probabilities. It also discusses different types of Naive Bayes classifiers like Bernoulli, Multinomial, and Gaussian Naive Bayes. Finally, it briefly introduces the concept of Support Vector Machines.
This document summarizes an application of Bayesian analysis to forecast insurance loss payments. It begins with an overview of Bayesian methodology and credibility theory. It then presents a case study using a Bayesian hierarchical model to forecast loss reserves for workers' compensation claims data from 10 large insurance companies. Key steps included specifying the probability model, performing Markov chain Monte Carlo simulations for computation and inference, and checking model fit. Results showed the Bayesian model provided greater reserve estimates than traditional methods and accounted for uncertainty in long-term predictions.
UNIT 3: Data Warehousing and Data MiningNandakumar P
Â
UNIT-III Classification and Prediction: Issues Regarding Classification and Prediction – Classification by Decision Tree Introduction – Bayesian Classification – Rule Based Classification – Classification by Back propagation – Support Vector Machines – Associative Classification – Lazy Learners – Other Classification Methods – Prediction – Accuracy and Error Measures – Evaluating the Accuracy of a Classifier or Predictor – Ensemble Methods – Model Section.
Supervised learning involves using a training dataset to learn a target function that can be used to predict class labels or attribute values. The document discusses supervised learning and classification, including types of supervised learning problems like classification and regression. It provides examples of classification algorithms like K-nearest neighbors, decision trees, naive Bayes, and support vector machines. It also gives examples of how to implement classification algorithms using scikit-learn and discusses evaluating classification model performance based on accuracy.
This document provides an overview of machine learning concepts including:
1. The three main types of machine learning are supervised learning, unsupervised learning, and reinforcement learning. Supervised learning uses labeled training data to build predictive models for classification and regression tasks.
2. Classification predicts categorical labels while regression predicts continuous valued outputs. Examples of each are predicting tumor malignancy (classification) and real estate prices (regression).
3. Supervised learning algorithms like Naive Bayes, decision trees, and k-nearest neighbors are used to build classification models from labeled training data to classify new examples.
The document discusses using predictive data mining techniques to improve customer retention and development. It outlines the workflow used which includes data cleaning, clustering customers using K-Means and MST-based clustering, making classification models for each cluster to predict churn, and developing strategies to retain and develop customers. The results show the clusters formed, classification accuracies between Naive Bayes and KNN algorithms, and the final hybrid model using MST clustering and Naive Bayes classification achieving the best performance.
The document discusses the Naive Bayes classification model. It begins by explaining that a Naive Bayes classifier is a simple probabilistic classifier based on Bayes' theorem that makes strong independence assumptions. It assumes the presence or absence of a feature is unrelated to any other feature. The document then provides mathematical formulas to describe the Naive Bayes probabilistic model and explains how to apply it to classify data. An example is shown predicting whether someone will buy a computer based on attributes like age, income, student status, and credit rating. The document concludes by discussing some common applications of Naive Bayes classification like text classification, spam filtering, and recommender systems.
The document discusses various data mining techniques including association rules, classification, clustering, and approaches to discovering patterns in datasets. It covers clustering algorithms like partition and hierarchical clustering. It also explains different data mining problems like discovering sequential patterns, patterns in time series data, and classification and regression rules.
This document provides an overview of probabilistic approaches to information retrieval. It discusses why probabilities are useful for IR given the inherent uncertainty. It covers the Probability Ranking Principle, which aims to rank documents by estimated probability of relevance. Other probabilistic techniques discussed include probabilistic indexing, probabilistic inference using logic representations, and using Bayesian networks for IR. The document notes open issues with some of these approaches and concludes by surveying existing survey papers on probabilistic IR.
This document provides an introduction to statistical modeling and machine learning concepts. It discusses:
- What statistical modeling and machine learning are, including training models on data and evaluating them.
- Common statistical models like Gaussian, Bernoulli, and Multinomial distributions.
- Supervised learning tasks like regression and classification, and unsupervised clustering.
- Key concepts like overfitting, evaluation metrics, and issues with modeling like black swans and the long tail.
Subscription fraud analytics using classificationSomdeep Sen
Â
A fictitious telecom company called Bad Idea came up with a strange rate plan called Praxis Plan where the callers are allowed to make only one call in the Morning (9AM-Noon), Afternoon (Noon-4PM), Evening(4PM-9PM) and Night (9PM-Midnight); i.e. four calls per day. Despite the popularity of the plan, Bad Idea was a target of Subscription Fraud by a gang of fraudsters consisting of three people: Sally, Virginia and Vince. They finally terminated their services. Bad Idea has their call logs spanning over one and half months.
The analytics team of the company has been provided two data sets: Black-List Subscriber Call-Logs & Audit Log. The Black-List Subscriber Call-Logs data set includes the calling patterns of the three fraudsters i.e. Sally, Virginia and Vince. After every 5 days the company undertakes an audit to see whether these Fraudsters have joined their network. The company reviews the list of subscribers who have made calls to the same people as these three fraudsters and in the same time frame. This has been provided in the Audit Log.
Test Data: http://bit.ly/1du9cRs
Training Data: http://bit.ly/1du9AQ1
This document provides an overview of machine learning and logistic regression. It discusses key concepts in machine learning like representation, evaluation, and optimization. It also discusses different machine learning algorithms like decision trees, neural networks, and support vector machines. The document then focuses on logistic regression, explaining concepts like maximum likelihood estimation, concordance, and confusion matrices which are used to evaluate logistic regression models. It provides an example of using logistic regression for a banking customer classification problem to predict defaults.
The document discusses various techniques for data reduction including data sampling, data cleaning, data transformation, and data segmentation to break down large datasets into more manageable groups that provide better insight, as well as hierarchical and k-means clustering methods for grouping similar objects into clusters to analyze relationships in the data.
A lot of people talk about Data Mining, Machine Learning and Big Data. It clearly must be important, right?
A lot of people are also trying to sell you snake oil - sometimes half-arsed and overpriced products or solutions promising a world of insight into your customers or users if you handover your data to them. Instead, trying to understanding your own data and what you could do with it, should be the first thing you’d be looking at.
In this talk, we’ll introduce some basic terminology about Data and Text Mining as well as Machine Learning and will have a look at what you can on your own to understand more about your data and discover patterns in your data.
This document provides an overview of recommendation systems and collaborative filtering algorithms. It describes memory-based and model-based collaborative filtering, including user-based and item-based approaches. Challenges with recommendation systems like data sparsity and scalability are also discussed. The document demonstrates collaborative filtering using the Mahout library on Movielens data and outlines future work on improving scalability and developing real-time recommendations.
This document discusses classification and clustering techniques used in search engines. It covers classification tasks like spam detection, sentiment analysis, and ad classification. Naive Bayes and support vector machines are described as common classification approaches. Features, feature selection, and evaluation metrics for classifiers are also summarized.
This document provides an overview of Google App Engine for Java, including its key features and limitations. It discusses the App Engine stack, how to configure and run Java applications on App Engine using the Java Datastore, Mail, URL Fetch, Images, Memcache, and XMPP services. The document also covers quotas, the development SDK, and deploying/managing apps through the App Engine administration console.
Motivation for multithreaded architecturesYoung Alista
Â
The document discusses the motivation for and design of multithreaded architectures. It aims to increase processor utilization by allowing multiple independent instruction streams, or threads, to execute simultaneously. This can compensate for a lack of instruction-level parallelism in individual threads. Simultaneous multithreading (SMT) processors in particular issue instructions from multiple threads each cycle without hardware context switching. SMT achieves high throughput with minimal performance degradation to individual threads by sharing most hardware resources between threads.
This document discusses serialization in .NET. Serialization is the process of converting an object graph to a linear sequence of bytes to send over a stream. The document covers basic serialization using attributes, implementing interfaces like ISerializable for custom serialization, and creating custom formatters. Key points are that types must be marked as serializable, an object graph contains referenced objects, and interfaces like ISerializable and IDeserializationEventListener allow customizing the serialization process.
- Decision trees are a supervised learning technique used for classification problems. They work by recursively splitting a dataset based on the values of predictor variables and assigning class labels to the terminal nodes.
- The document describes how decision trees are constructed by starting with the entire training set at the root node and then recursively splitting the data into purer child nodes based on attribute values. Attribute selection at each node is done using an impurity-based heuristic like information gain.
The document provides an overview of business analytics (BA) including its history, types, examples, challenges, and relationship to data mining. BA involves exploring past business performance data to gain insights and guide planning. It can focus on specific business segments. Types of BA include reporting, affinity grouping, clustering, and predictive analytics. Challenges to BA include acquiring high quality data and rapidly processing large volumes of data. Data mining is an important part of BA, helping to sort and analyze large datasets.
The document discusses data mining and knowledge discovery from large data sets. It begins by defining the terms data, information, knowledge, and wisdom in a hierarchy. It then explains that the growth of data from various sources has created a need for data mining to extract useful knowledge from large data repositories. The key aspects of data mining discussed are that it aims to discover previously unknown, implicit and potentially useful patterns from large data sets in an automated manner. The document outlines the interdisciplinary nature of data mining and its relationship to knowledge discovery in databases. It describes the types of data that can be mined, including structured, transactional, time-series and web data, as well as common data mining tasks like classification, prediction and clustering.
The document discusses non-uniform cache architectures (NUCA), cache coherence, and different implementations of directories in multicore systems. It describes NUCA designs that map data to banks based on distance from the controller to exploit non-uniform access times. Cache coherence is maintained using directory-based protocols that track copies of cache blocks. Directories can be implemented off-chip in DRAM or on-chip using duplicate tag stores or distributing the directory among cache banks.
The document discusses memory hierarchy and cache performance. It introduces the concepts of memory hierarchy, cache hits, misses, and different types of cache organizations like direct mapped, set associative, and fully associative caches. It analyzes how cache performance is affected by miss rate, miss penalty, block size, cache size, and associativity. Adding a second level cache can help reduce the miss penalty and improve overall performance.
The document proposes optimizing DRAM caches for latency rather than hit rate. It summarizes previous work on DRAM caches like Loh-Hill Cache that treated DRAM cache similarly to SRAM cache. This led to high latency and low bandwidth utilization.
The document introduces the Alloy Cache design which avoids tag serialization and keeps tags and data in the same DRAM row for lower latency. It also proposes a Memory Access Predictor to selectively use parallel or serial access models for the lowest latency. Simulation results show Alloy Cache with a predictor outperforms previous designs like SRAM-Tags. The document advocates optimizing DRAM caches for latency first before hit rate given their different constraints compared to SRAM caches.
This document discusses how Analysis Services caching works and provides strategies for warming the Storage Engine and Formula Engine caches. It explains that the Storage Engine handles data retrieval from disk while the Formula Engine determines which data is needed for queries. Caching can improve performance but requires consideration of memory usage, cache structures, and data granularity. The document recommends using the CREATE CACHE statement and running regular queries to pre-populate the caches, while being mindful of how security and non-deterministic elements can impact cache sharing and scoping. Automating cache warming through SQL Server Agent jobs or SSIS packages is suggested.
The document discusses the key elements of the object model, including abstraction, encapsulation, modularity, and hierarchy. It explains that abstraction is one of the fundamental ways to cope with complexity in software design. Abstraction focuses on the essential characteristics of an object that distinguish it from other objects, from the perspective of the viewer. The object model provides a conceptual framework for object-oriented programming that is based on these elements.
Optimizing shared caches in chip multiprocessorsYoung Alista
Â
Chip multiprocessors, which place multiple processors on a single chip, have become common in modern processors. There are different approaches to managing caches in chip multiprocessors, including private caches for each processor or shared caches. The optimal approach balances factors like interconnect traffic, duplication of data, load balancing, and cache hit rates.
This document discusses abstract data types (ADTs) and their implementation in various programming languages. It covers the key concepts of ADTs including data abstraction, encapsulation, information hiding, and defining the public interface separately from the private implementation. It provides examples of ADTs implemented using modules in Modula-2, packages in Ada, classes in C++, generics in Java and C#, and classes in Ruby. Parameterized and encapsulation constructs are also discussed as techniques for implementing and organizing ADTs.
This document discusses the key concepts of object-oriented programming including abstraction, encapsulation, classes and objects. It defines abstraction as focusing on the essential characteristics of an object and hiding unnecessary details. Encapsulation hides the implementation of an object's methods and data. A class combines abstraction and encapsulation, defining the data attributes and methods while hiding implementation details. Objects are instantiations of classes that come to life through constructors and die through destructors.
This document discusses several programming paradigms and concepts related to multi-threaded programming. It covers single process vs multi process vs multi-core/multi-threaded programming. It also discusses processes, threads, synchronization mechanisms like semaphores and barriers, and concurrency issues like deadlock, starvation and livelock that can occur in multi-threaded programs.
The document discusses abstract data types (ADTs) and how they relate to implemented data types and data structures. Some key points:
1) An ADT is a theoretical model that defines the operations and objects of a data type, while an implemented data type realizes the ADT within the constraints of resources and implementation.
2) An ADT includes the name, possible data items, and operations on those items. Implemented data types and data structures then provide actual realizations within programming languages.
3) Common ADTs include stacks, with operations like push and pop following a last-in first-out ordering of elements. Stacks have implementations using arrays or linked lists.
Abstract classes and interfaces allow for abstraction and polymorphism in object-oriented design. Abstract classes can contain both abstract and concrete methods, while interfaces only contain abstract methods. Abstract classes are used to provide a common definition for subclasses through inheritance, while interfaces define a contract for implementing classes to follow. Both support polymorphism by allowing subclasses/implementing classes to determine the specific implementation for abstract methods.
This document discusses inheritance in object-oriented programming. It explains that inheritance allows a subclass to inherit attributes and behaviors from a superclass, extending the superclass. This allows for code reuse and the establishment of class hierarchies. The document provides an example of a BankAccount superclass and SavingsAccount subclass, demonstrating how the subclass inherits methods like deposit() and withdraw() from the superclass while adding its own method, addInterest(). It also discusses polymorphism and access control as related concepts.
The document provides information on three programming languages: COBOL, LISP, and Python. COBOL was released in 1959 and was used for 80% of business transactions due to its reliability. LISP was the second high-level language created in 1958 and introduced innovations like garbage collection and recursion using linked lists. Python was developed in the 1990s and prioritizes readability through features like whitespace and a simple grammar.
Object-oriented analysis and design (OOAD) emphasizes investigating requirements rather than solutions, and conceptual solutions that fulfill requirements rather than implementations. OOAD focuses on identifying domain concepts and defining software objects and how they collaborate. The document then discusses OO concepts like encapsulation, abstraction, inheritance, and polymorphism and how classes and objects are used in object-oriented programming. It provides an overview of the course structure and evaluation criteria.
"$10 thousand per minute of downtime: architecture, queues, streaming and fin...Fwdays
Â
Direct losses from downtime in 1 minute = $5-$10 thousand dollars. Reputation is priceless.
As part of the talk, we will consider the architectural strategies necessary for the development of highly loaded fintech solutions. We will focus on using queues and streaming to efficiently work and manage large amounts of data in real-time and to minimize latency.
We will focus special attention on the architectural patterns used in the design of the fintech system, microservices and event-driven architecture, which ensure scalability, fault tolerance, and consistency of the entire system.
Session 1 - Intro to Robotic Process Automation.pdfUiPathCommunity
Â
👉 Check out our full 'Africa Series - Automation Student Developers (EN)' page to register for the full program:
https://bit.ly/Automation_Student_Kickstart
In this session, we shall introduce you to the world of automation, the UiPath Platform, and guide you on how to install and setup UiPath Studio on your Windows PC.
đź“• Detailed agenda:
What is RPA? Benefits of RPA?
RPA Applications
The UiPath End-to-End Automation Platform
UiPath Studio CE Installation and Setup
đź’» Extra training through UiPath Academy:
Introduction to Automation
UiPath Business Automation Platform
Explore automation development with UiPath Studio
👉 Register here for our upcoming Session 2 on June 20: Introduction to UiPath Studio Fundamentals: https://community.uipath.com/events/details/uipath-lagos-presents-session-2-introduction-to-uipath-studio-fundamentals/
Northern Engraving | Nameplate Manufacturing Process - 2024Northern Engraving
Â
Manufacturing custom quality metal nameplates and badges involves several standard operations. Processes include sheet prep, lithography, screening, coating, punch press and inspection. All decoration is completed in the flat sheet with adhesive and tooling operations following. The possibilities for creating unique durable nameplates are endless. How will you create your brand identity? We can help!
In our second session, we shall learn all about the main features and fundamentals of UiPath Studio that enable us to use the building blocks for any automation project.
đź“• Detailed agenda:
Variables and Datatypes
Workflow Layouts
Arguments
Control Flows and Loops
Conditional Statements
đź’» Extra training through UiPath Academy:
Variables, Constants, and Arguments in Studio
Control Flow in Studio
"Scaling RAG Applications to serve millions of users", Kevin GoedeckeFwdays
Â
How we managed to grow and scale a RAG application from zero to thousands of users in 7 months. Lessons from technical challenges around managing high load for LLMs, RAGs and Vector databases.
This talk will cover ScyllaDB Architecture from the cluster-level view and zoom in on data distribution and internal node architecture. In the process, we will learn the secret sauce used to get ScyllaDB's high availability and superior performance. We will also touch on the upcoming changes to ScyllaDB architecture, moving to strongly consistent metadata and tablets.
What is an RPA CoE? Session 2 – CoE RolesDianaGray10
Â
In this session, we will review the players involved in the CoE and how each role impacts opportunities.
Topics covered:
• What roles are essential?
• What place in the automation journey does each role play?
Speaker:
Chris Bolin, Senior Intelligent Automation Architect Anika Systems
Northern Engraving | Modern Metal Trim, Nameplates and Appliance PanelsNorthern Engraving
Â
What began over 115 years ago as a supplier of precision gauges to the automotive industry has evolved into being an industry leader in the manufacture of product branding, automotive cockpit trim and decorative appliance trim. Value-added services include in-house Design, Engineering, Program Management, Test Lab and Tool Shops.
Discover top-tier mobile app development services, offering innovative solutions for iOS and Android. Enhance your business with custom, user-friendly mobile applications.
Main news related to the CCS TSI 2023 (2023/1695)Jakub Marek
Â
An English 🇬🇧 translation of a presentation to the speech I gave about the main changes brought by CCS TSI 2023 at the biggest Czech conference on Communications and signalling systems on Railways, which was held in Clarion Hotel Olomouc from 7th to 9th November 2023 (konferenceszt.cz). Attended by around 500 participants and 200 on-line followers.
The original Czech 🇨🇿 version of the presentation can be found here: https://www.slideshare.net/slideshow/hlavni-novinky-souvisejici-s-ccs-tsi-2023-2023-1695/269688092 .
The videorecording (in Czech) from the presentation is available here: https://youtu.be/WzjJWm4IyPk?si=SImb06tuXGb30BEH .
"NATO Hackathon Winner: AI-Powered Drug Search", Taras KlobaFwdays
Â
This is a session that details how PostgreSQL's features and Azure AI Services can be effectively used to significantly enhance the search functionality in any application.
In this session, we'll share insights on how we used PostgreSQL to facilitate precise searches across multiple fields in our mobile application. The techniques include using LIKE and ILIKE operators and integrating a trigram-based search to handle potential misspellings, thereby increasing the search accuracy.
We'll also discuss how the azure_ai extension on PostgreSQL databases in Azure and Azure AI Services were utilized to create vectors from user input, a feature beneficial when users wish to find specific items based on text prompts. While our application's case study involves a drug search, the techniques and principles shared in this session can be adapted to improve search functionality in a wide range of applications. Join us to learn how PostgreSQL and Azure AI can be harnessed to enhance your application's search capability.
In the realm of cybersecurity, offensive security practices act as a critical shield. By simulating real-world attacks in a controlled environment, these techniques expose vulnerabilities before malicious actors can exploit them. This proactive approach allows manufacturers to identify and fix weaknesses, significantly enhancing system security.
This presentation delves into the development of a system designed to mimic Galileo's Open Service signal using software-defined radio (SDR) technology. We'll begin with a foundational overview of both Global Navigation Satellite Systems (GNSS) and the intricacies of digital signal processing.
The presentation culminates in a live demonstration. We'll showcase the manipulation of Galileo's Open Service pilot signal, simulating an attack on various software and hardware systems. This practical demonstration serves to highlight the potential consequences of unaddressed vulnerabilities, emphasizing the importance of offensive security practices in safeguarding critical infrastructure.
Introduction of Cybersecurity with OSS at Code Europe 2024Hiroshi SHIBATA
Â
I develop the Ruby programming language, RubyGems, and Bundler, which are package managers for Ruby. Today, I will introduce how to enhance the security of your application using open-source software (OSS) examples from Ruby and RubyGems.
The first topic is CVE (Common Vulnerabilities and Exposures). I have published CVEs many times. But what exactly is a CVE? I'll provide a basic understanding of CVEs and explain how to detect and handle vulnerabilities in OSS.
Next, let's discuss package managers. Package managers play a critical role in the OSS ecosystem. I'll explain how to manage library dependencies in your application.
I'll share insights into how the Ruby and RubyGems core team works to keep our ecosystem safe. By the end of this talk, you'll have a better understanding of how to safeguard your code.
Connector Corner: Seamlessly power UiPath Apps, GenAI with prebuilt connectorsDianaGray10
Â
Join us to learn how UiPath Apps can directly and easily interact with prebuilt connectors via Integration Service--including Salesforce, ServiceNow, Open GenAI, and more.
The best part is you can achieve this without building a custom workflow! Say goodbye to the hassle of using separate automations to call APIs. By seamlessly integrating within App Studio, you can now easily streamline your workflow, while gaining direct access to our Connector Catalog of popular applications.
We’ll discuss and demo the benefits of UiPath Apps and connectors including:
Creating a compelling user experience for any software, without the limitations of APIs.
Accelerating the app creation process, saving time and effort
Enjoying high-performance CRUD (create, read, update, delete) operations, for
seamless data management.
Speakers:
Russell Alfeche, Technology Leader, RPA at qBotic and UiPath MVP
Charlie Greenberg, host
High performance Serverless Java on AWS- GoTo Amsterdam 2024Vadym Kazulkin
Â
Java is for many years one of the most popular programming languages, but it used to have hard times in the Serverless community. Java is known for its high cold start times and high memory footprint, comparing to other programming languages like Node.js and Python. In this talk I'll look at the general best practices and techniques we can use to decrease memory consumption, cold start times for Java Serverless development on AWS including GraalVM (Native Image) and AWS own offering SnapStart based on Firecracker microVM snapshot and restore and CRaC (Coordinated Restore at Checkpoint) runtime hooks. I'll also provide a lot of benchmarking on Lambda functions trying out various deployment package sizes, Lambda memory settings, Java compilation options and HTTP (a)synchronous clients and measure their impact on cold and warm start times.
High performance Serverless Java on AWS- GoTo Amsterdam 2024
Â
Text classification methods
1. Chapter 6
Three Simple Classification
Methods
The NaĂŻve Rule
NaĂŻve Bayes
k-Nearest Neighbor
1
2. Introduction
• Naïve Rule used to set up Naïve Bayes & k-NN
• Naïve Bayes & k-NN used in practice
• Data driven methods
• Naïve Bayes uses categorical predictors
• k-NN may be used with continuous predictors
• Illustrate with three examples:
– Example 1: Predicting Fraudulent Financial Reporting
• Uses Categorical predictors
– Example 2: Predicting Delayed Flights
• Uses Categorical Predictors
– Example 3: Riding Mowers
• Uses Continuous Predictors
2
3. Predicting Fraudulent Financial Reporting
• To avoid being involved in any legal charges against it, the firm wants to
detect whether a company submitted a fraudulent financial report .
• In this case each company (customer) is a record, and the response of
interest, Y = {fraudulent; truthful}, has two classes that a company can be
classified into: C1=fraudulent and C2=truthful.
• The only other piece of information that the auditing firm has on its
customers is whether or not legal charges were filed against them.
• The firm would like to use this information to improve its estimates of
fraud.
• Thus “X=legal charges" is a single (categorical) predictor with two
categories: whether legal charges were filed (1) or not (0).
3
4. • 1500 companies
• Partition into 1000 training set & 500 validation set
• Counts from training below
Predicting Fraudulent Financial Reporting
4
5. Predicting Delayed Flights
• The outcome of interest is whether the flight is delayed or not (delayed means
arrive more than 15 minutes late).
• Our data consist of all flights from the Washington, DC area into the New York City
area during January 2004.
• The percent of delayed flights among these 2346 flights is 18%
• Six predictors listed below
• Predict if a new flight will be delayed – two classes
• 1 = “Delayed” and 0 = “On Time”
5
6. The Naive Rule
• Classify everything as belonging to the most prevalent class
• Classifying a record into one of m classes, ignoring all predictor information
(X1,X2,…,Xp) that we may have, is to classify the record as a member of the
majority class.
• In the auditing example the naive rule would classify all customers as being
truthful, because 90% of the investigated companies in the training set were
found to be truthful.
• Similarly, all flights would be classified as being on-time, because the
majority of the flights in the dataset (82%) were not delayed.
6
7. Naive Bayes
• More sophisticated method than the naive rule.
• The main idea is to integrate the information given in a set of predictors
into the Naive Rule to obtain more accurate classifications.
• The probability of a record belonging to a certain class is now evaluated
– Based on the prevalence of that class
– And on the additional information that is given on that record in term of its X
information.
• Naive Bayes works only with predictors that are categorical.
– Numerical predictors must be binned and converted to categorical variables
before the Naive Bayes classifier can use them.
• The Naive Bayes method is very useful when very large datasets are
available.
– For instance, web-search companies like Google use naive Bayes classifiers to correct
misspellings that users type in. When you type a phrase that includes a misspelled word
into Google it suggests a spelling correction for the phrase. The suggestion(s) are based
on information not only on the frequencies of similarly-spelled words that were typed
by millions of other users, but also on the other words in the phrase.
7
8. Conditional Probabilities
• Classification Task
– Estimate the probability of membership in each class given
a certain set of predictor variables
• This type of probability is called “conditional
probability”
• A conditional probability of event A given event B
(denoted by P(A|B)) represents the chances of event
A occurring only under the scenario that event B
occurs.
• In the auditing example we are interested in
– P(fraudulent financial report | legal charges)
8
9. • To classify a record, we compute its chance of belonging to
each of the classes by computing P(Ci|X1,…,Xp) for each class
i. We then classify the record to the class that has the
highest probability
• Since conditioning on an event means that we have
additional information (e.g., we know that legal charges
were filed against them), uncertainty is reduced
• In auditing example column headings are used as
predictors for classification probabilities
– Column sums are sample size used to compute probabilities
– P(fraudulent financial report | legal charges)
• 50/232
– P(fraudulent financial report | no legal charges)
• 50/770
9
Conditional Probabilities
10. A Practical Difficulty
• For N predictors and M classes training set
may need to be very large.
• To “fill in” the M X N table so that we can
compute the conditional probabilities would
require a large number cases to avoid entries
of zero (no instances of cases of in the table)
• Apples & Oranges Example
10
11. A Solution: Naive Bayes
• A solution that has been widely used is based on making the
simplifying assumption of predictor independence. If it is
reasonable to assume that the predictors are all mutually
independent within each class,
• Simplify the expression making it useful in practice
• Independence of the predictors within each class gives us the
following simplification
– follows from the product rule for probabilities of independent events
(the probability of occurrence of multiple events is the product of the
probabilities of the individual event occurrences):
– P(X1,X2, …,Xm|Ci) = P(X1|Ci)P(X2|Ci)P(X3|Ci) ,…,P(Xm|Ci)
• The terms on the right are estimated from frequency counts in the
training data, with the estimate of P(Xj|Ci) being equal to the
number of occurrences of the value xj in class Ci divided by the total
number of records in that class
• Example pgs. 97-98 (or pgs. 91-92 earlier edition) demonstrate
– P(X1,X2, …,Xm|Ci) approximates P(Ci|X1,…,Xp)
– Assuming a classification cutoff of 0.5
11
14. Evaluation of the Model
• To evaluate the performance of the naive Bayes classifier for our
data, we use
– the classification matrix,
– lift charts,
– And measures described in Chapter 4.
• The classification matrices for the training and validation sets are
shown
• The overall error level is around 18% for both the training and
validation data
• A naive rule which would classify all 880 flights in the validation set
as on-time
• missed the 172 delayed flights resulting in a 20% error level.
• The Naive Bayes is only slightly less accurate.
• The lift chart shows the strength of the Naive Bayes in capturing
the delayed flights well.
14
18. Evaluation of Naive Bayes Classifier
• The Naive Bayes classifier's advantages are in its
– simplicity, computational efficiency, and its good classification
performance.
– it often outperforms more sophisticated classifiers even when the
underlying assumption of independent predictors is far from true.
– This advantage is especially pronounced when the number of
predictors is very large.
18
19. • There are three main issues that should be kept in mind however.
– First, the Naive Bayes classifier requires a very large number of records to
obtain good results.
– Second, where a predictor category is not present in the training data, Naive
Bayes assumes that a new record with that category of the predictor has zero
probability.
• This can be a problem if this rare predictor value is important.
• For example, assume the target variable is “bought high value life insurance" and a
predictor category is “own yacht". If the training data have no records with “owns
yacht"=1, for any new records where “owns yacht"=1, Naive Bayes will assign a
probability of 0 to the target variable “bought high value life insurance".
• With no training records with ”owns yacht"=1, of course, no data mining technique
will be able to incorporate this potentially important variable into the classification
model - it will be ignored.
• With Naive Bayes, however, the absence of this predictor actively “outvotes" any
other information in the record to assign a 0 to the target value (when, in this case,
it has a relatively good chance of being a 1).
• The presence of a large training set (and judicious binning of continuous variables,
if required) help mitigate this effect.
19
Evaluation of Naive Bayes Classifier
20. • Finally, the good performance is obtained when the goal is classification
or ranking of records according to their probability of belonging to a
certain class.
• However, when the goal is to actually estimate the probability of class
membership, this method provides very biased results.
– For this reason the Naive Bayes method is rarely used in credit scoring.
20
Evaluation of Naive Bayes Classifier
22. k-Nearest Neighbors (k-NN)
• The idea in k-Nearest Neighbor methods is to identify k
observations in the training dataset that are similar to a new
record that we wish to classify.
• We then use these similar (neighboring) records to classify the
new record into a class, assigning the new record to the
predominant class among these neighbors.
• Denote by (x1, x2,…,xp) the values of the predictors for this new
record.
• We look for records in our training data that are similar or “near"
to the record to be classified in the predictor space, i.e., records
that have values close to x1, x2,…,xp.
• Then, based on the classes to which those proximate records
belong, we assign a class to the record that we want to classify.
22
23. k-Nearest Neighbors (k-NN)
• The k-Nearest Neighbor algorithm is a classification
method that does not make assumptions about the
form of the relationship between the class
membership (Y ) and the predictors x1, x2,…,xp.
• This is a non-parametric method because it does not
involve estimation of parameters in an assumed
function form such as the linear form that we
encountered in linear regression.
• This method draws information from similarities
between the predictor values of the records in the data
set.
23
24. k-Nearest Neighbors (k-NN)
• The central issue here is how to measure the distance between records
based on their predictor values.
• The most popular measure of distance is the Euclidean distance.
• The Euclidean distance between two records x1, x2,…,xpand u1, u2,…,up is
• For simplicity, we continue here only with the Euclidean distance, but you
will find a host of other distance metrics in Chapters 12 (Cluster Analysis)
and 10 (Discriminant Analysis) for both numerical and categorical
variables.
• In most cases predictors should first be standardized before computing
Euclidean distance, to equalize the scales that the difierent predictors
may have.
24
25. k-Nearest Neighbors (k-NN)
• After computing the distances between the record to be classified and
existing records, we need a rule to assign a class to the record to be
classified, based on the classes of its neighbors.
• The simplest case is k = 1 where we look for the record that is closest (the
nearest neighbor) to classify the new record as belonging to the same
class as its closest neighbor.
• This intuitive idea of using a single nearest neighbor to classify records can
be very powerful when we have a large number of records in our training
set.
• It is possible to prove that the misclassification error of the 1-Nearest
Neighbor scheme has a misclassification rate that is no more than twice
the error when we know exactly the probability density functions for
each class.
25
26. k-Nearest Neighbors (k-NN)
• The idea of the 1-Nearest Neighbor can be extended
to k > 1 neighbors as follows:
– 1. Find the nearest k neighbors to the record to be
classified
– 2. Use a majority decision rule to classify the record,
where the record is classified as a member of the majority
class of the k neighbors.
26
27. Riding Mowers
• A riding-mower manufacturer would like to find a way of classifying
families in a city into those likely to purchase a riding mower and those
not likely to buy one.
• A pilot random sample of 12 owners and 12 non-owners in the city is
undertaken. The data are shown and plotted in the table on the next
slide.
• We first partition the data into training data (18 households) and
validation data (6 households).
• Obviously this dataset is too small for partitioning, but we continue with
this for illustration purposes.
• The data set is shown on the next slide.
27
29. Riding Mowers
• Consider a new household with $60,000 income and lot size 20,000 ft.
The train set is shown on the next slide.
• Among the households in the training set, the closest one to the new
household (in Euclidean distance after normalizing income and lot size) is
household #4, with $61,500 income and lot size 20,800 ft.
• If we use a 1-NN classifier, we would classify the new household as an
owner, like household #4.
• If we use k = 3, then the three nearest households are #4, #9, and #14.
• The first two are owners of riding mowers, and the last is a non-owner.
• The majority vote is therefore “owner", and the new household would be
classified as an owner. 29
31. Choosing k
• The advantage of choosing k > 1 is that higher values of k provide
smoothing that reduces the risk of overfitting due to noise in the training
data.
• Generally speaking, if k is too low, we may be fitting to the noise in the
data.
• However, if k is too high, we will miss out on the method's ability to
capture the local structure in the data, one of its main advantages.
• In the extreme, k = n = the number of records in the training dataset.
– In that case we simply assign all records to the majority class in the training
data irrespective of the values of (x1, x2,…,xp), which coincides with the Naive
Rule!
31
32. Choosing k
• K = n is clearly a case of over-smoothing in the absence of useful
information in the predictors about the class membership.
• In other words, we want to balance between overfitting to the predictor
information and ignoring this information completely.
• A balanced choice depends on the nature of the data.
• The more complex and irregular the structure of the data, the lower the
optimum value of k.
• Typically, values of k fall in the range between 1 and 20.
• Often an odd number is chosen, to avoid ties.
32
33. Choosing k
• So how is k chosen?
– Answer: we choose that k which has the best classification performance.
• We use the training data to classify the records in the validation data,
then compute error rates for various choices of k.
• For our example, if we choose k = 1 we will classify in a way that is very
sensitive to the local characteristics of the training data.
• If we choose a large value of k such as k = 18 we would simply predict the
most frequent class in the dataset in all cases.
• This is a very stable prediction but it completely ignores the information in
the predictors.
33
34. • To find a balance we examine the misclassification rate (of the validation
set) that results for different choices of k between 1-18.
• This is shown on a previous slide. We would choose k = 8, which
minimizes the misclassification rate in the validation set.
• Now the validation set is used as an addition to the training set and does
not reflect a “hold-out" set as before.
• We need a third test set to evaluate the performance of the method on
data that it did not see.
34
Choosing k
35. k-NN for a Quantitative Response
(Continuous Response Variable)
• The idea of k-NN can be readily extended to predicting a continuous value
• Instead of taking a majority vote of the neighbors to determine class, we
take the average response value of the k nearest neighbors to determine
the prediction.
• Often this average is a weighted average with the weight decreasing with
increasing distance from the point at which the prediction is required.
35
36. Evaluation of k-NN Algorithms
• The main advantage of k-NN methods is their simplicity and lack of
parametric assumptions.
• In the presence of a large enough training set, these methods perform
surprisingly well, especially when each class is characterized by multiple
combinations of predictor values.
• For instance, in the flight delays example there are likely to be multiple
combinations of carrier-destination-arrival-time etc. that characterize
delayed flights vs. on-time flights.
36
37. Evaluation of k-NN Algorithms
• While there is no time required to estimate parameters from the training
data (as would be the case for parametric models such as regression), the
time to find the nearest neighbors in a large training set can be
prohibitive.
• A number of ideas have been implemented to overcome this difficulty.
• The main ideas are:
– Reduce the time taken to compute distances by working in a reduced
dimension using dimension reduction techniques such as principal
components analysis (Chapter 3).
– Use sophisticated data structures such as search trees to speed up
identification of the nearest neighbor. This approach often settles for an
“almost nearest" neighbor to improve speed.
– Edit the training data to remove redundant or “almost redundant" points to
speed up the search for the nearest neighbor.
• An example is to remove records in the training set that have no effect on the classification
because they are surrounded by records that all belong to the same class.
37
38. Evaluation of k-NN Algorithms
• The number of records required in the training set to qualify as large
increases exponentially with the number of predictors p.
• This is because the expected distance to the nearest neighbor goes up
dramatically with p unless the size of the training set increases
exponentially with p.
– This phenomenon is knows as “the curse of dimensionality".
– The curse of dimensionality is a fundamental issue pertinent to all
classification, prediction and clustering techniques.
• We often seek to reduce the dimensionality of the space of predictor
variables through methods
– such as selecting subsets of the predictors for our model or
– by combining them using methods such as principal components
analysis, singular value decomposition, and factor analysis.
• In the artificial intelligence literature dimension reduction is often
referred to as factor selection or feature extraction. 38