Download as PDF, PPTX
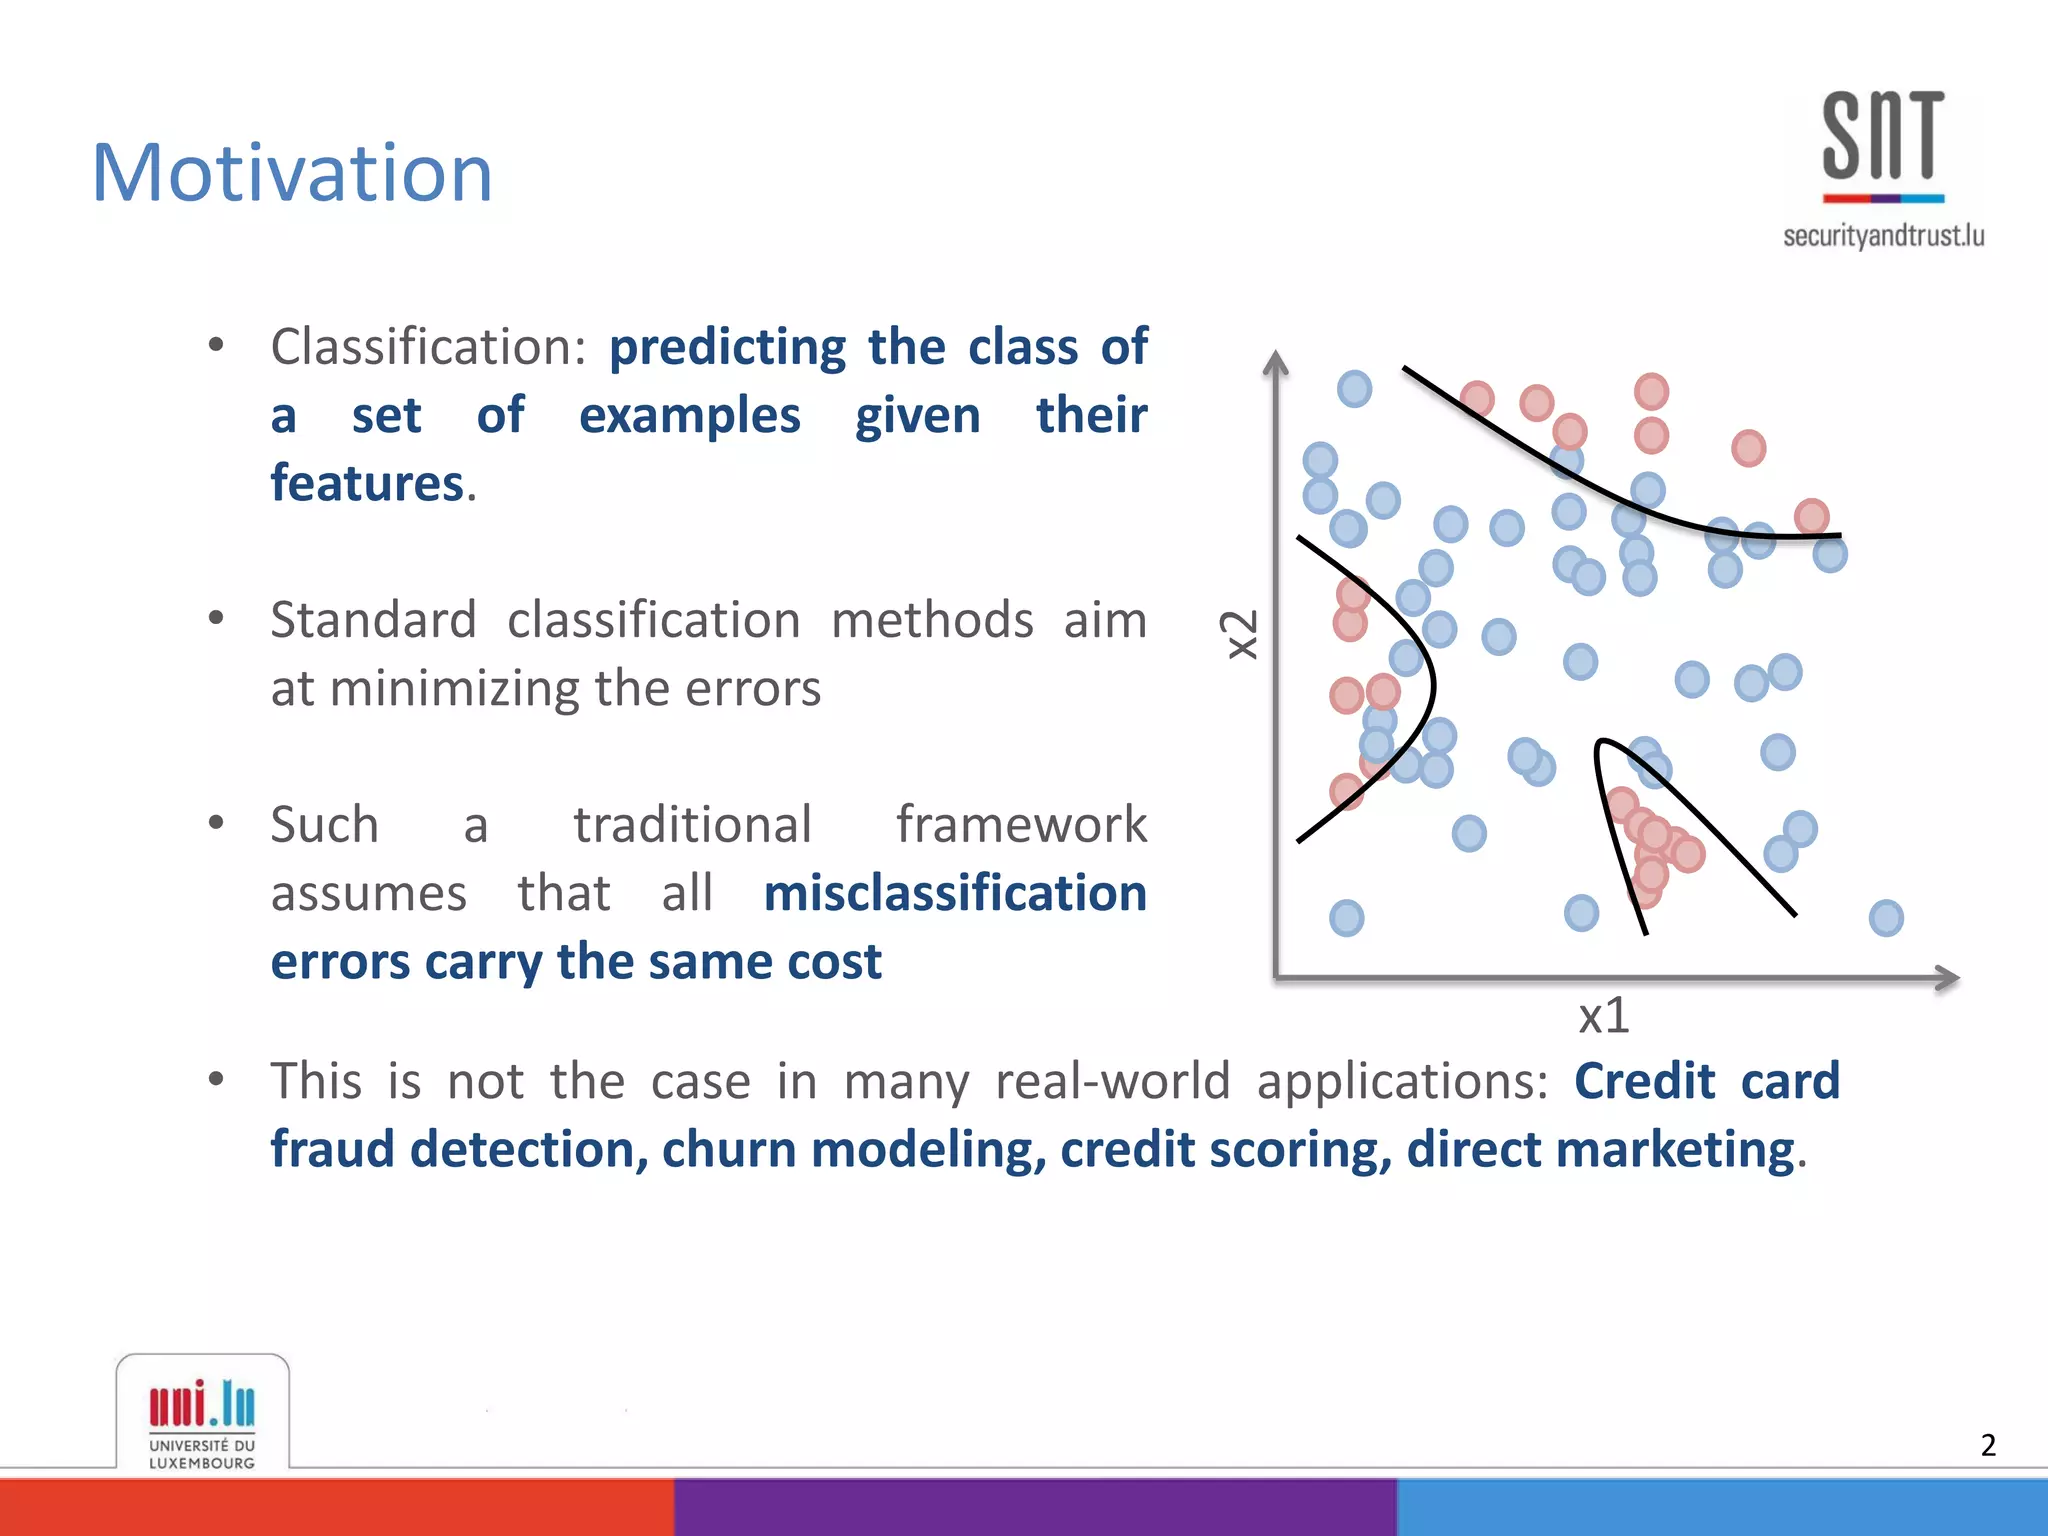
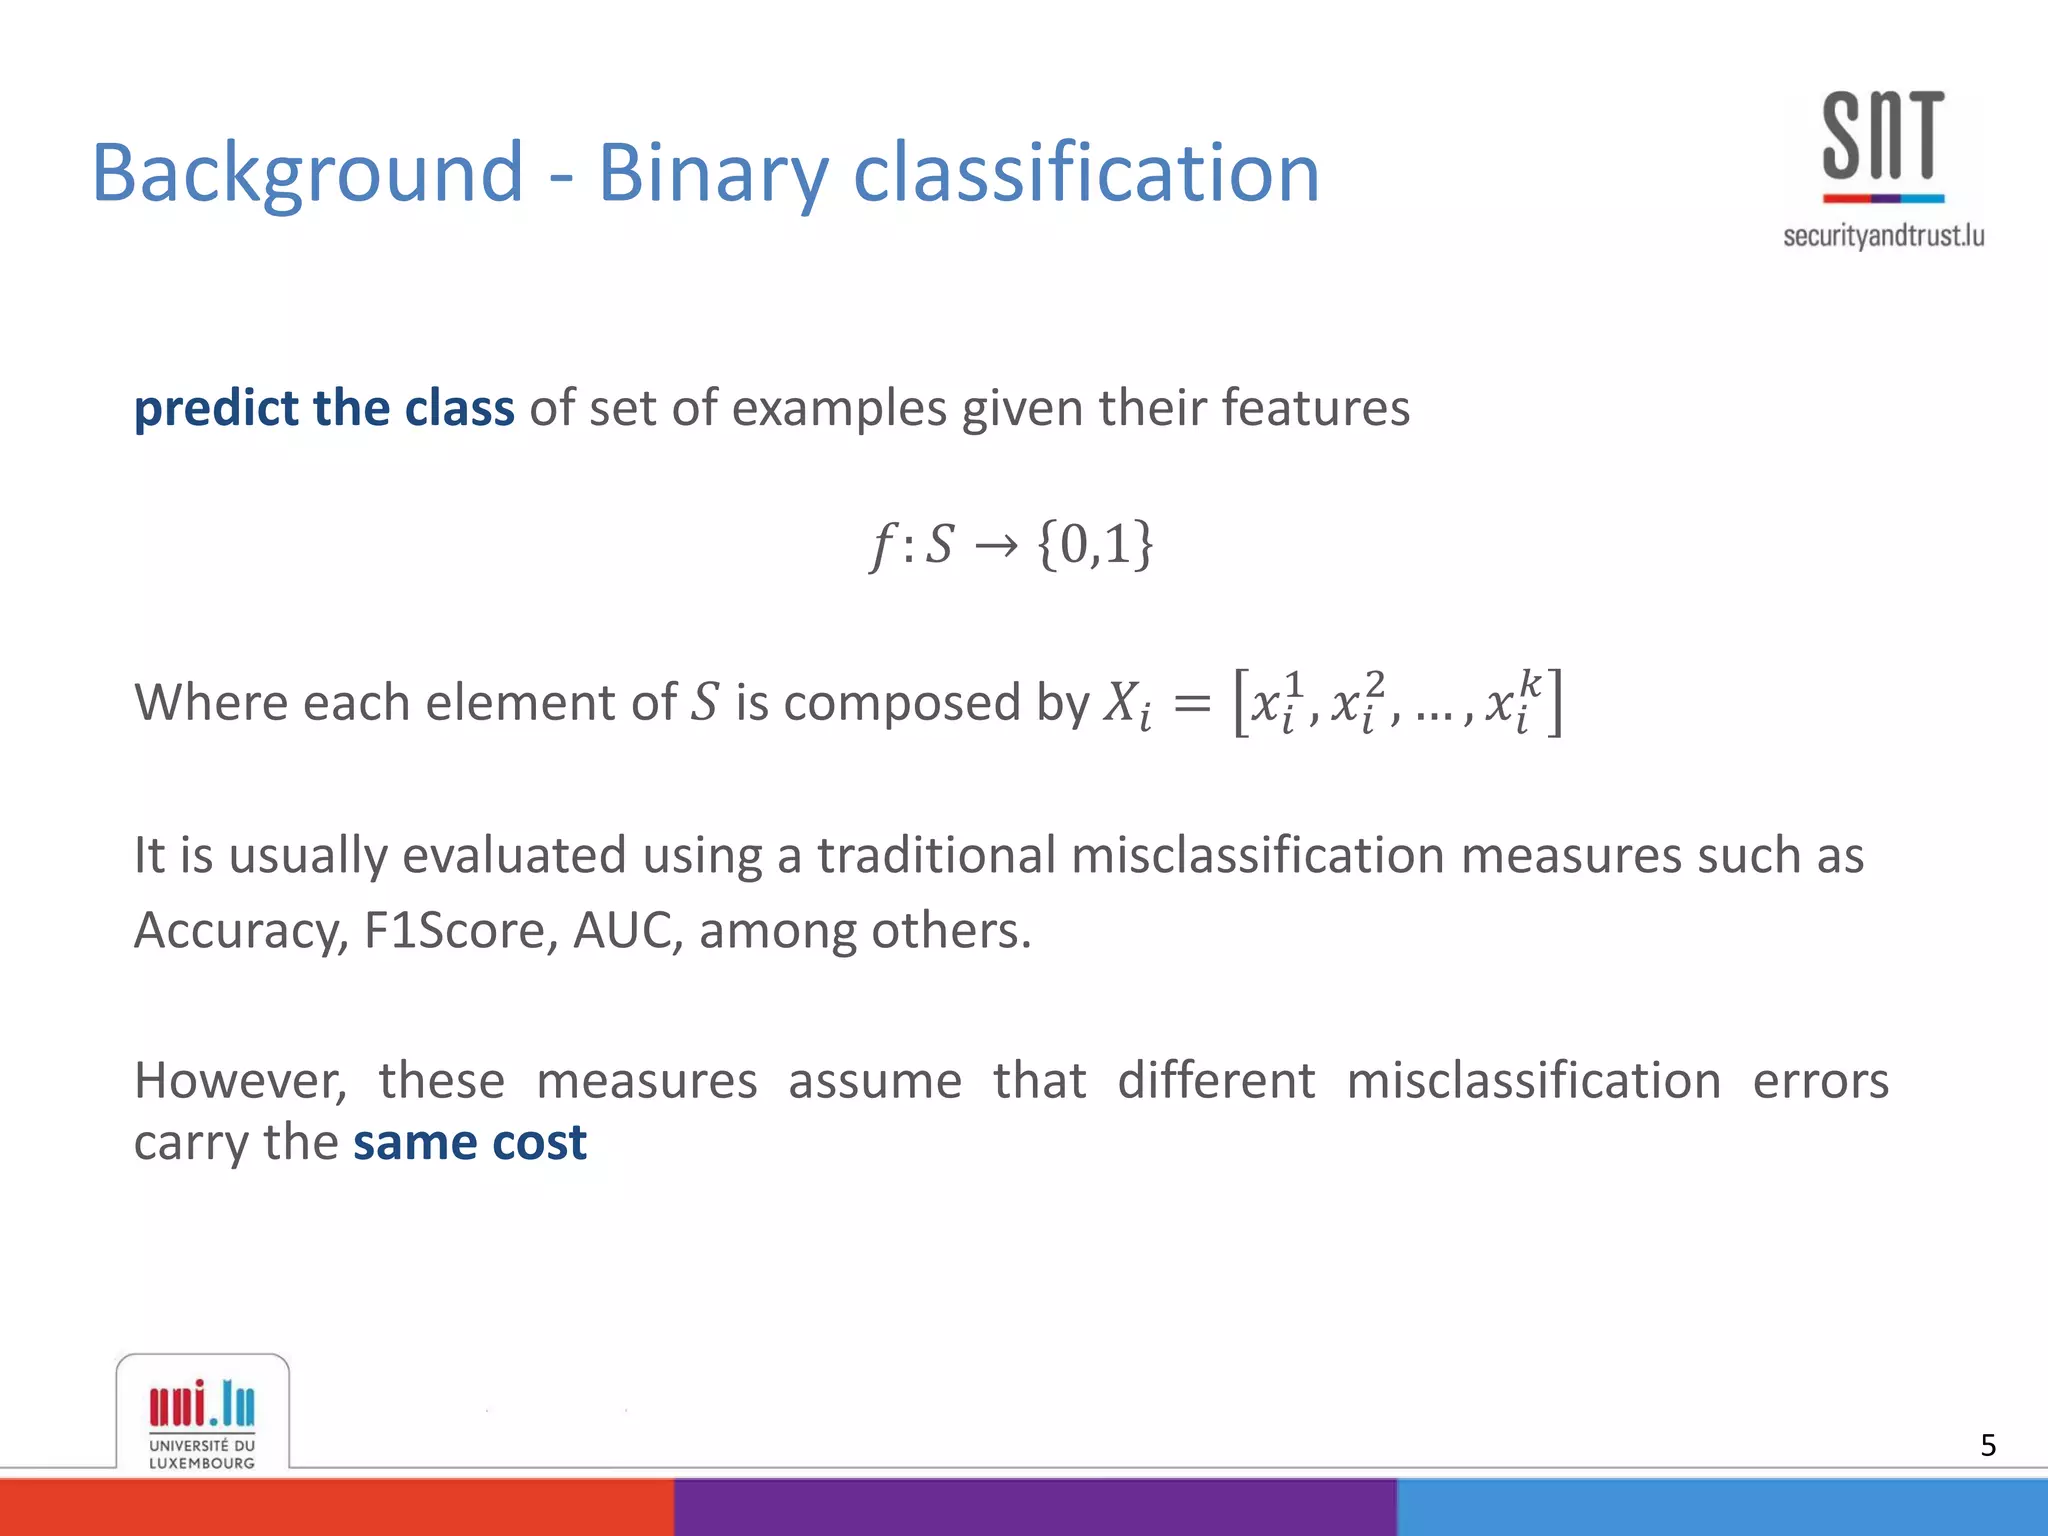
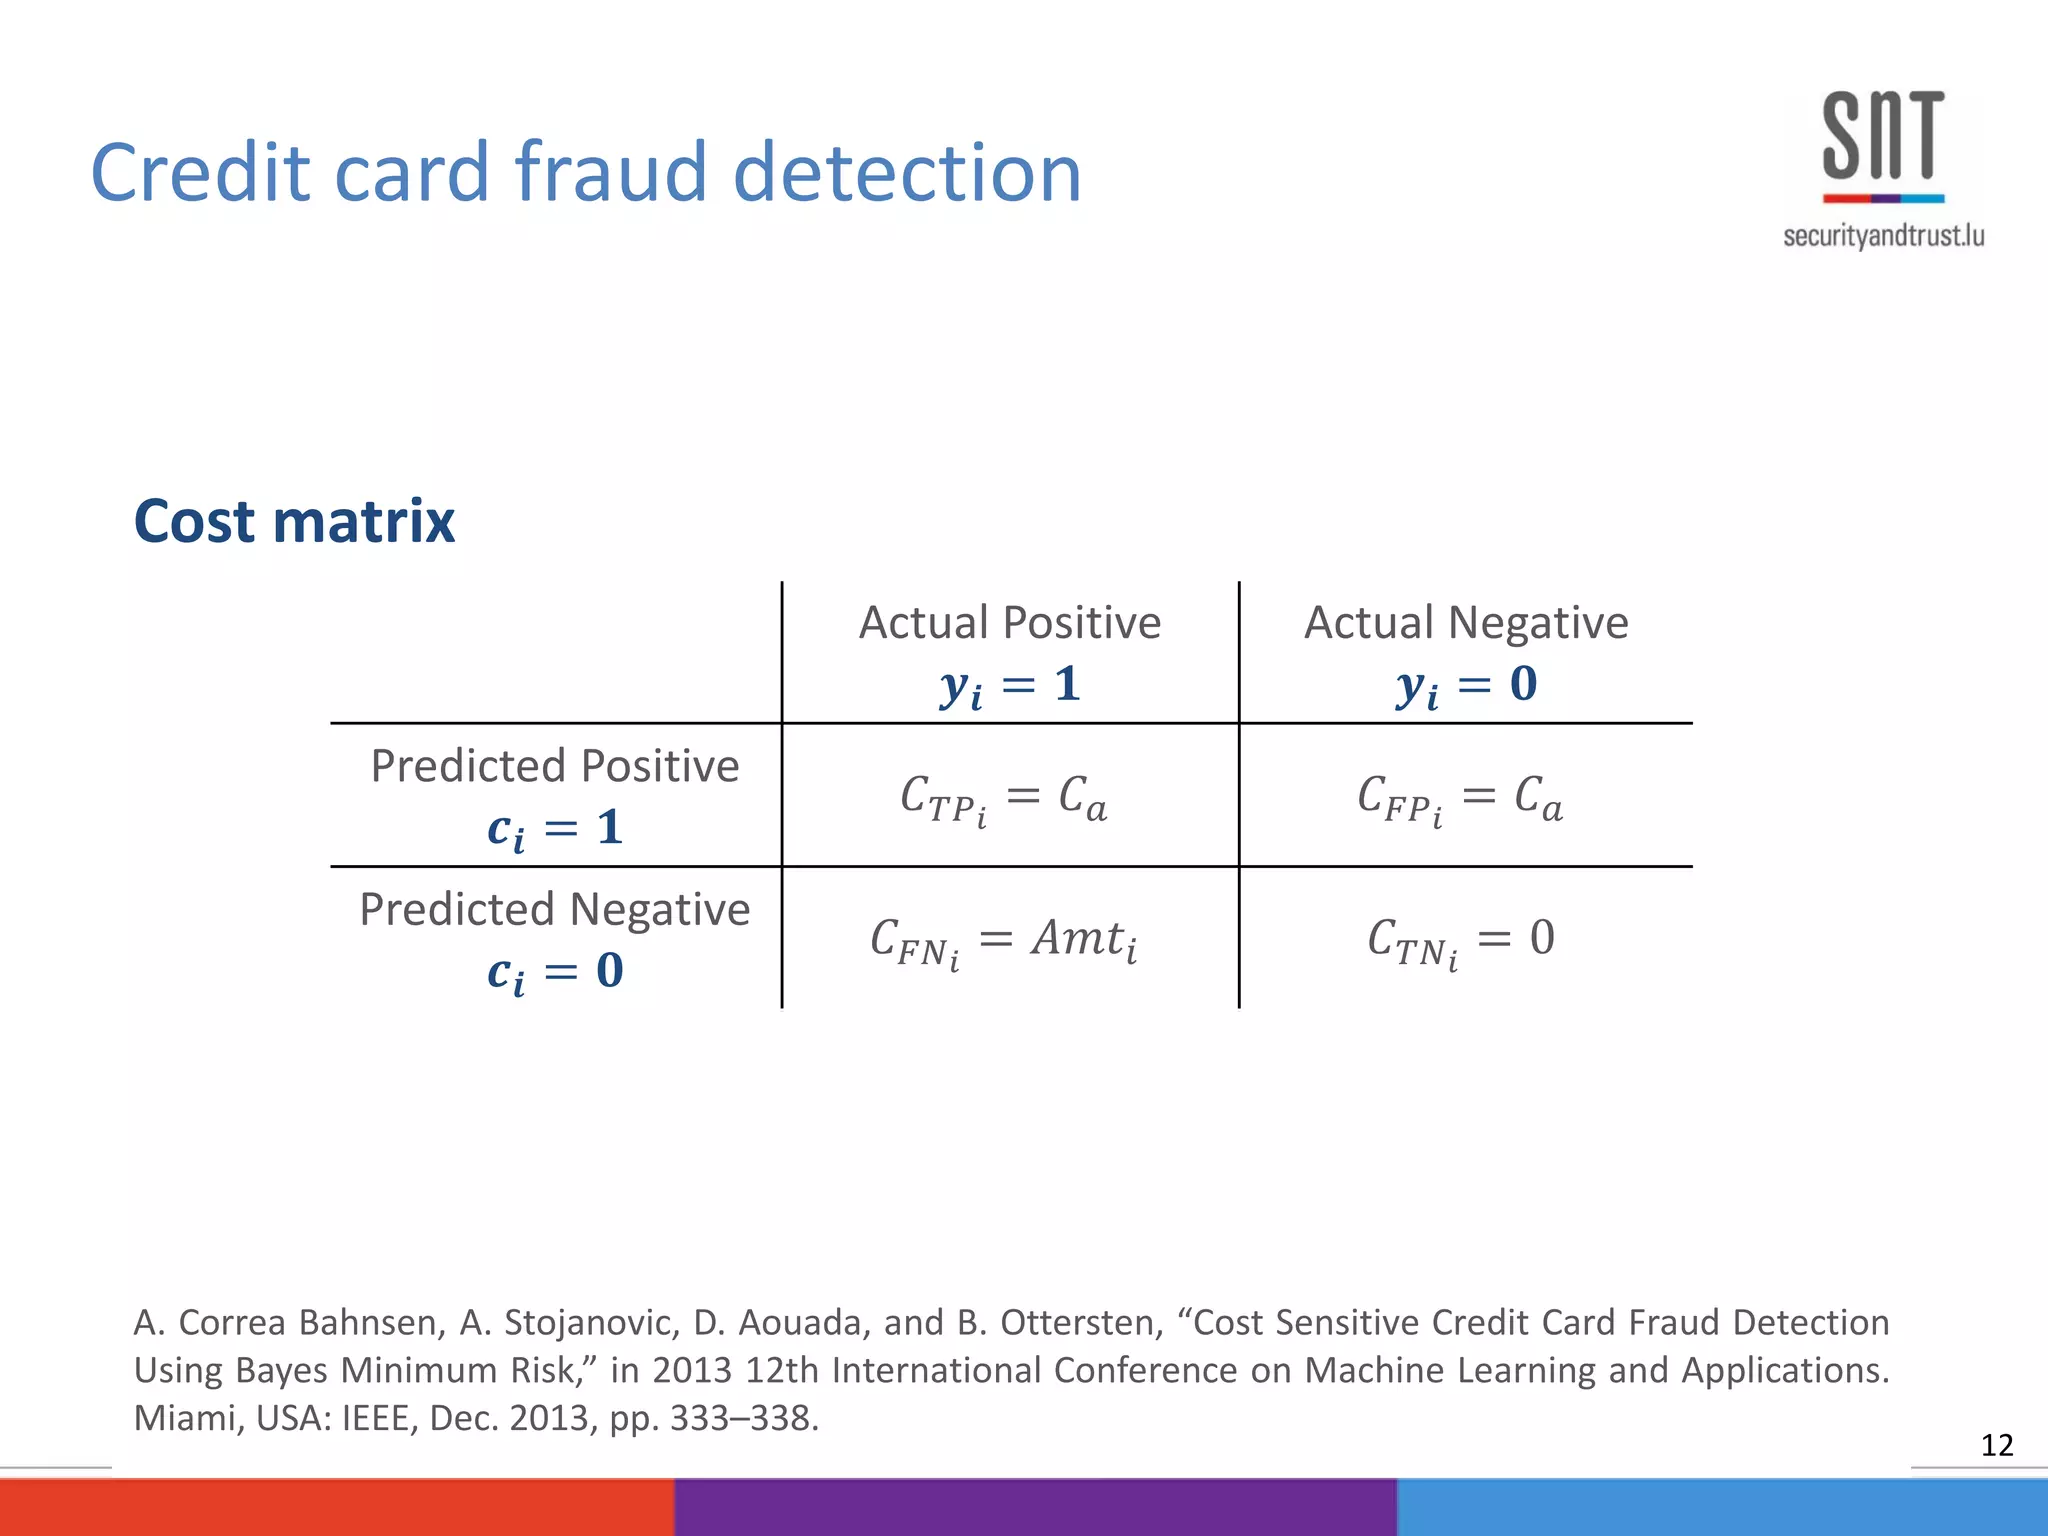
![We define a cost measure based on the cost matrix [Elkan 2001]
From which we calculate the 𝑪𝒐𝒔𝒕 of applying a classifier to a given set
𝐶𝑜𝑠𝑡 𝑓 𝑆 =
𝑖=1
𝑁
𝑦𝑖 𝑐𝑖 𝐶 𝑇𝑃 𝑖
+ 1 − 𝑐𝑖 𝐶 𝐹𝑁 𝑖
+ 1 − 𝑦𝑖 𝑐𝑖 𝐶 𝐹𝑃 𝑖
+ 1 − 𝑐𝑖 𝐶 𝑇𝑁 𝑖
Background - Cost-sensitive evaluation
6
Actual Positive
𝒚𝒊 = 𝟏
Actual Negative
𝒚𝒊 = 𝟎
Predicted Positive
𝒄𝒊 = 𝟏
𝐶 𝑇𝑃 𝑖
𝐶 𝐹𝑃 𝑖
Predicted Negative
𝒄𝒊 = 𝟎
𝐶 𝐹𝑁 𝑖
𝐶 𝑇𝑁 𝑖](https://image.slidesharecdn.com/thesisexampledependentcostsensitiveclassificationslides-150923041551-lva1-app6892/75/PhD-Defense-Example-Dependent-Cost-Sensitive-Classification-6-2048.jpg)
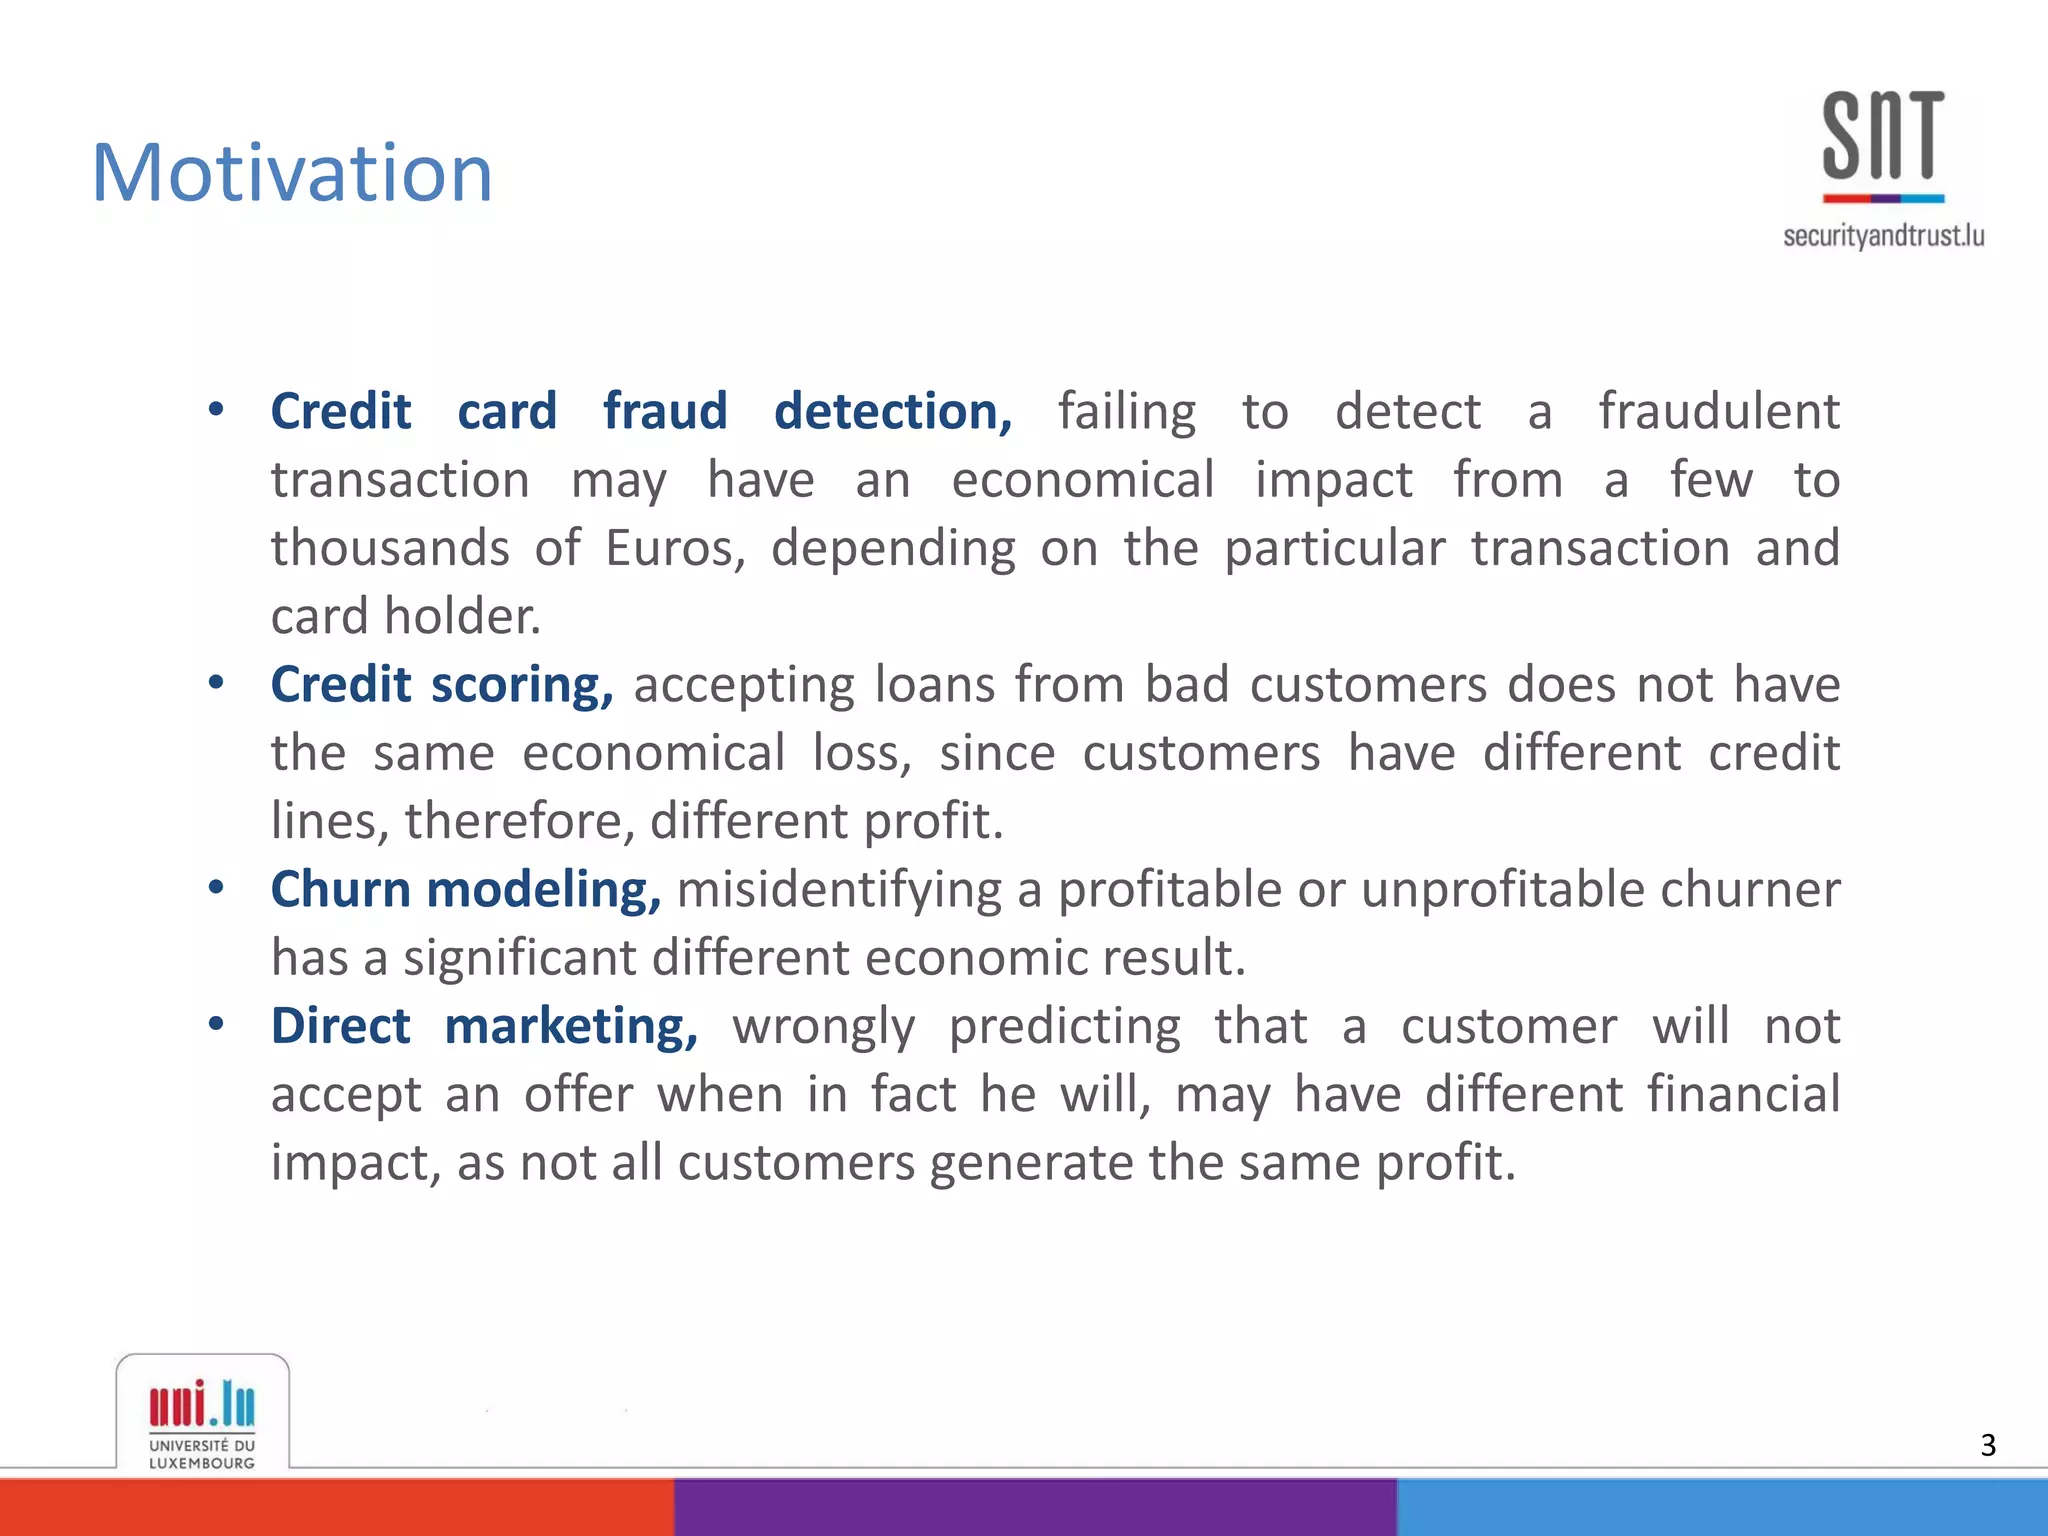
![Research in example-dependent cost-sensitive classification has been
narrow, mostly because of the lack of publicly available datasets [Aodha
and Brostow 2013].
Standard approaches consist in re-weighting the training examples based
on their costs:
• Cost-proportionate rejection sampling [Zadrozny et al. 2003]
• Cost-proportionate oversampling [Elkan 2001]
Background - State-of-the-art methods
8](https://image.slidesharecdn.com/thesisexampledependentcostsensitiveclassificationslides-150923041551-lva1-app6892/75/PhD-Defense-Example-Dependent-Cost-Sensitive-Classification-8-2048.jpg)
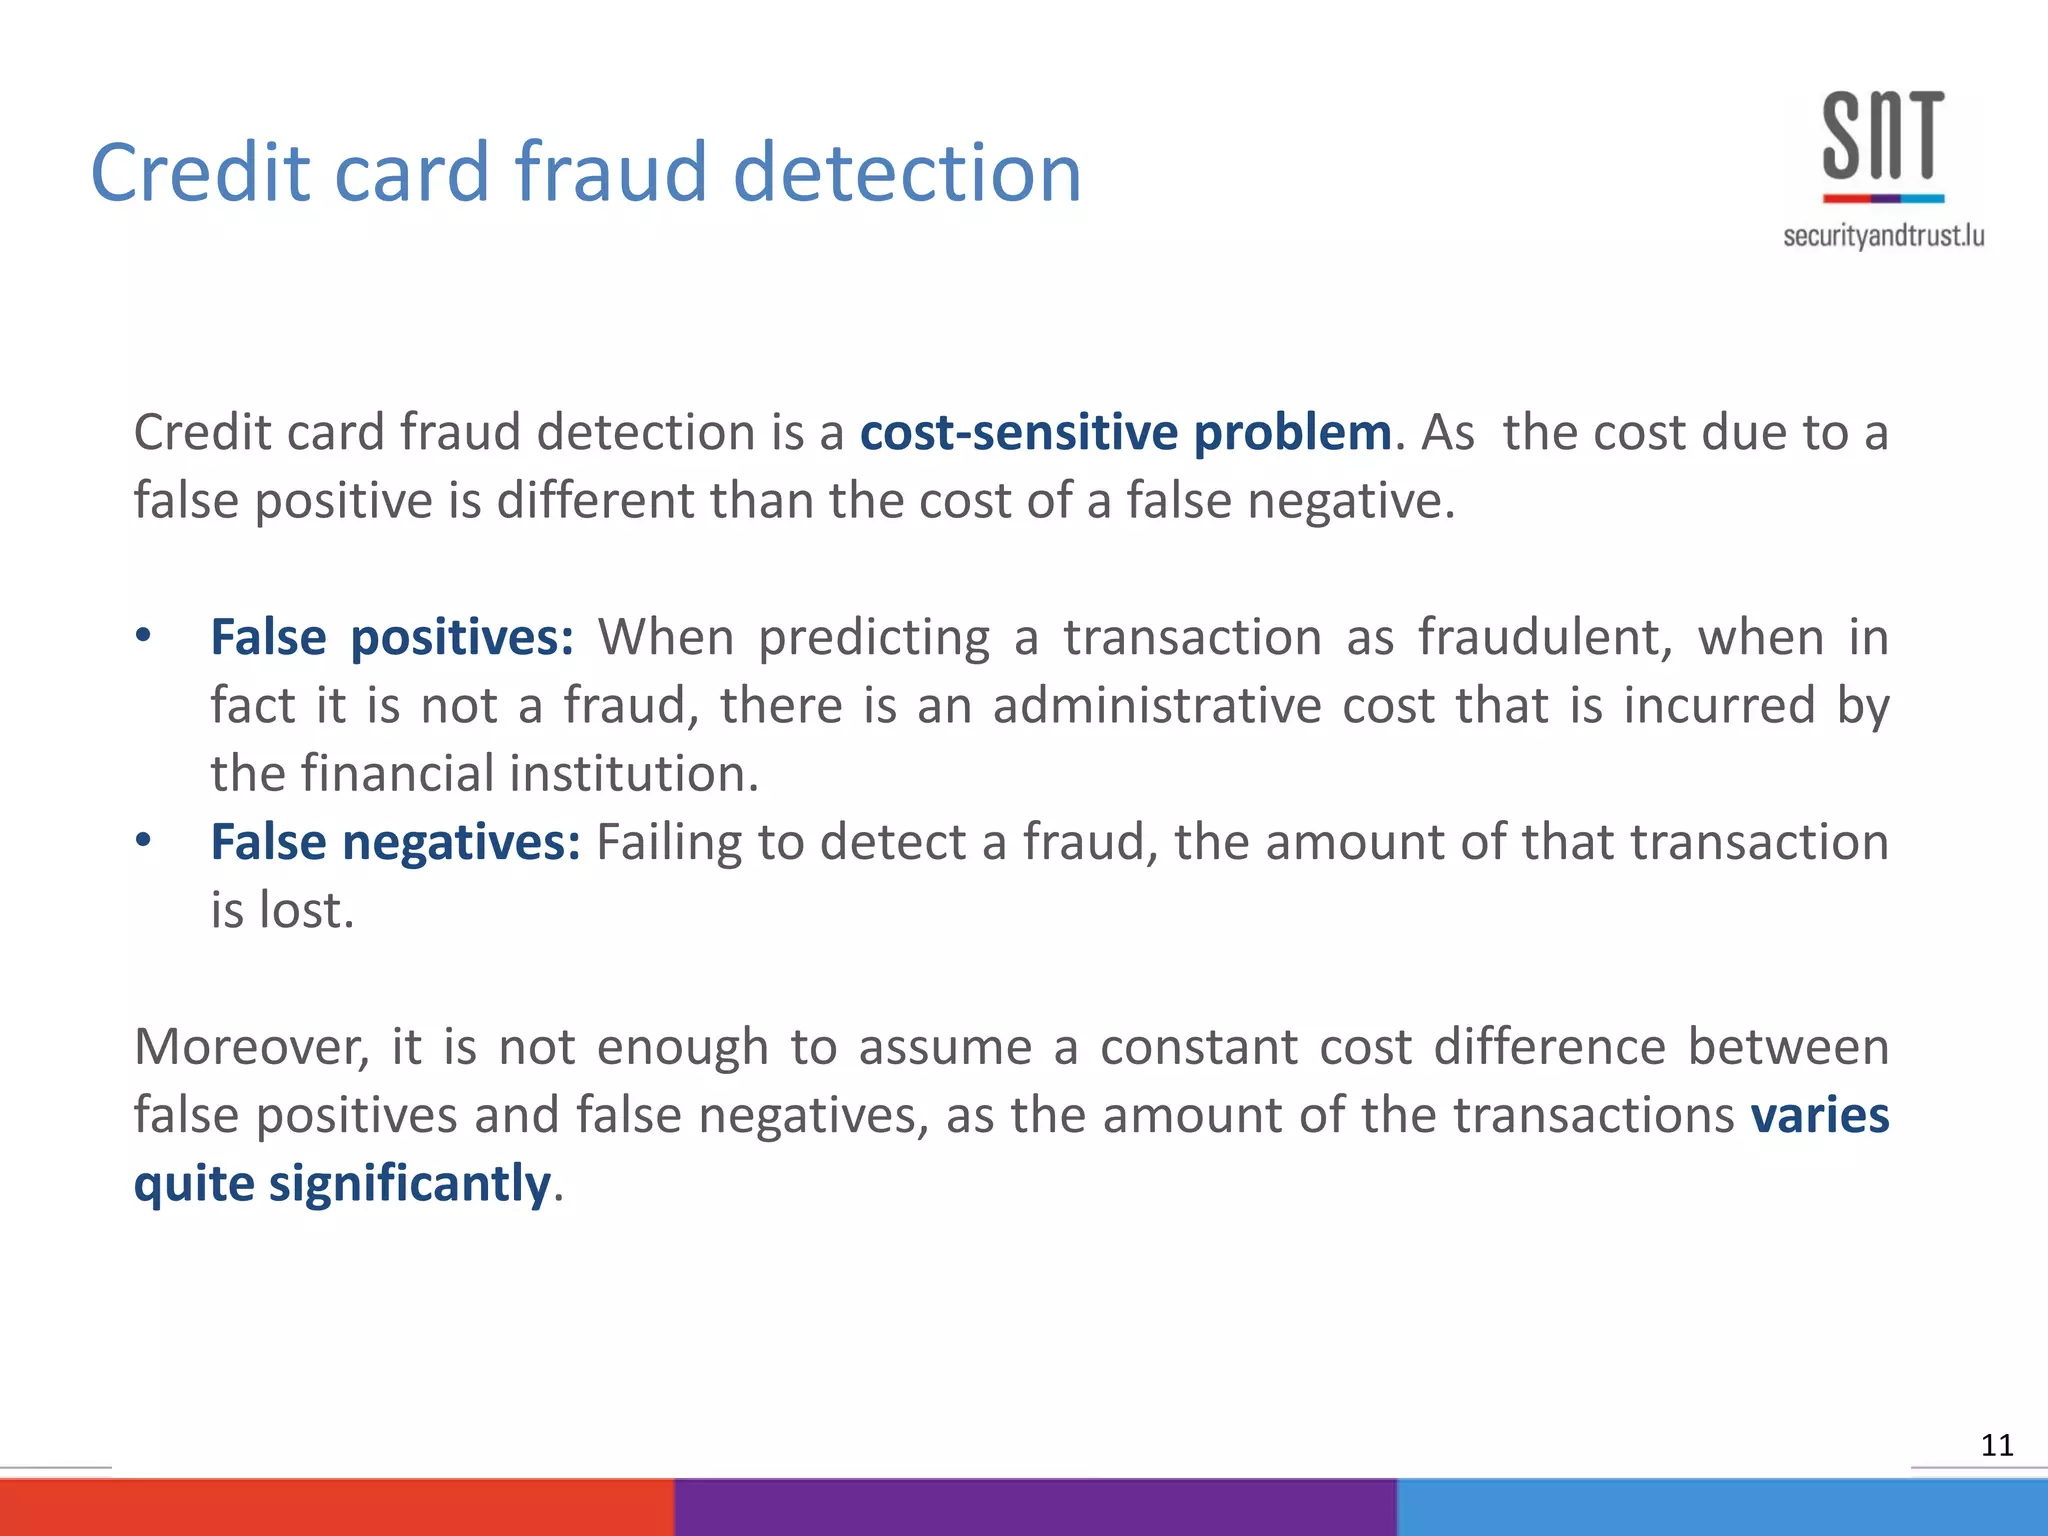
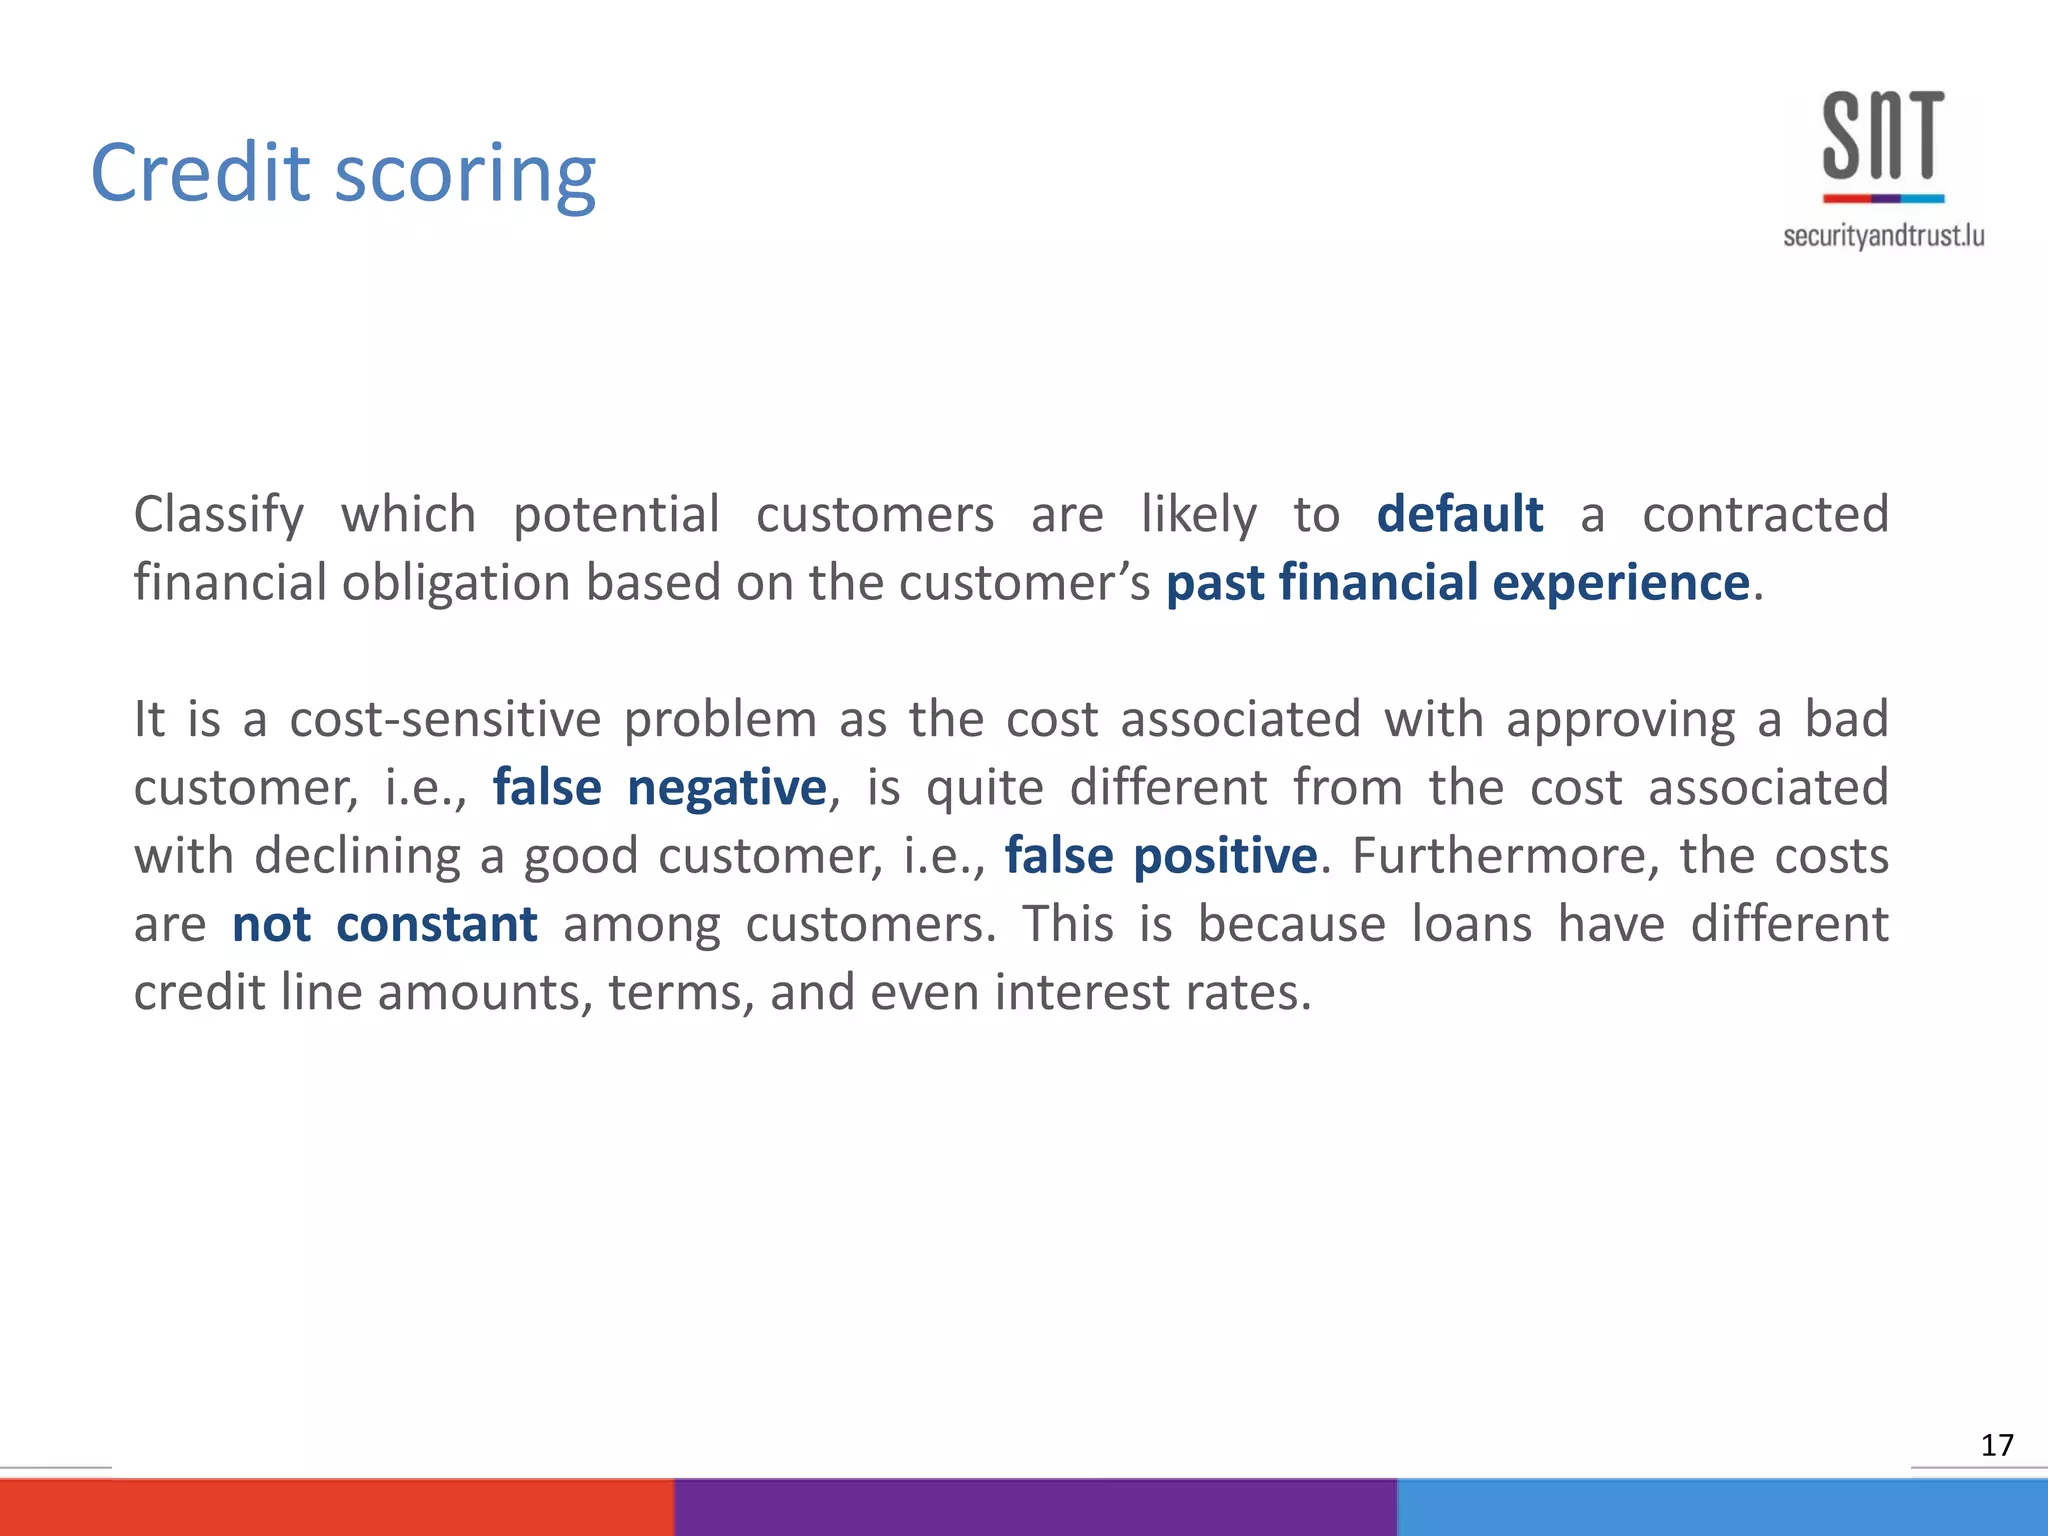
![Estimate the probability of a transaction being fraud based on analyzing
customer patterns and recent fraudulent behavior
Issues when constructing a fraud detection system [Bolton et al., 2002]:
• Skewness of the data
• Cost-sensitivity
• Short time response of the system
• Dimensionality of the search space
• Feature preprocessing
Credit card fraud detection
10](https://image.slidesharecdn.com/thesisexampledependentcostsensitiveclassificationslides-150923041551-lva1-app6892/75/PhD-Defense-Example-Dependent-Cost-Sensitive-Classification-10-2048.jpg)
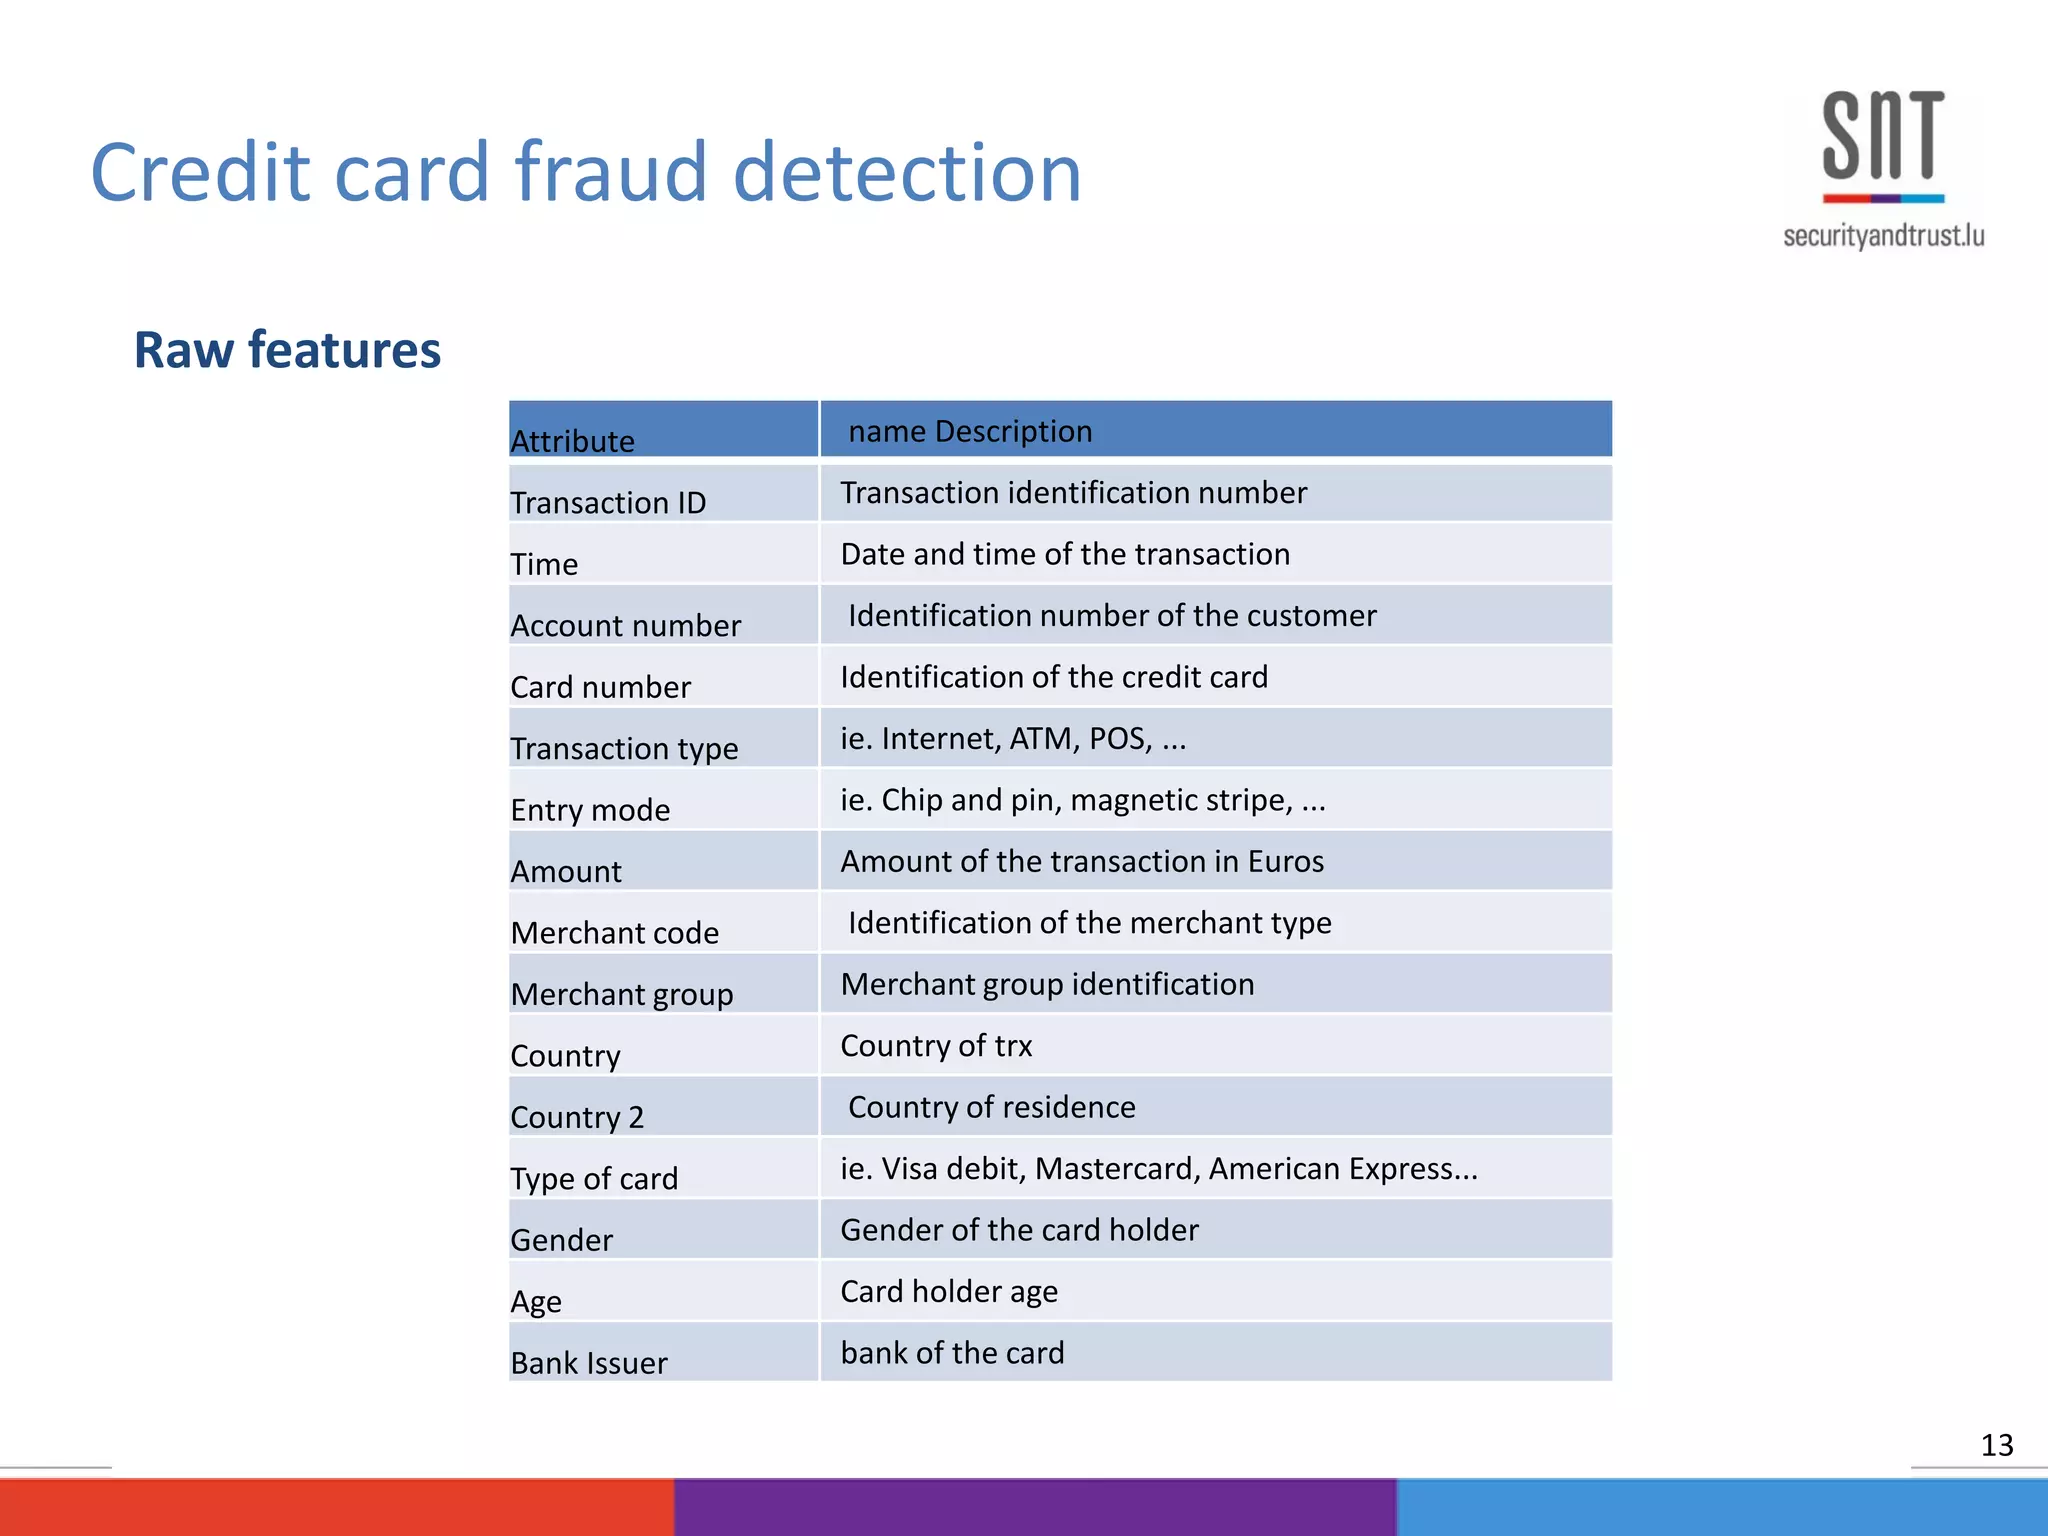
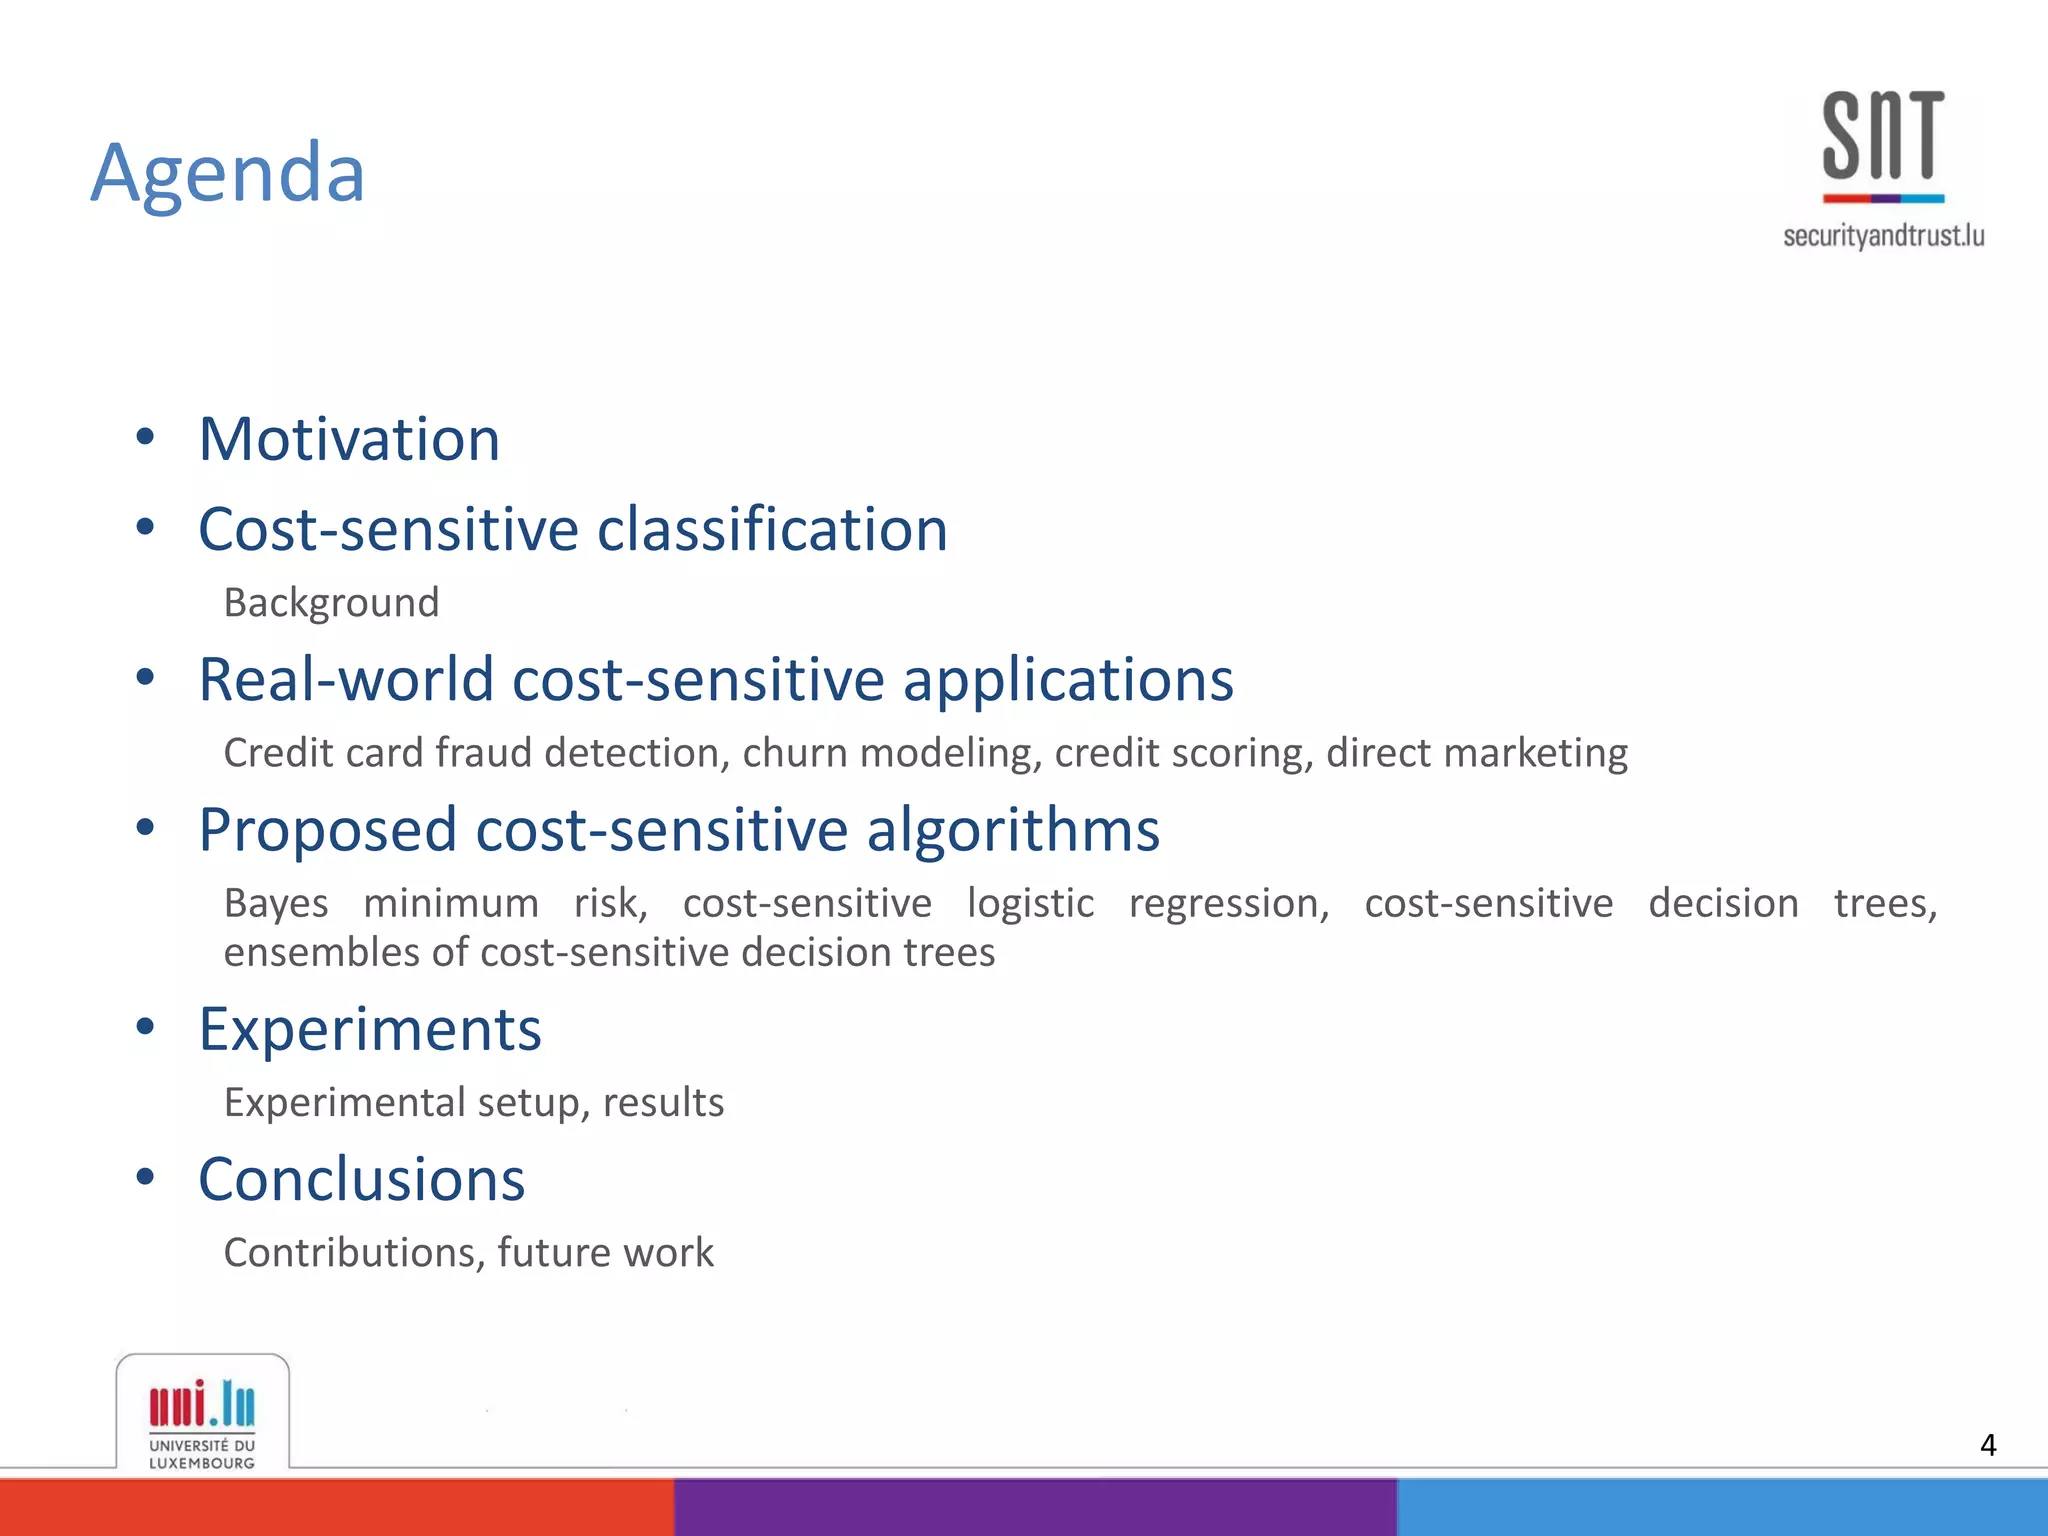
![Transaction aggregation strategy [Whitrow, 2008]
Credit card fraud detection
14
Raw Features
TrxId Time Type Country Amt
1 1/1 18:20 POS Lux 250
2 1/1 20:35 POS Lux 400
3 1/1 22:30 ATM Lux 250
4 2/1 00:50 POS Ger 50
5 2/1 19:18 POS Ger 100
6 2/1 23:45 POS Ger 150
7 3/1 06:00 POS Lux 10
Aggregated Features
No Trx
last 24h
Amt last
24h
No Trx
last 24h
same
type and
country
Amt last
24h same
type and
country
0 0 0 0
1 250 1 250
2 650 0 0
3 900 0 0
3 700 1 50
2 150 2 150
3 400 0 0](https://image.slidesharecdn.com/thesisexampledependentcostsensitiveclassificationslides-150923041551-lva1-app6892/75/PhD-Defense-Example-Dependent-Cost-Sensitive-Classification-14-2048.jpg)
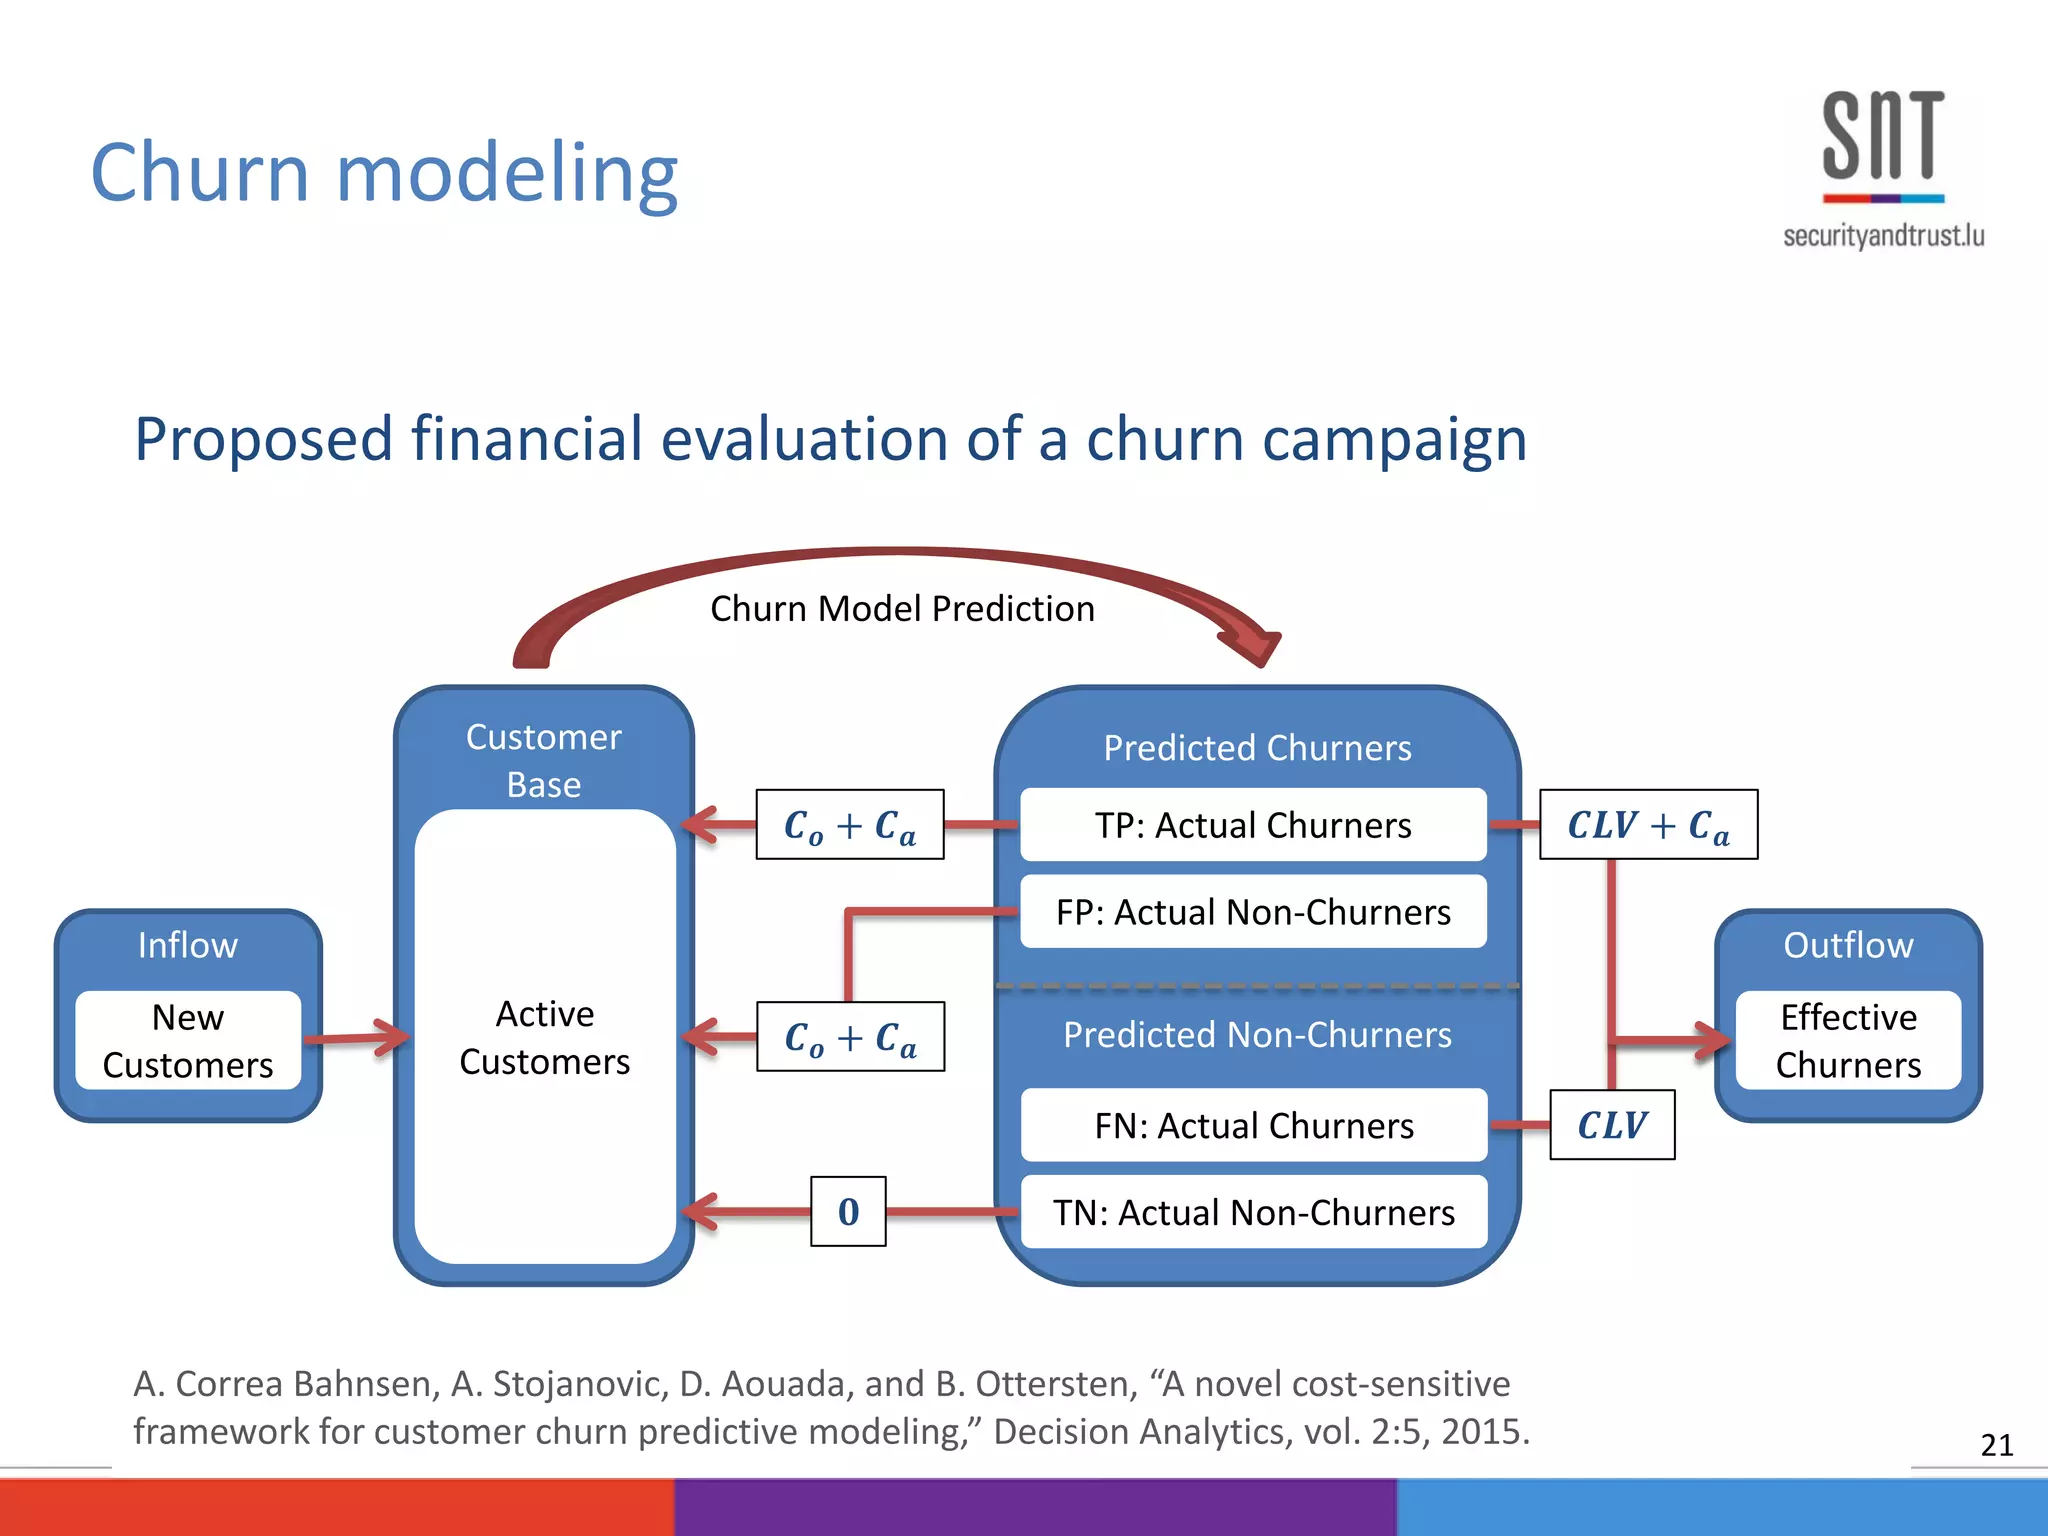
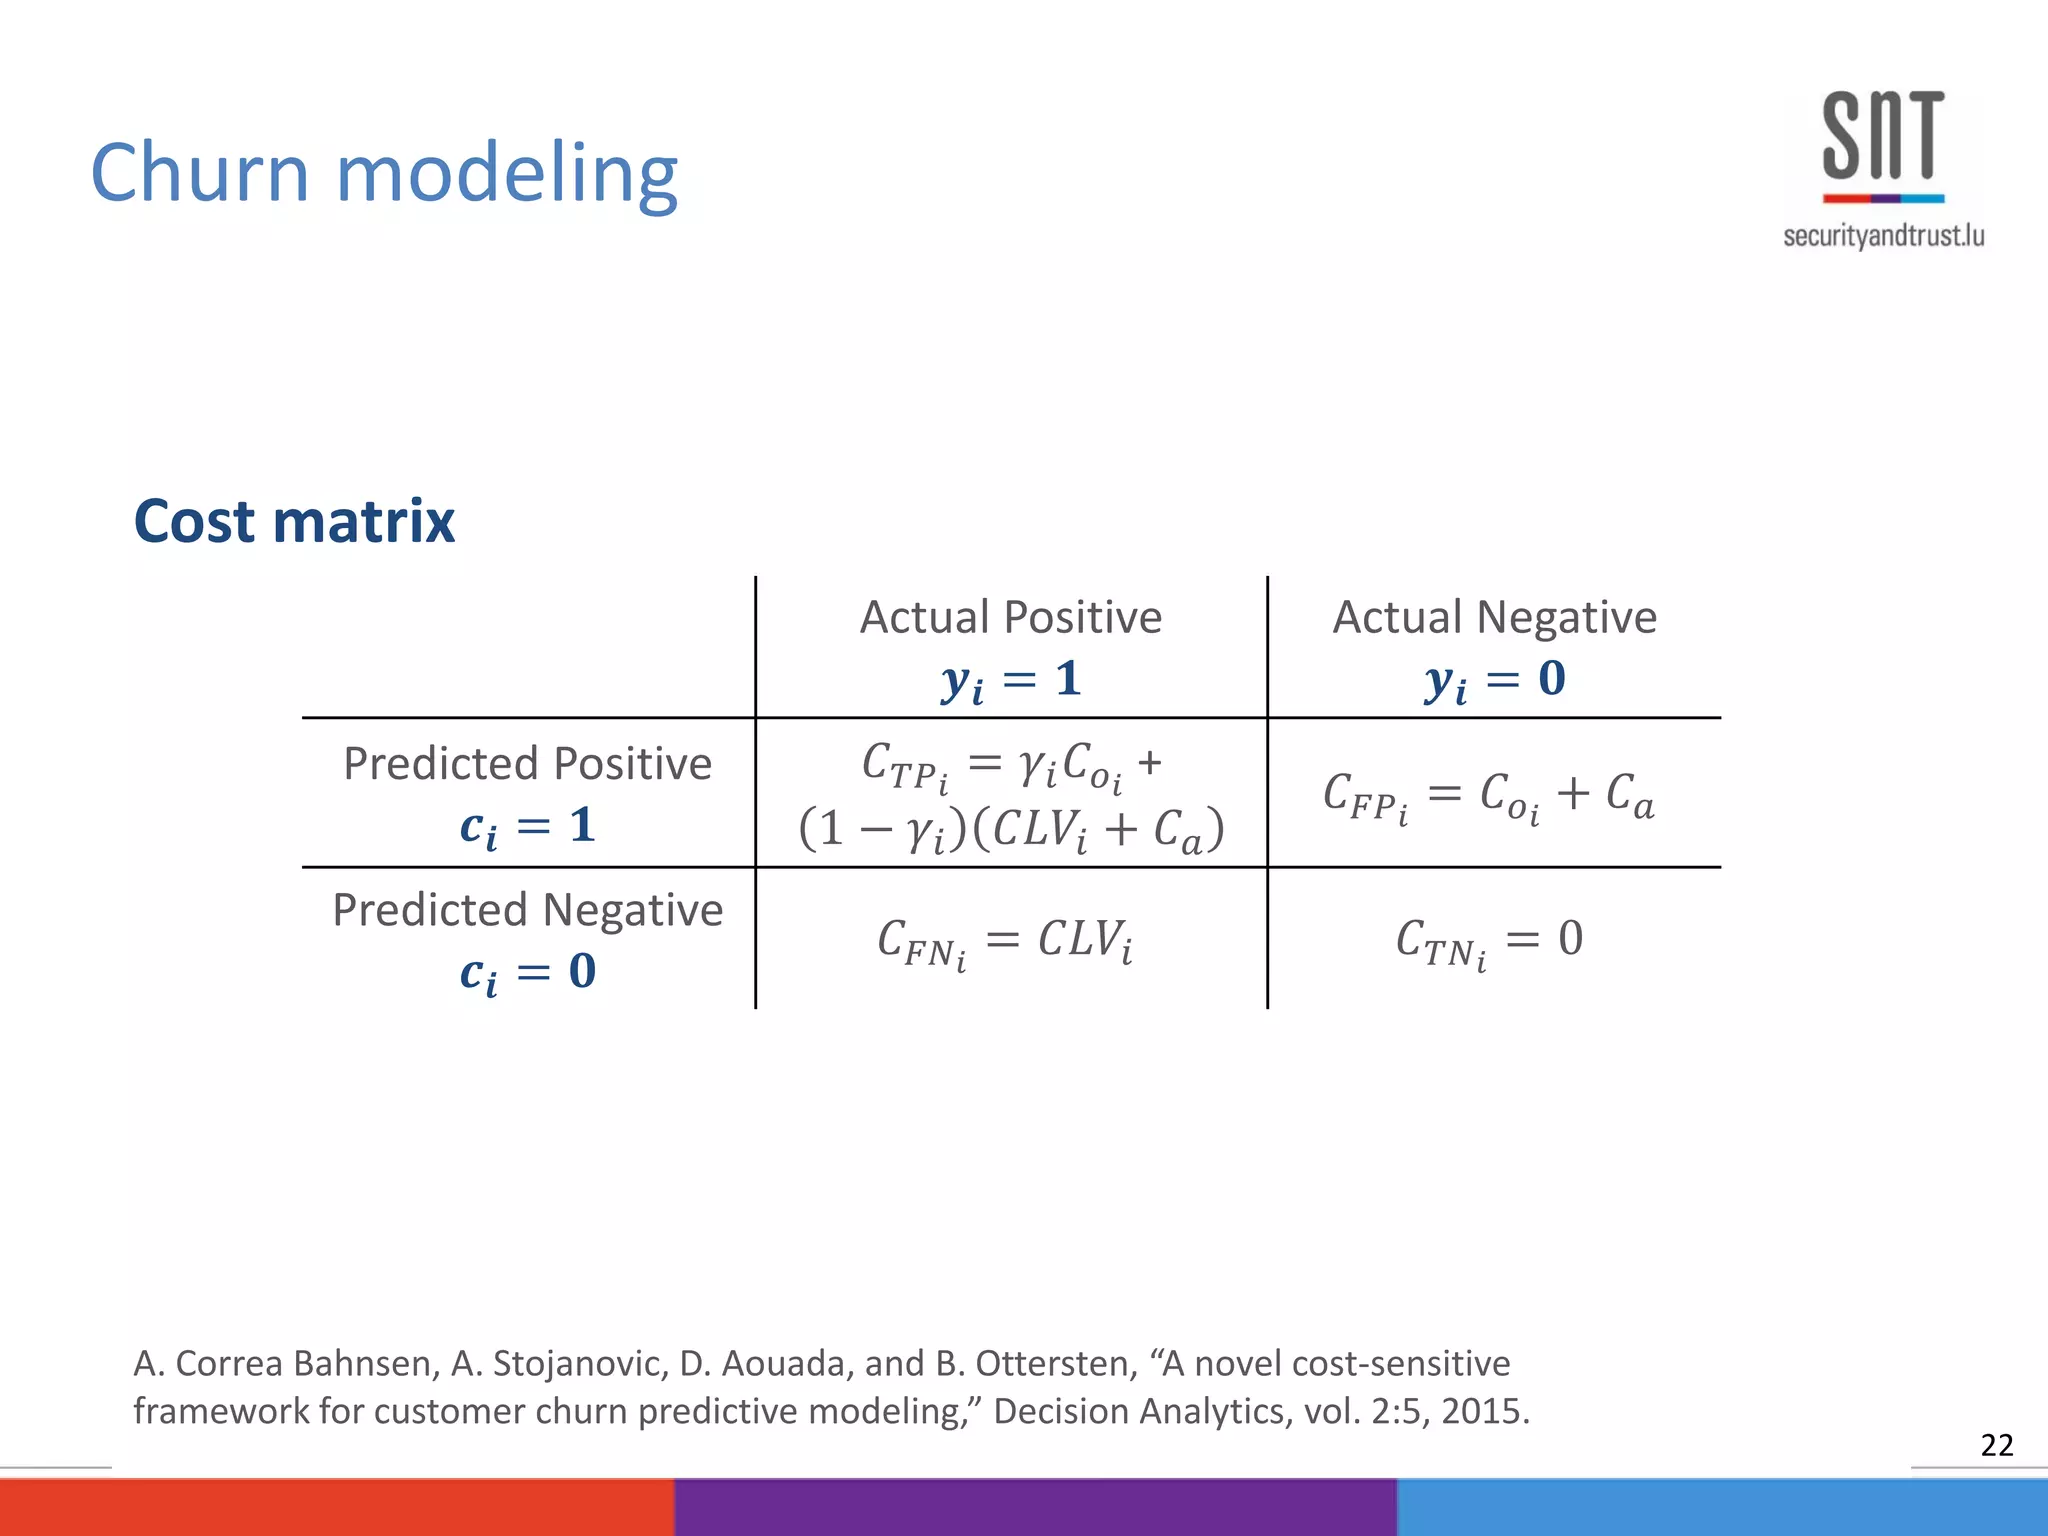
![Churn management campaign [Verbraken, 2013]
Churn modeling
20
Inflow
New
Customers
Customer
Base
Active
Customers
Predicted Churners
Predicted Non-Churners
TP: Actual Churners
FP: Actual Non-Churners
FN: Actual Churners
TN: Actual Non-Churners
Outflow
Effective
Churners
Churn Model Prediction
1
1
𝟏 − 𝜸𝜸
1](https://image.slidesharecdn.com/thesisexampledependentcostsensitiveclassificationslides-150923041551-lva1-app6892/75/PhD-Defense-Example-Dependent-Cost-Sensitive-Classification-20-2048.jpg)


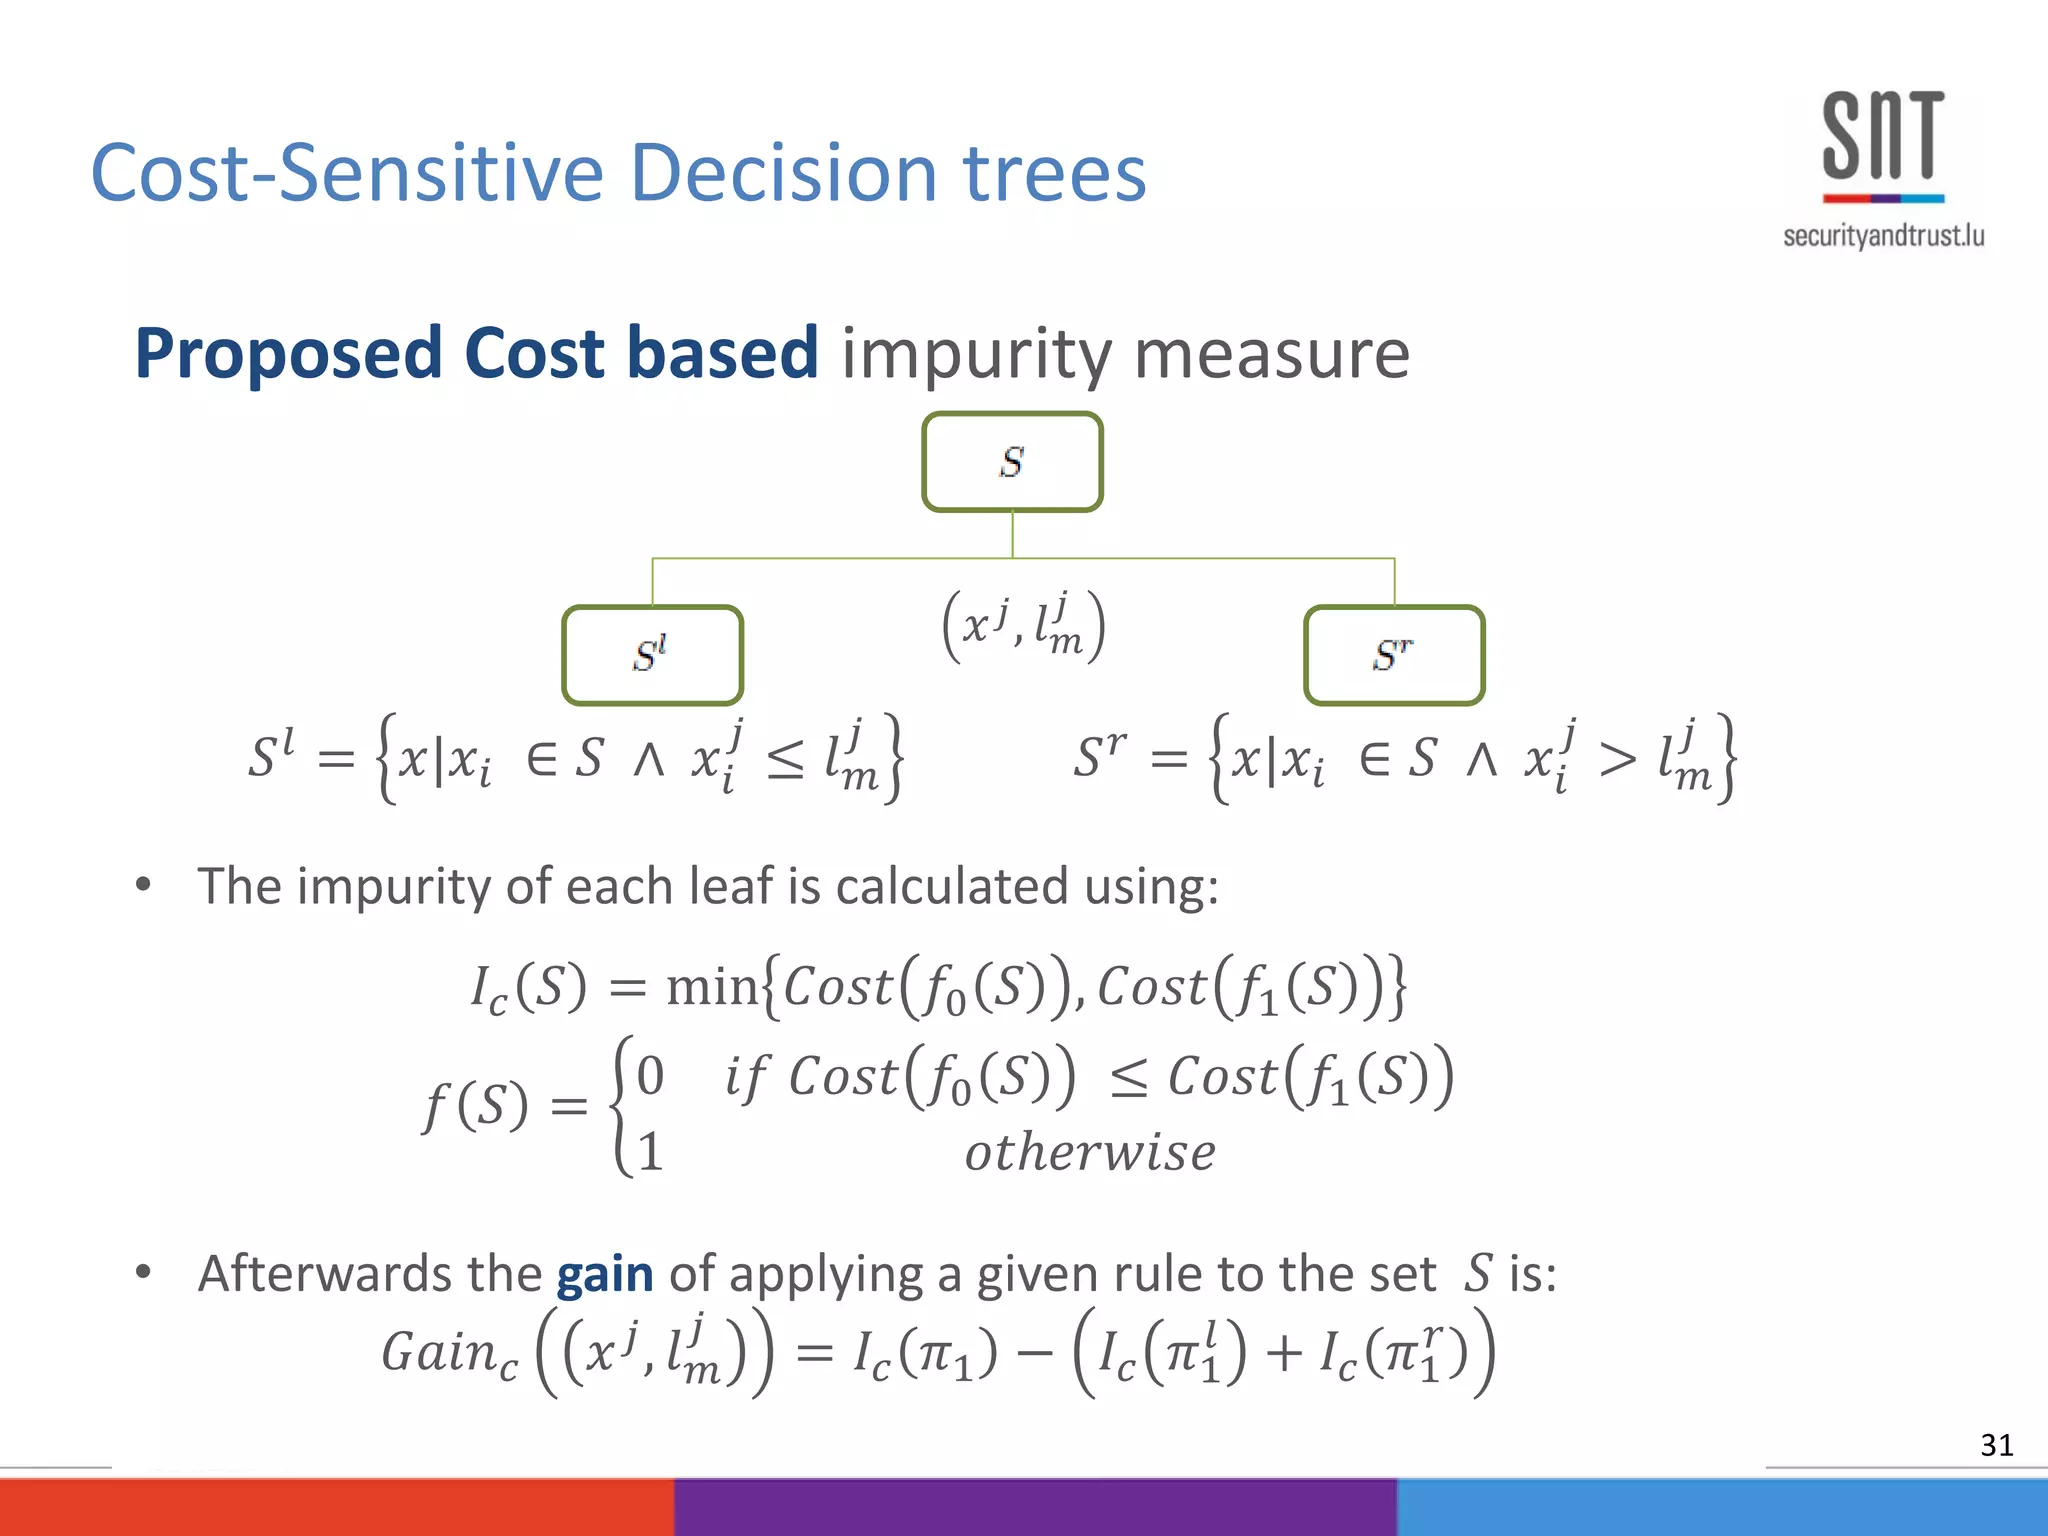
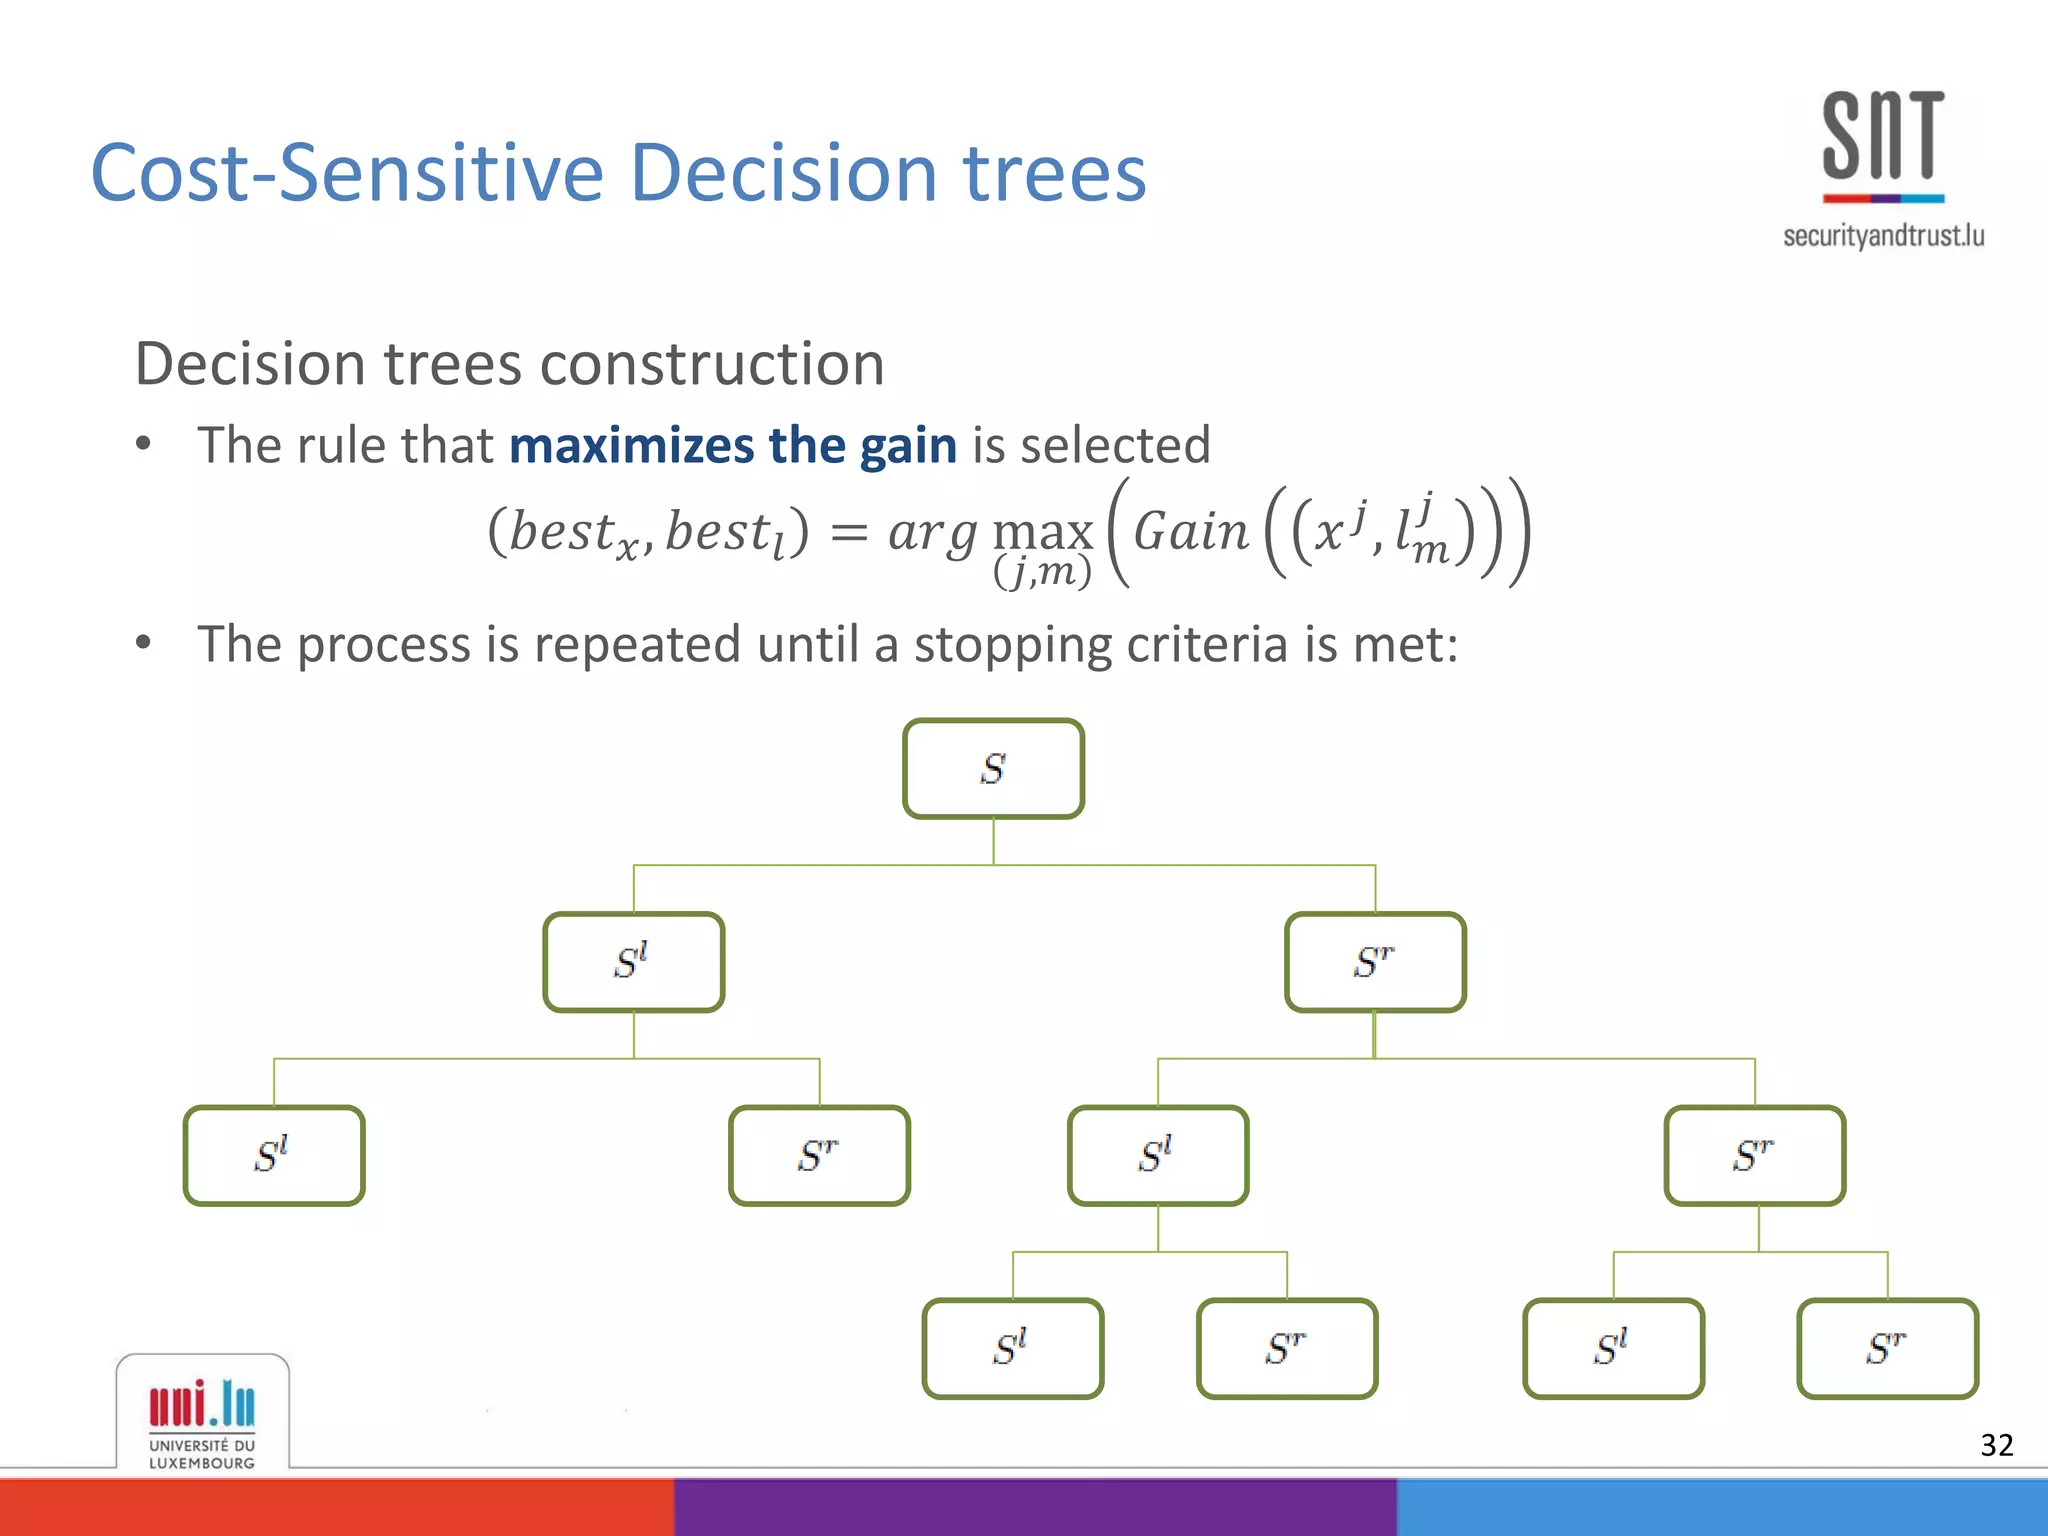
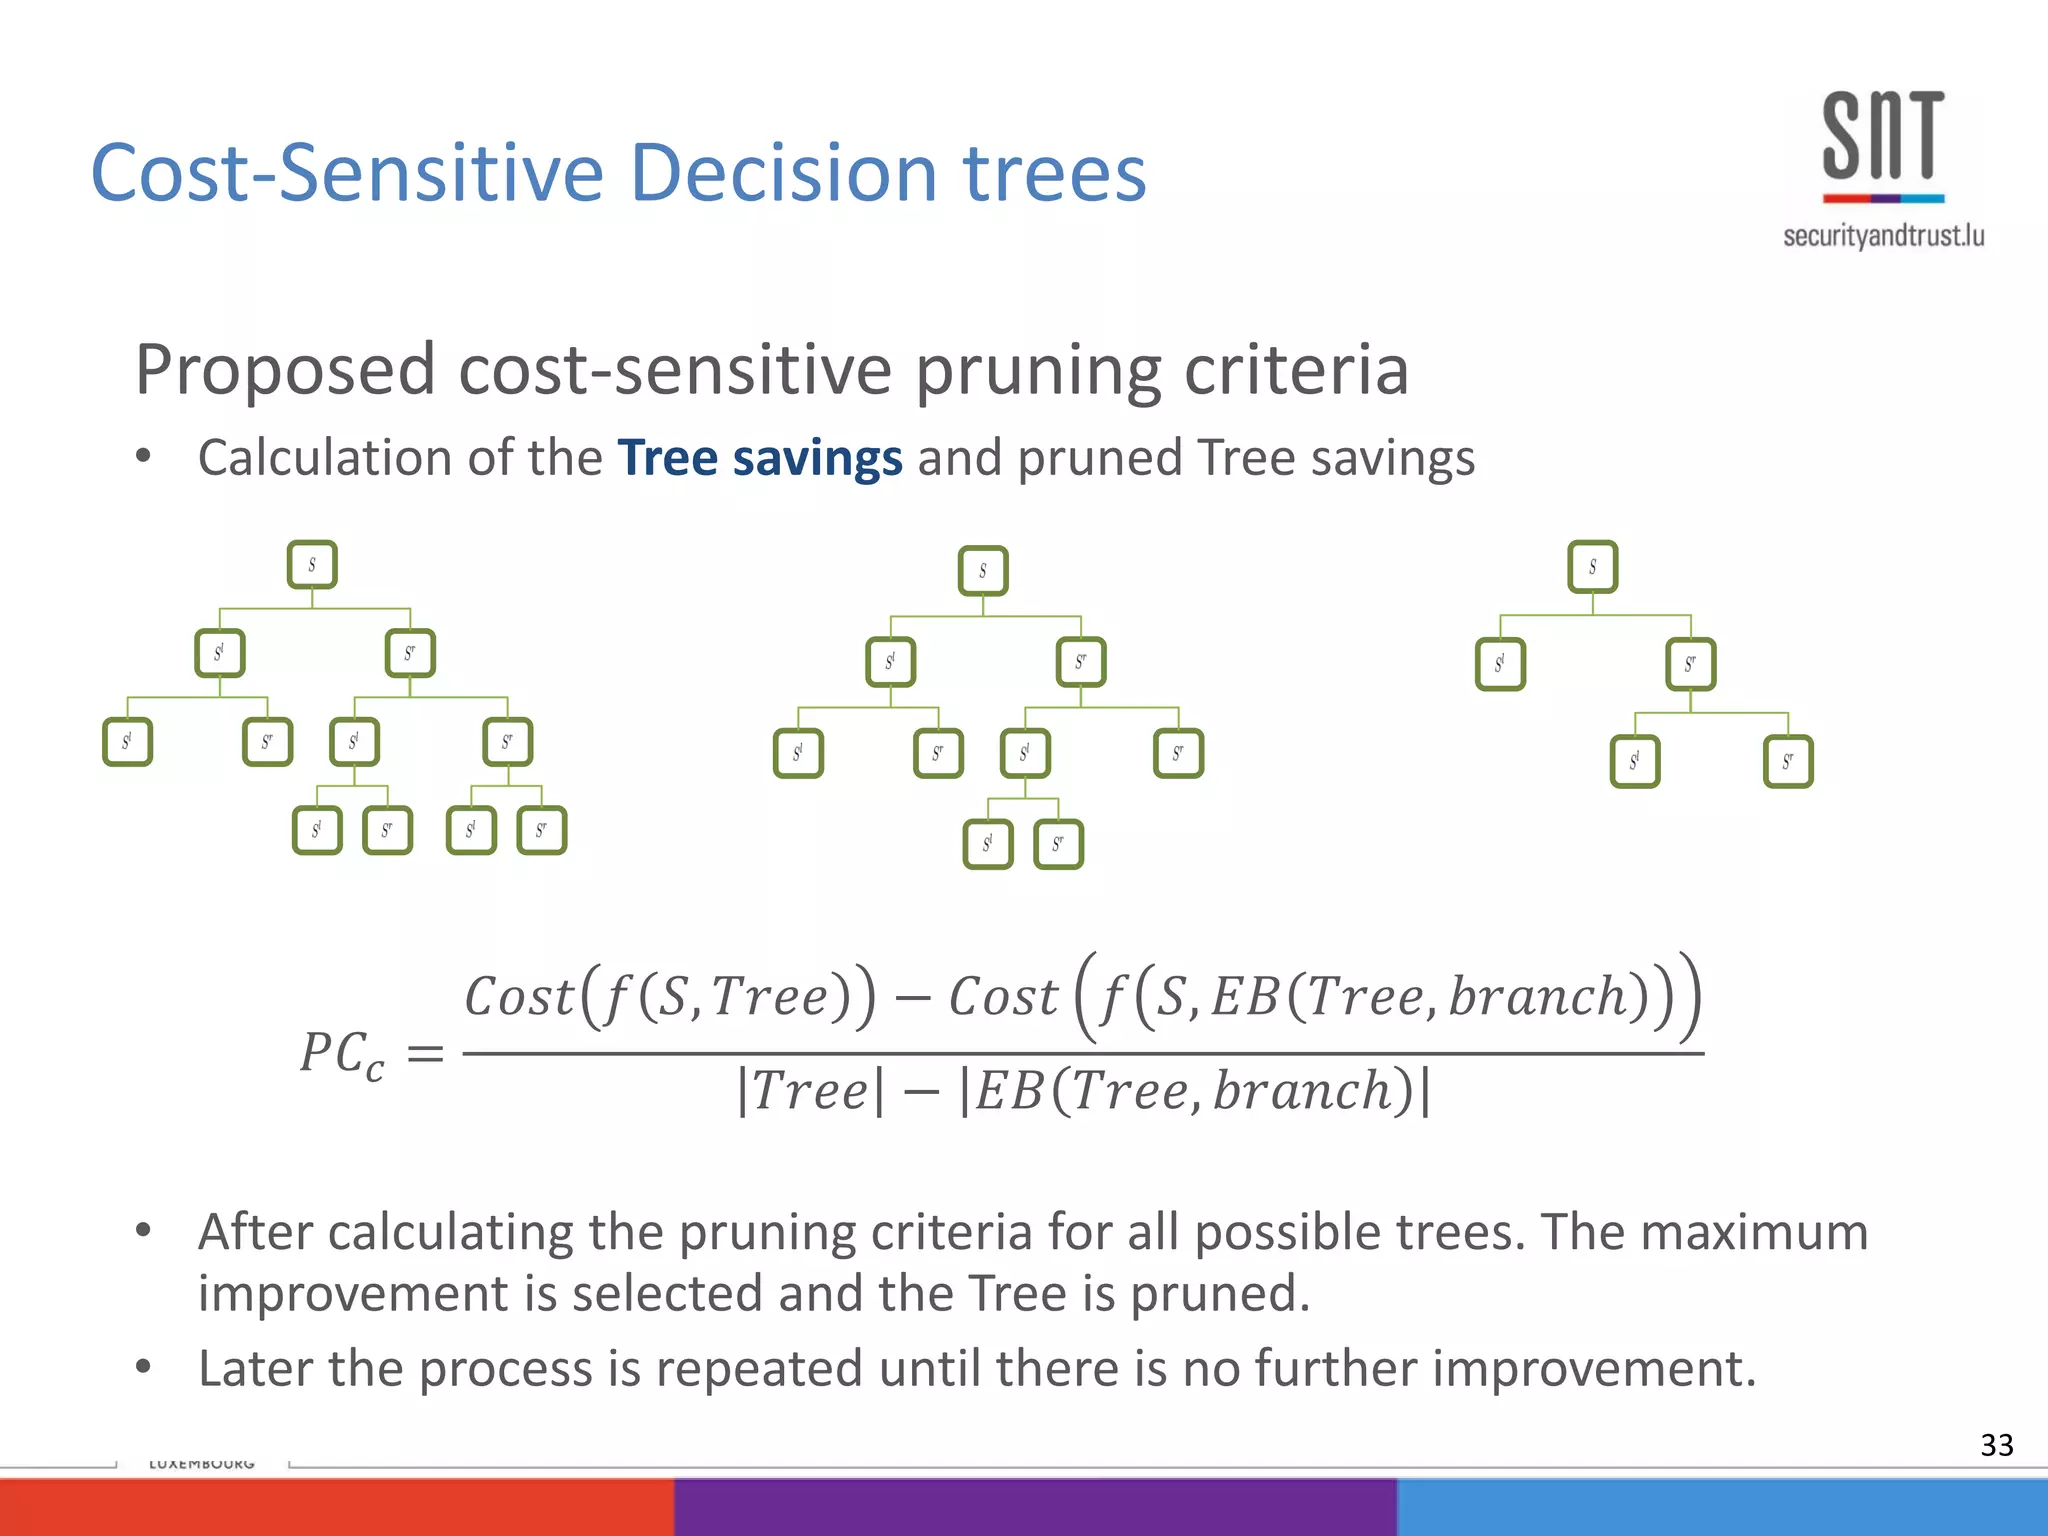
![• A decision tree is a classification model that iteratively creates binary
decision rules 𝑥 𝑗, 𝑙 𝑚
𝑗
that maximize certain criteria (gain, entropy, …).
Where 𝑥 𝑗, 𝑙 𝑚
𝑗
refers to making a rule using feature j on value m
• Maximize the accuracy is different than maximizing the cost.
• To solve this, some studies had been proposed method that aim to
introduce the cost-sensitivity into the algorithms [Lomax 2013].
However, research have been focused on class-dependent methods
• We proposed:
• Example-dependent cost based impurity measure
• Example-dependent cost based pruning criteria
Cost-Sensitive Decision trees
30](https://image.slidesharecdn.com/thesisexampledependentcostsensitiveclassificationslides-150923041551-lva1-app6892/75/PhD-Defense-Example-Dependent-Cost-Sensitive-Classification-30-2048.jpg)
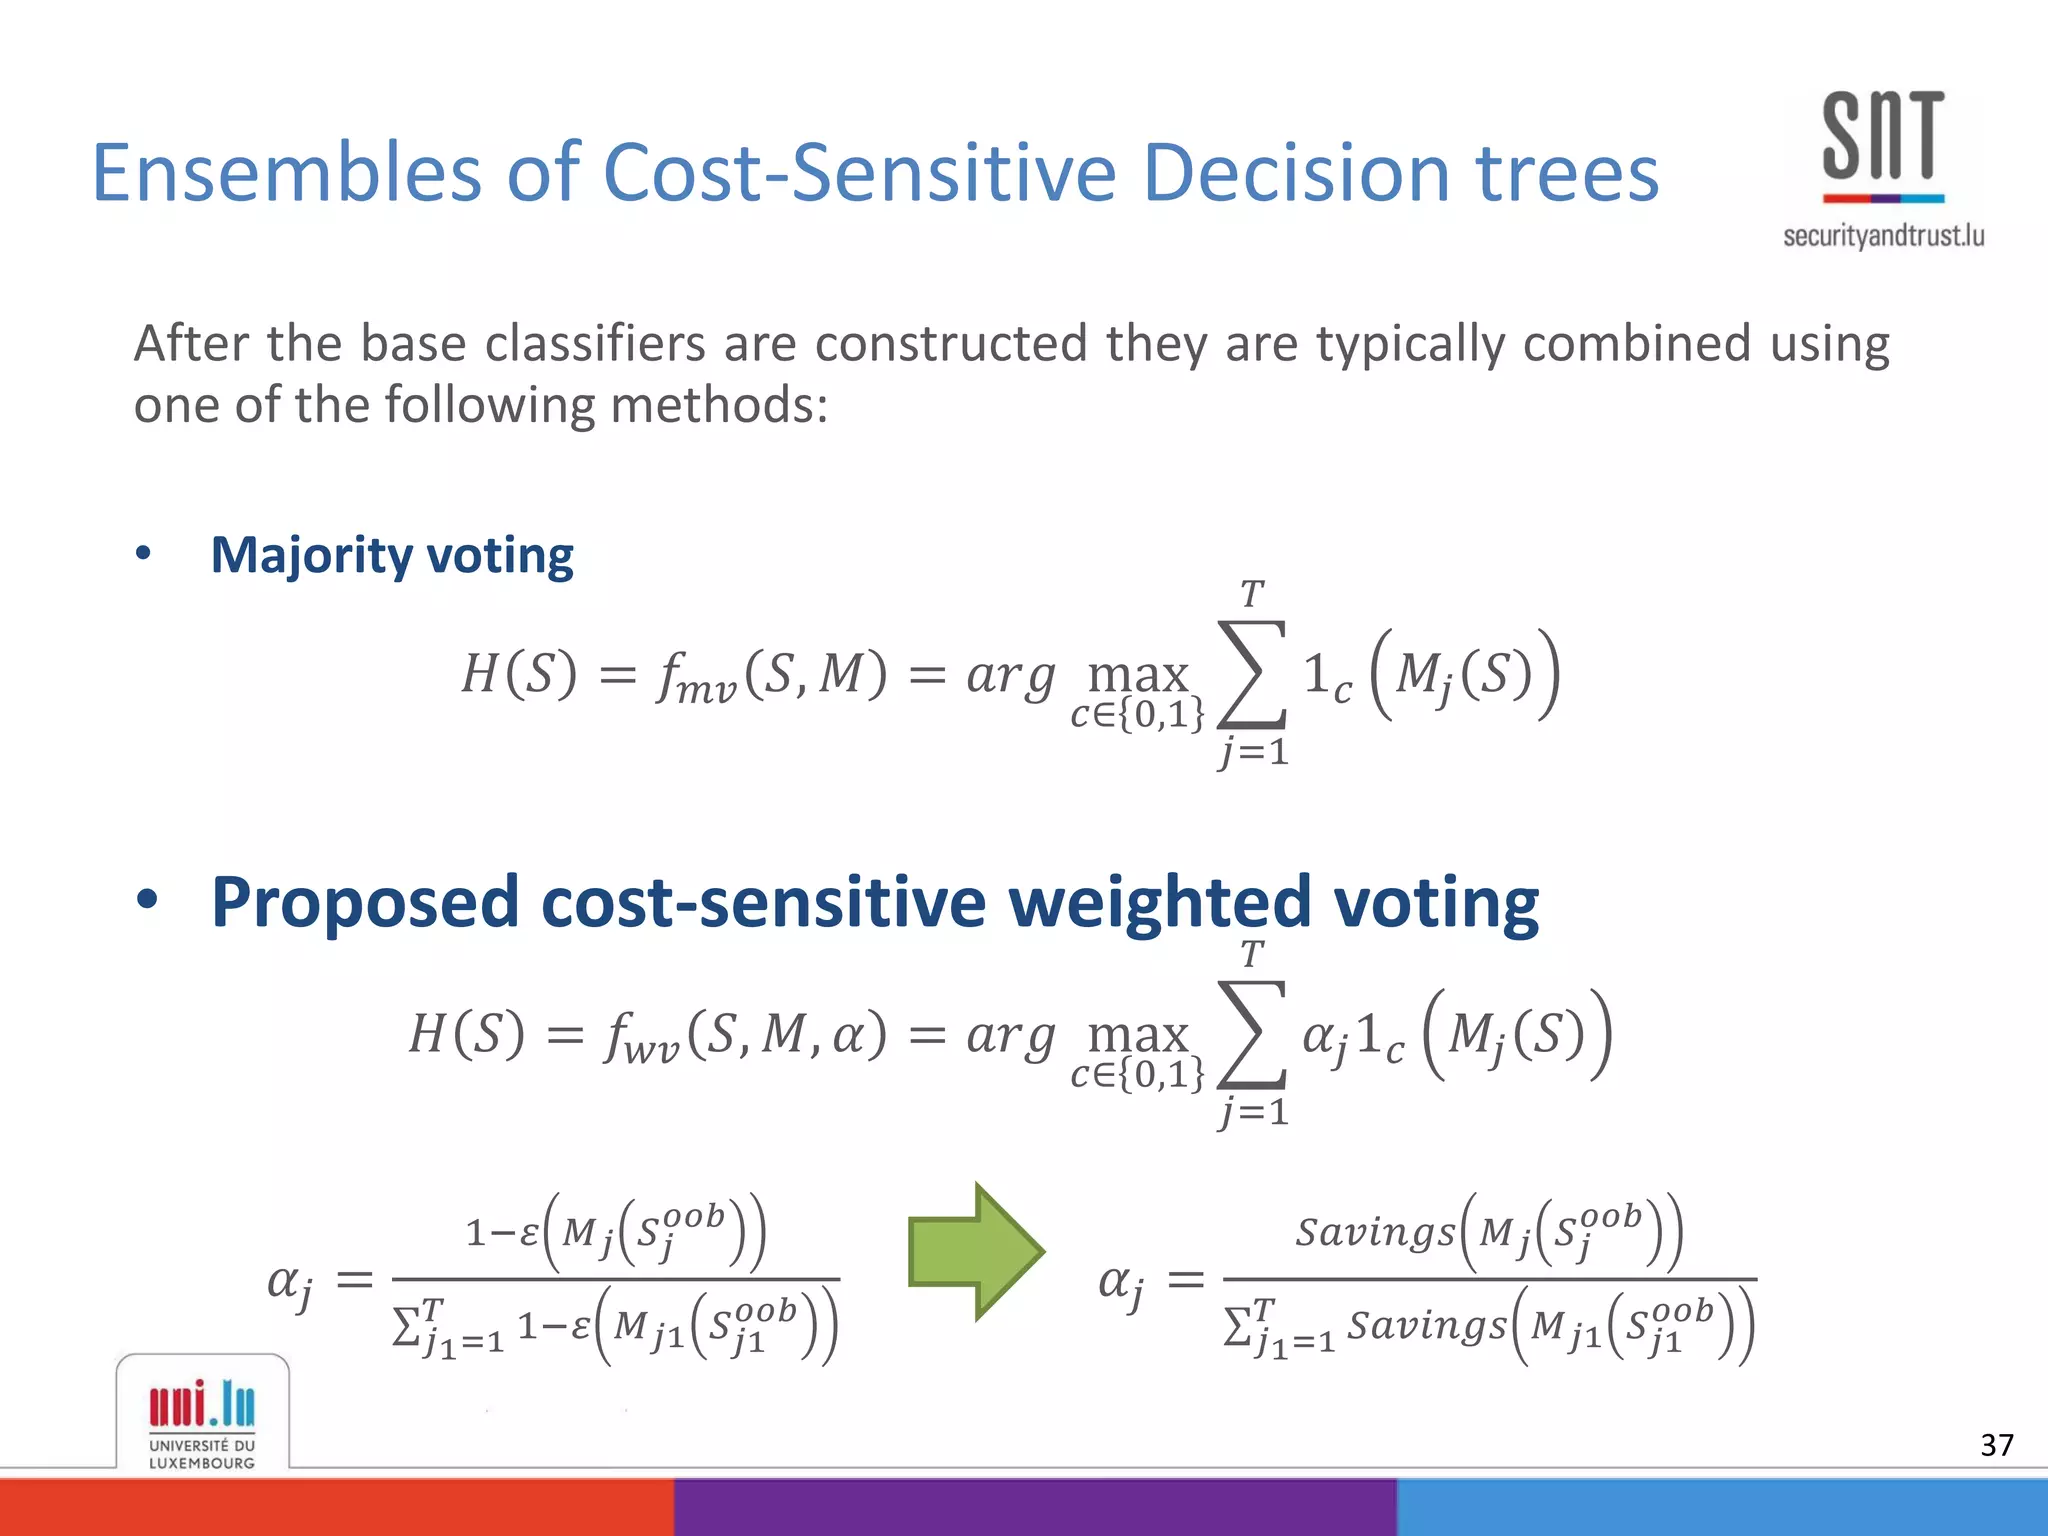
![• Proposed cost-sensitive stacking
𝐻 𝑆 = 𝑓𝑠 𝑆, 𝑀, 𝛽 =
1
1 + 𝑒
− 𝑗=1
𝑇
𝛽 𝑗 𝑀 𝑗 𝑆
Using the cost-sensitive logistic regression [Correa et. al, 2014] model:
𝐽 𝑆, 𝑀, 𝛽 =
𝑖=1
𝑁
𝑦𝑖 𝑓𝑠 𝑆, 𝑀, 𝛽 𝐶 𝑇𝑃 𝑖
− 𝐶 𝐹𝑁𝑖
+ 𝐶 𝐹𝑁 𝑖
+
1 − 𝑦𝑖 𝑓𝑠 𝑆, 𝑀, 𝛽 𝐶 𝐹𝑃 𝑖
− 𝐶 𝑇𝑁 𝑖
+ 𝐶 𝑇𝑁 𝑖
Then the weights are estimated using
𝛽 = 𝑎𝑟𝑔 min
𝛽
𝐽 𝑆, 𝑀, 𝛽
Ensembles of Cost-Sensitive Decision trees
38](https://image.slidesharecdn.com/thesisexampledependentcostsensitiveclassificationslides-150923041551-lva1-app6892/75/PhD-Defense-Example-Dependent-Cost-Sensitive-Classification-38-2048.jpg)
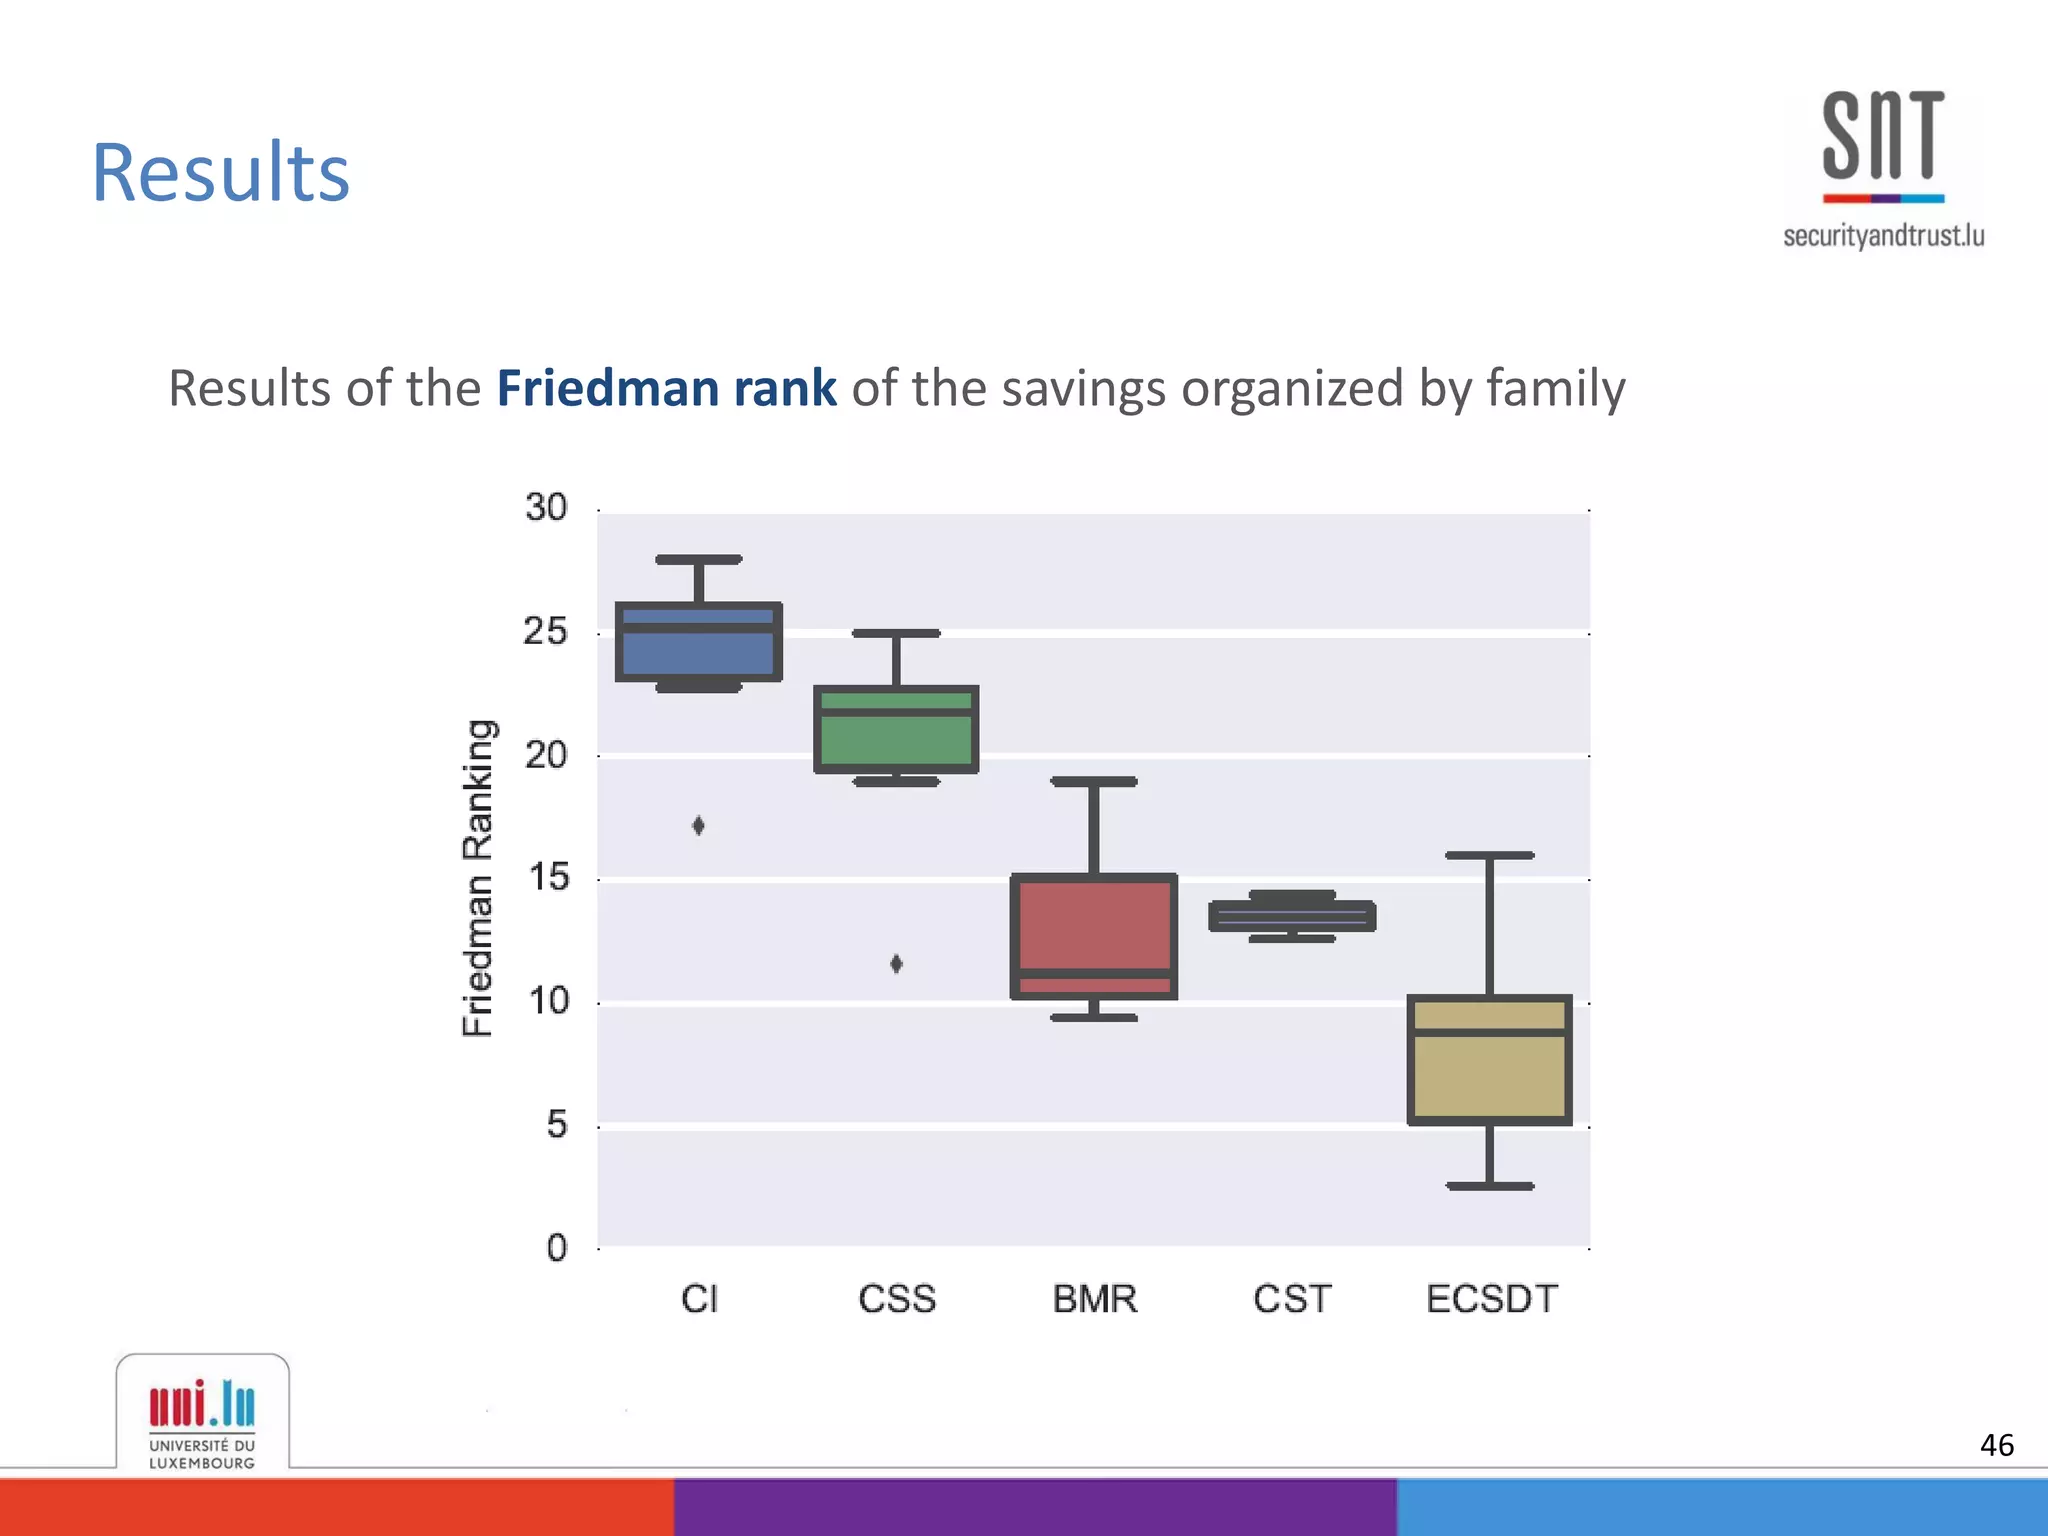
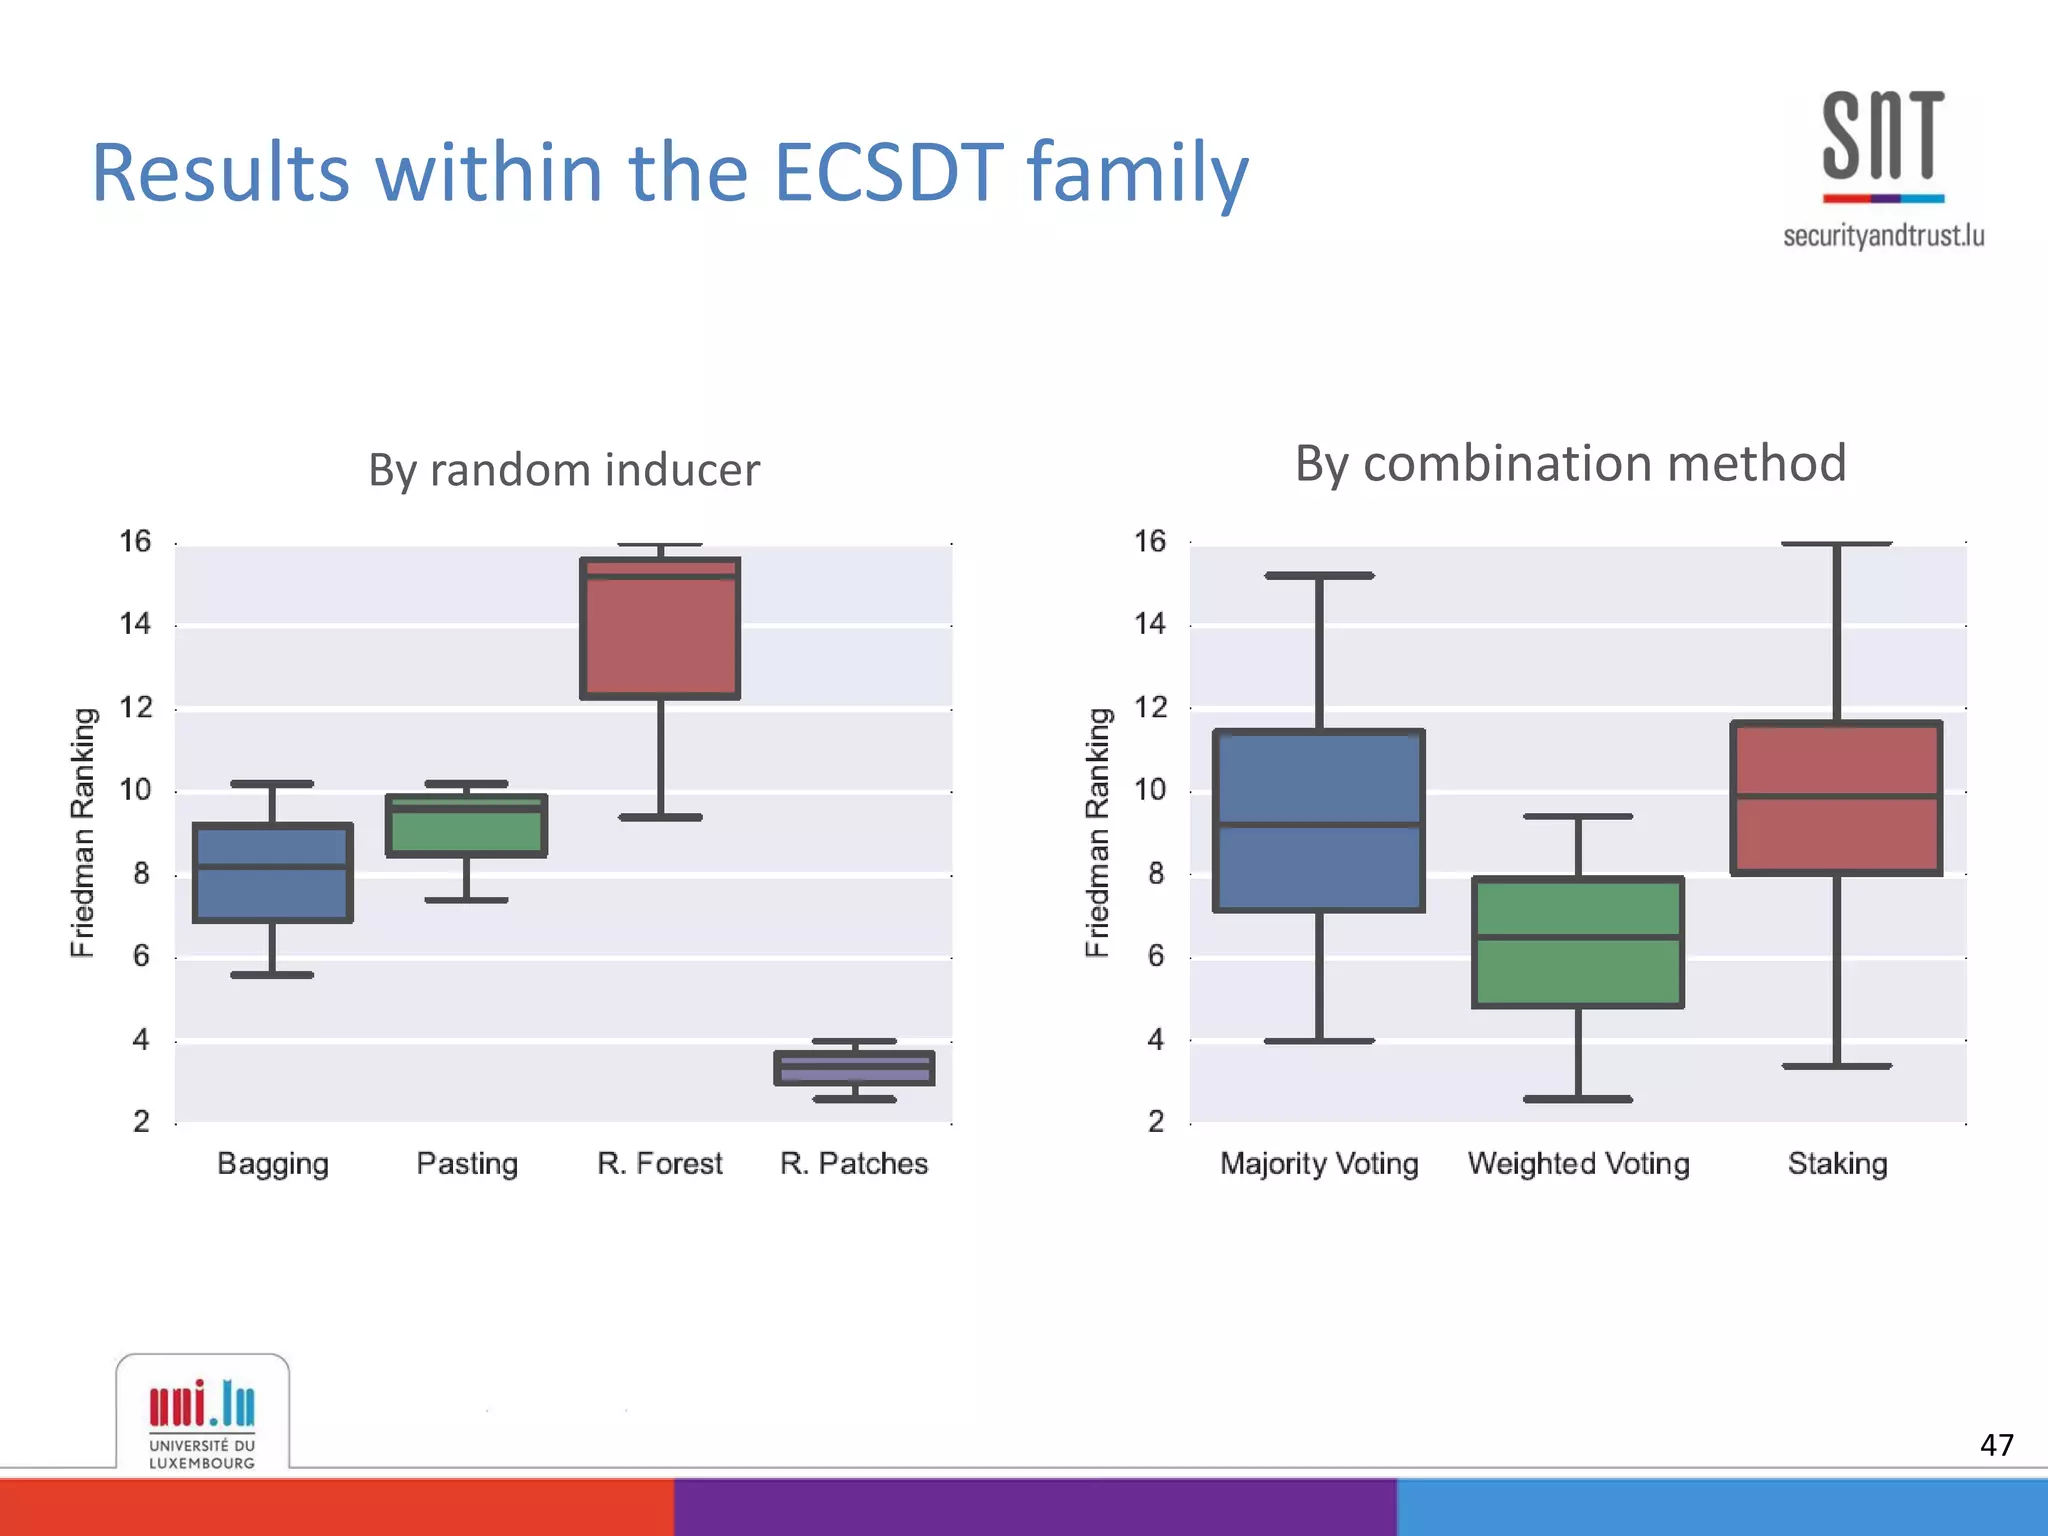
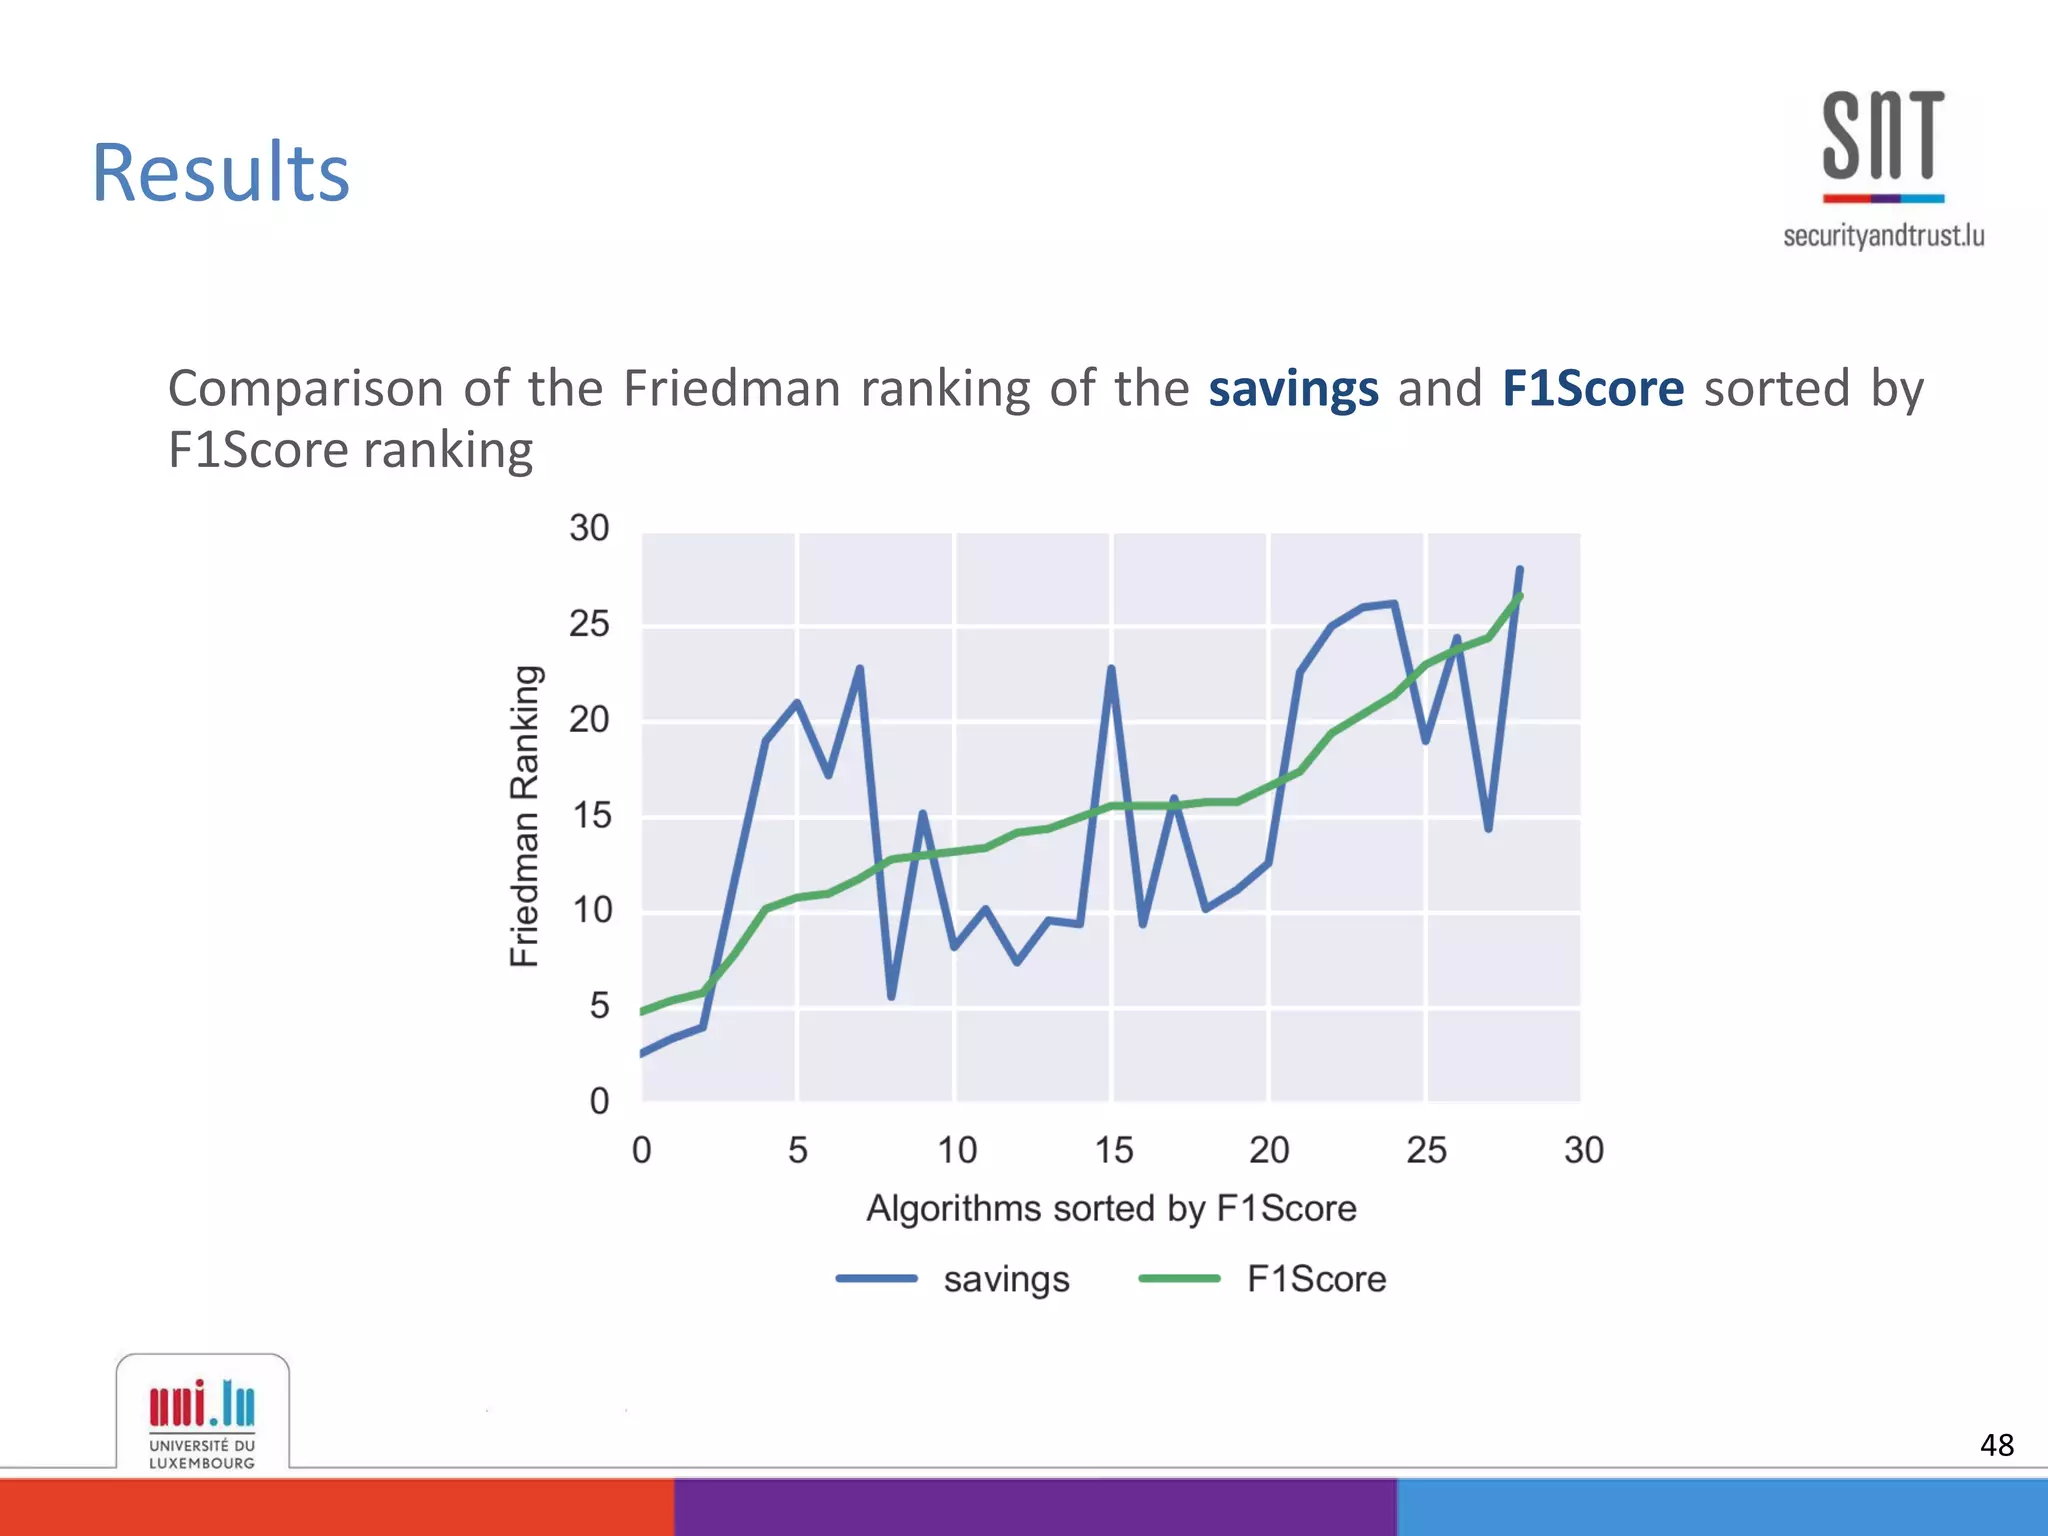
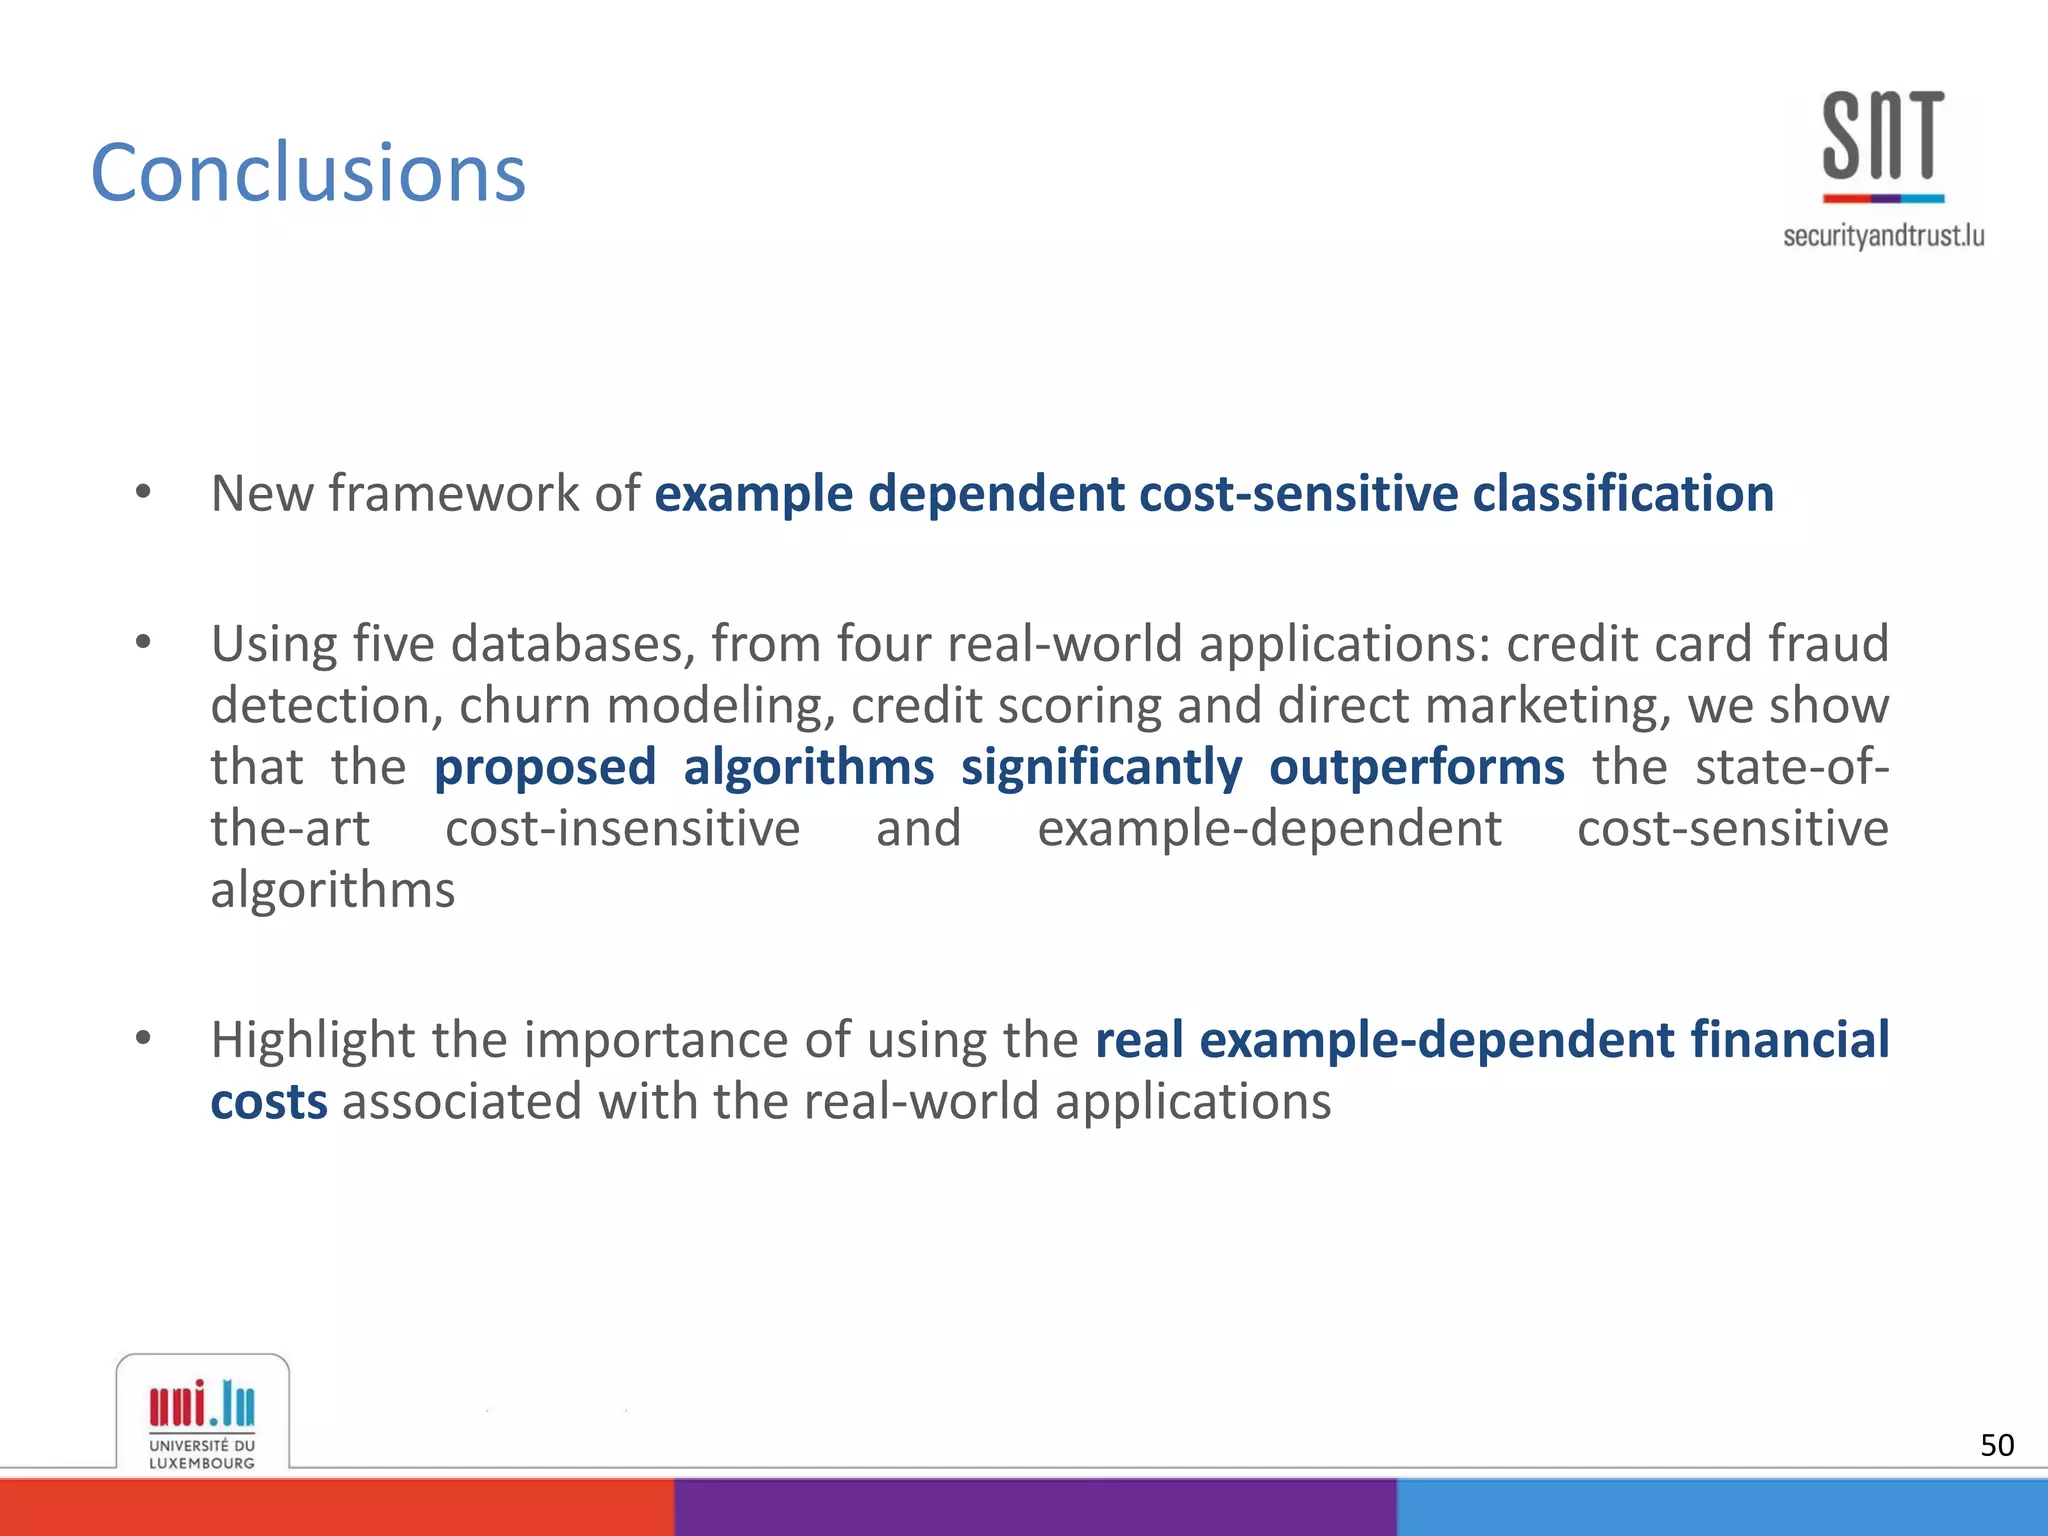


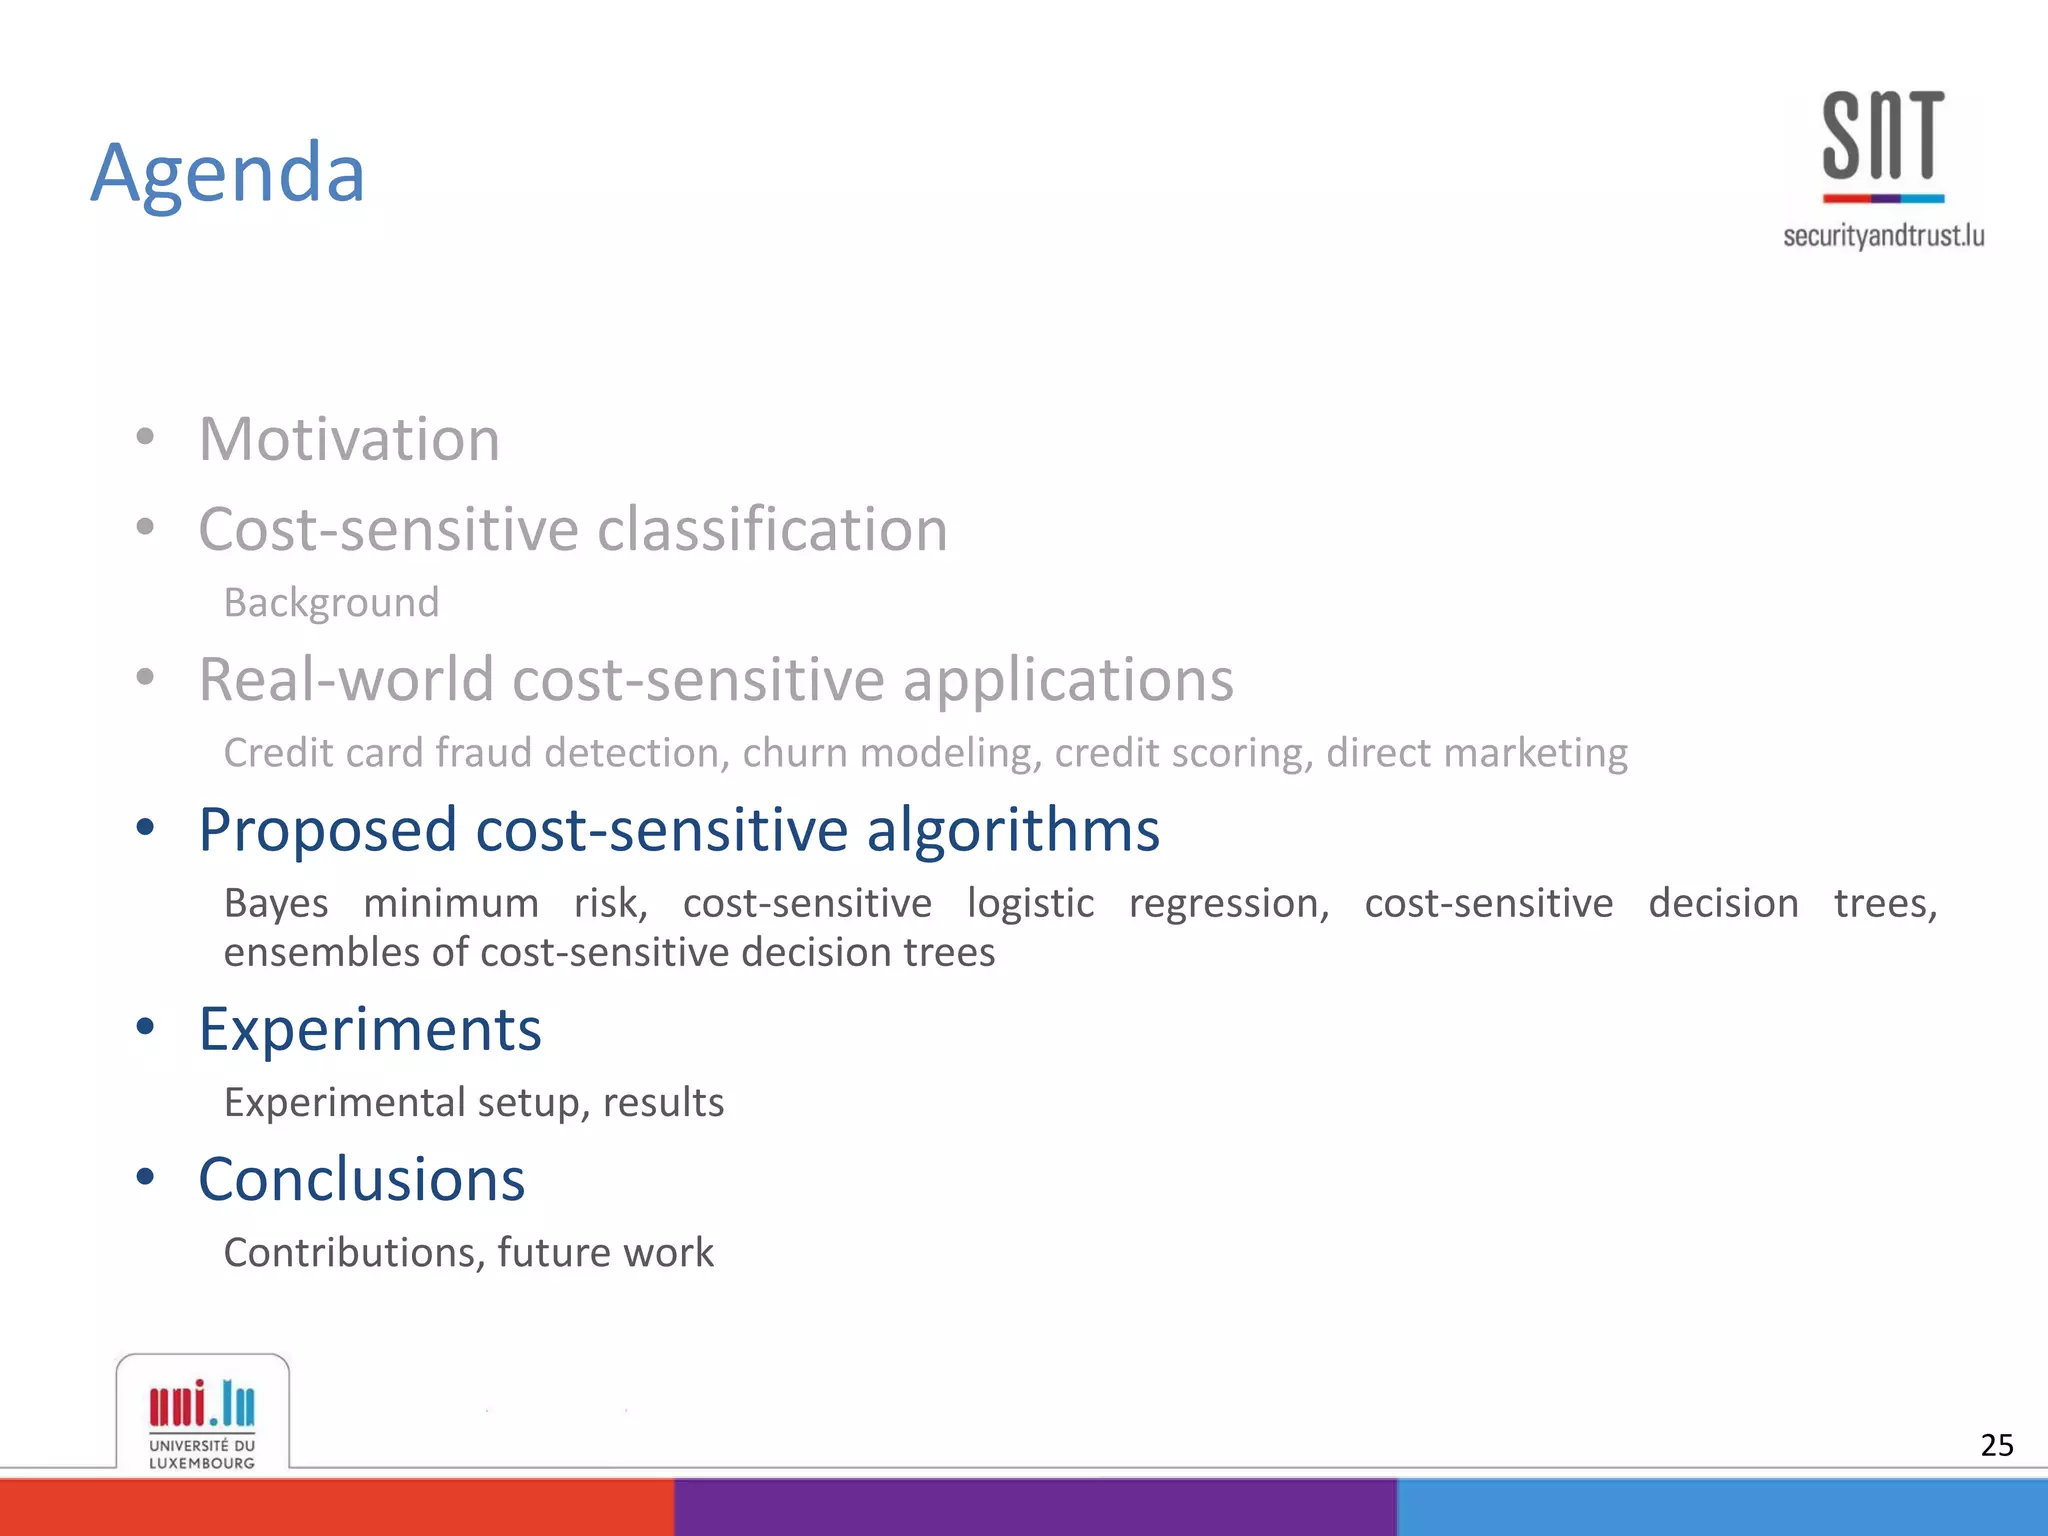
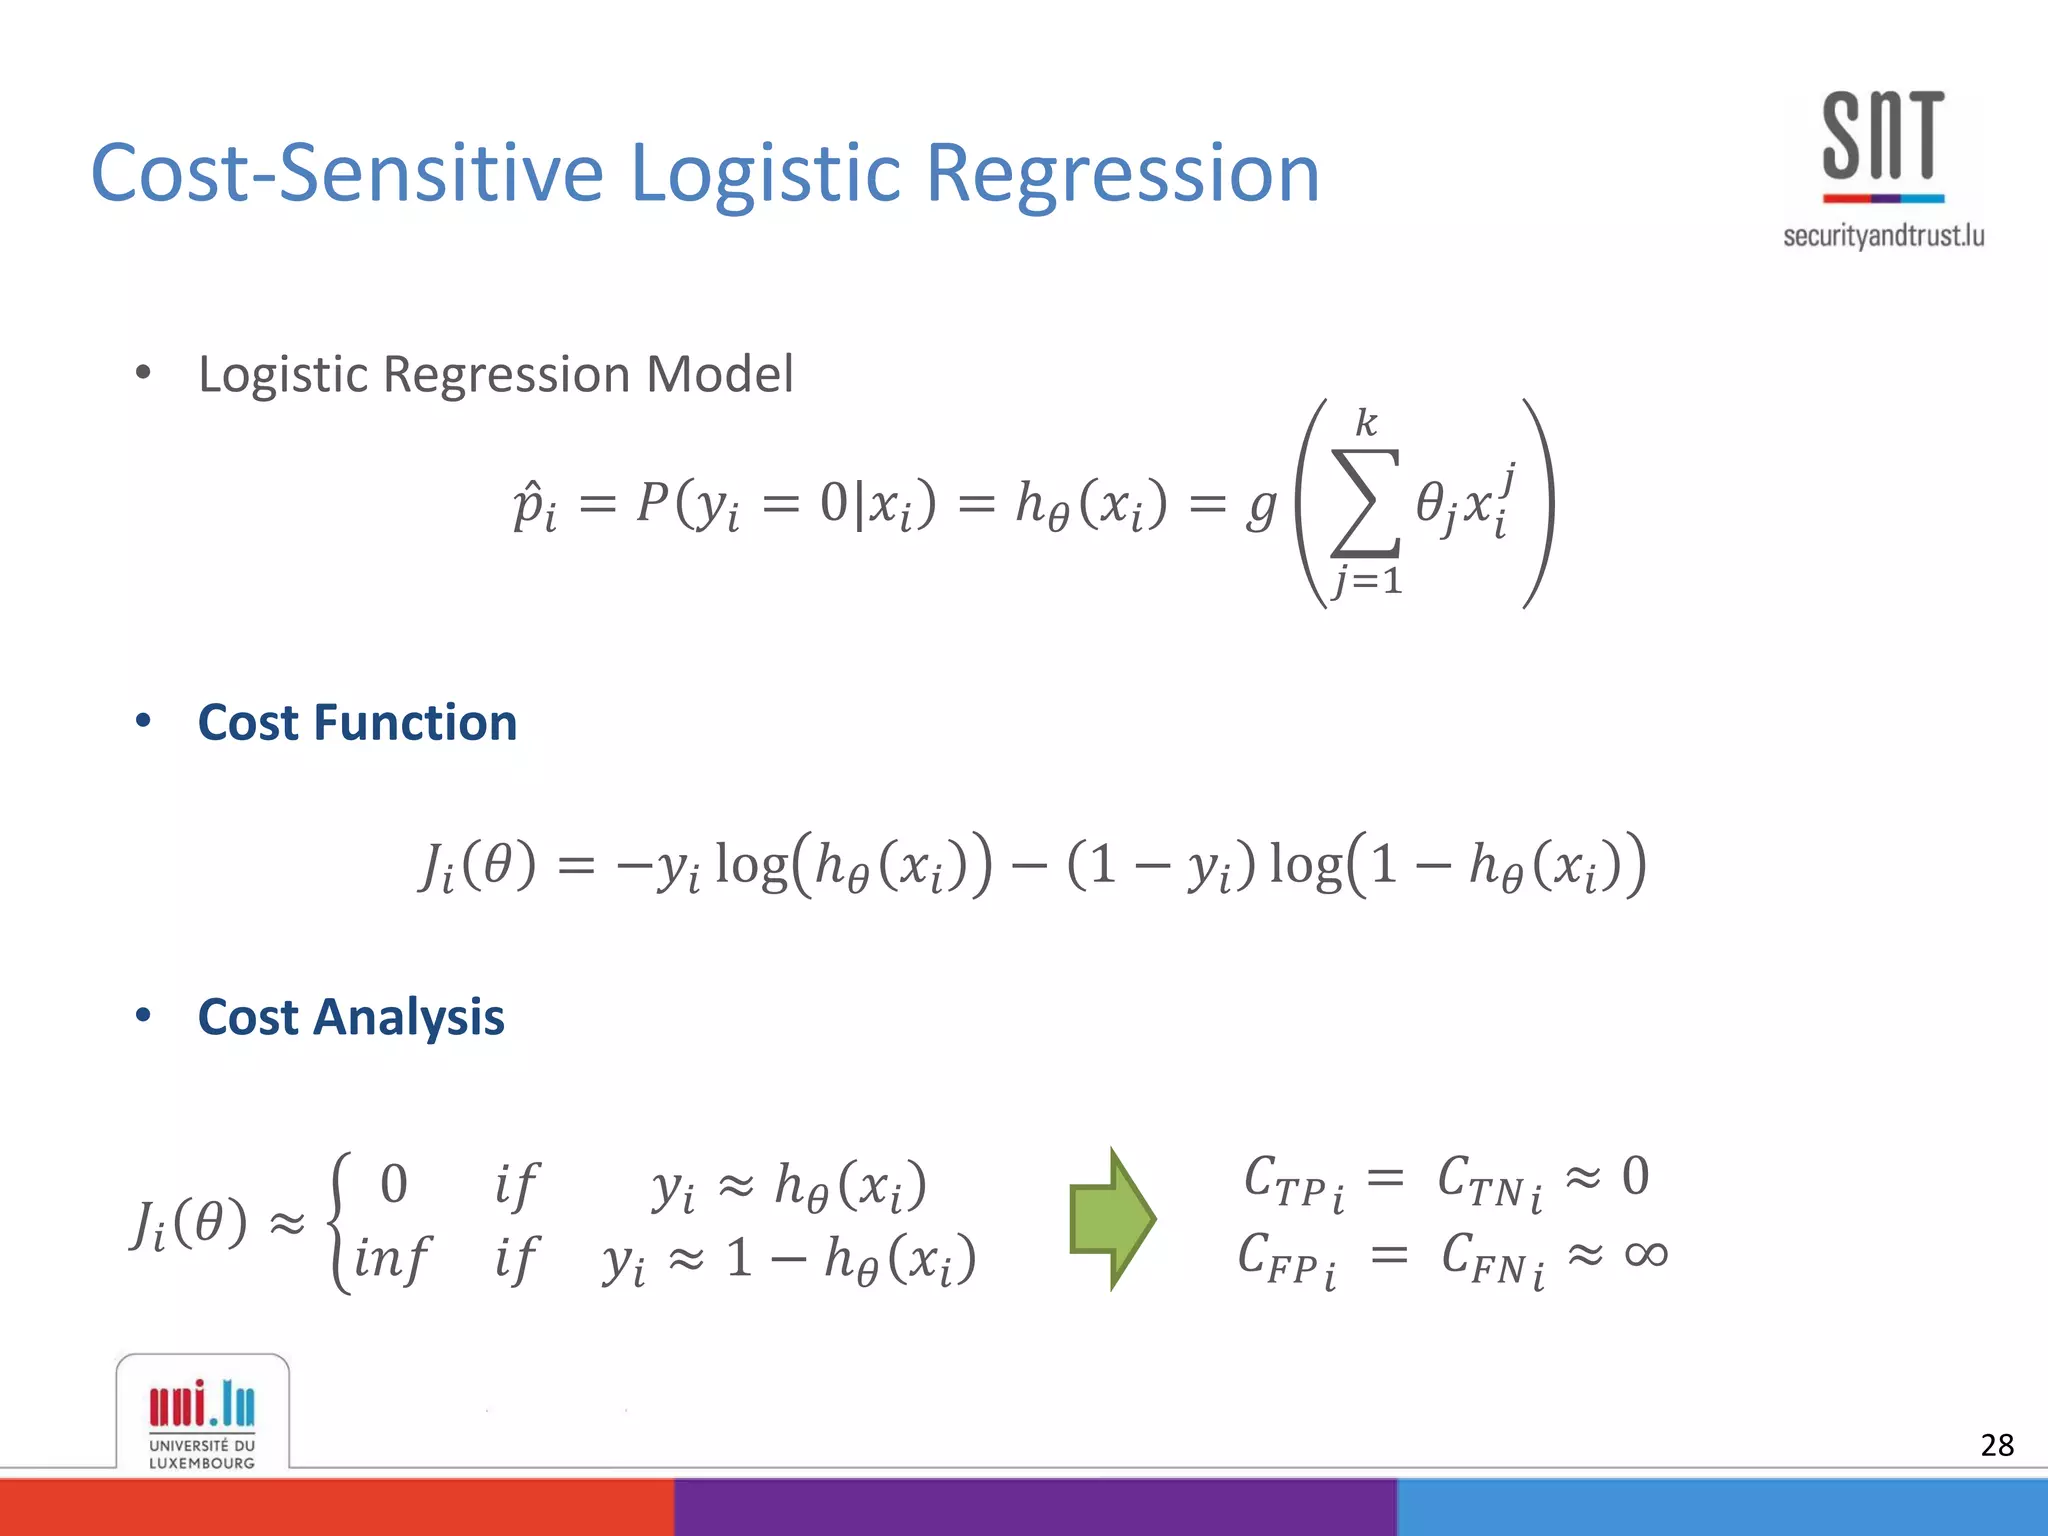
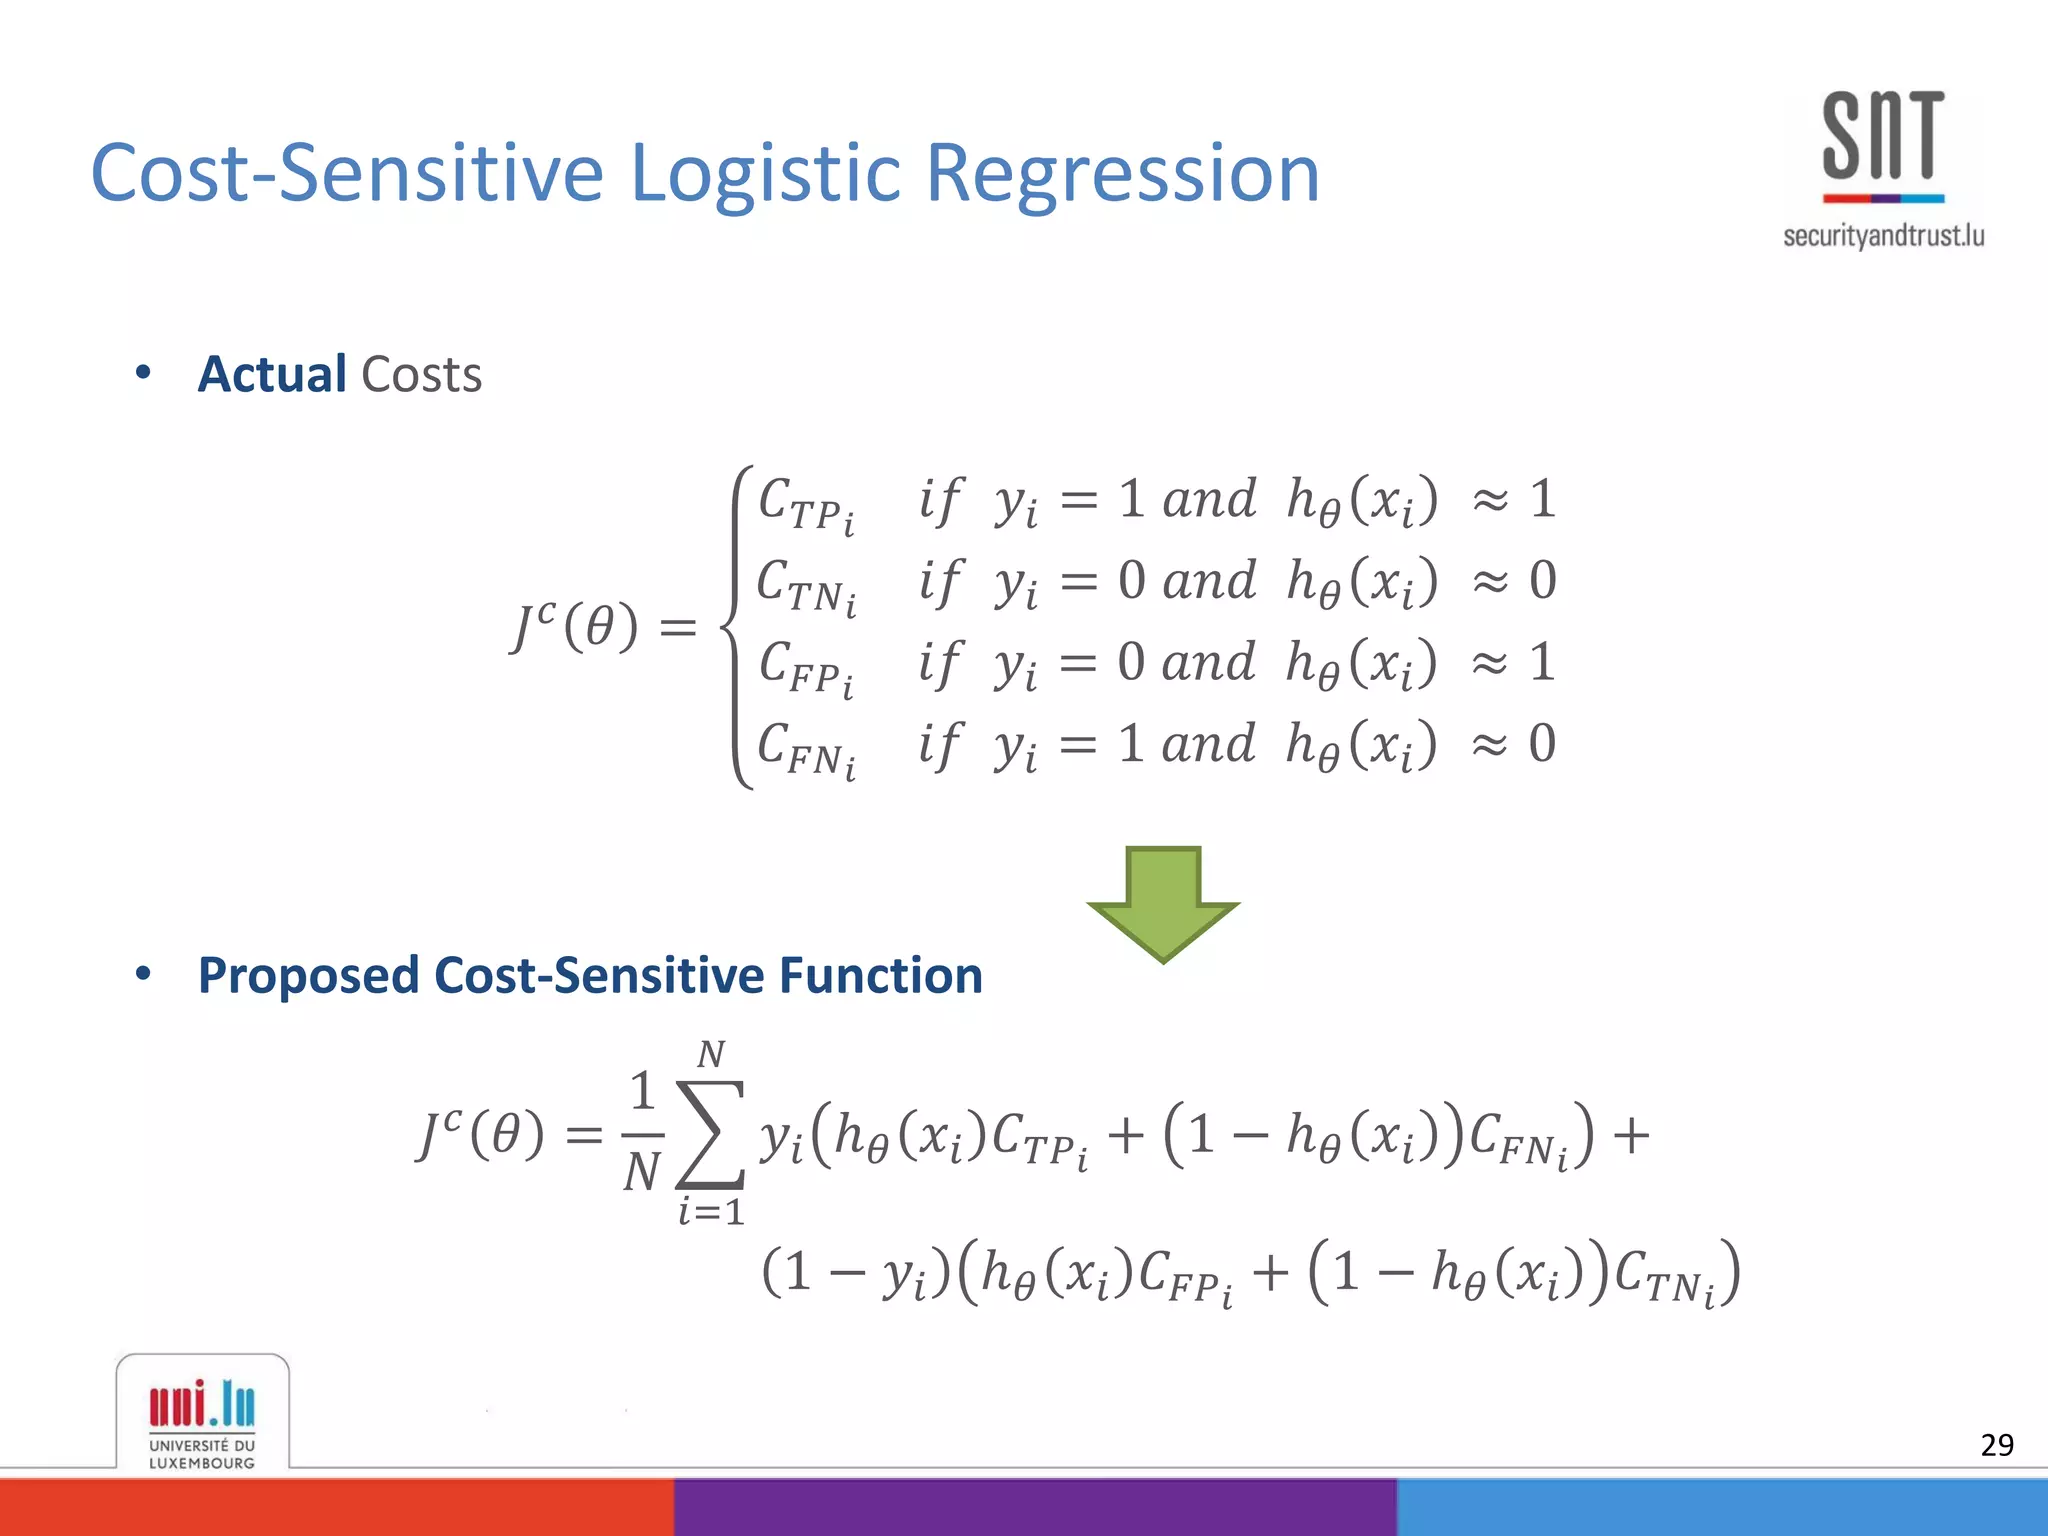
This document discusses example-dependent cost-sensitive classification techniques in financial risk modeling and marketing analytics, emphasizing their importance in real-world applications such as credit card fraud detection, churn modeling, credit scoring, and direct marketing. It outlines traditional classification methods' limitations concerning misclassification costs and proposes cost-sensitive algorithms, including Bayes minimum risk and cost-sensitive decision trees. The document also highlights the implications of these methodologies through experimental setups and results.


![[DSC Europe 25] Branko Urosevic -Rethinking Financial Talent: Integrating Cod...](https://cdn.slidesharecdn.com/ss_thumbnails/8jjrus8ttko6qj64f58f-3-251212103250-642c6374-thumbnail.jpg?width=640&height=640&fit=bounds)
![[DSC Europe 25] Hans Kleinsman - The Compliance Gearbox: How Tax Tech Mediate...](https://cdn.slidesharecdn.com/ss_thumbnails/dxdytie1toel0hr90bjs-2-251212103250-174fdbe7-thumbnail.jpg?width=640&height=640&fit=bounds)


![[DSC Europe 25] Debmalya Biswas - Agentification: the art of transforming man...](https://cdn.slidesharecdn.com/ss_thumbnails/r5azlggvtqiaiiusrqdr-4-251212103249-5a12c89b-thumbnail.jpg?width=640&height=640&fit=bounds)
![[DSC Europe 25] Jovan Bogicevic - Legacy to AI-Driven Defense: Transforming D...](https://cdn.slidesharecdn.com/ss_thumbnails/rsarluadt563hntyfc8q-3-251211083849-3e7bc4c0-thumbnail.jpg?width=640&height=640&fit=bounds)


![[DSC Europe 25] Dusan Nesic - Securing Tomorrow’s Infrastructure: Why Cyber-P...](https://cdn.slidesharecdn.com/ss_thumbnails/qikbszfftyowjm2q6duw-1-251211083848-8f2ead6b-thumbnail.jpg?width=640&height=640&fit=bounds)


![[DSC Europe 25] Bassam Maharmeh - Artificial Intelligence: Opportunities and ...](https://cdn.slidesharecdn.com/ss_thumbnails/thhfmr2fqpawzj7hsjpg-5-251211083048-2c23204f-thumbnail.jpg?width=640&height=640&fit=bounds)


