Download to read offline
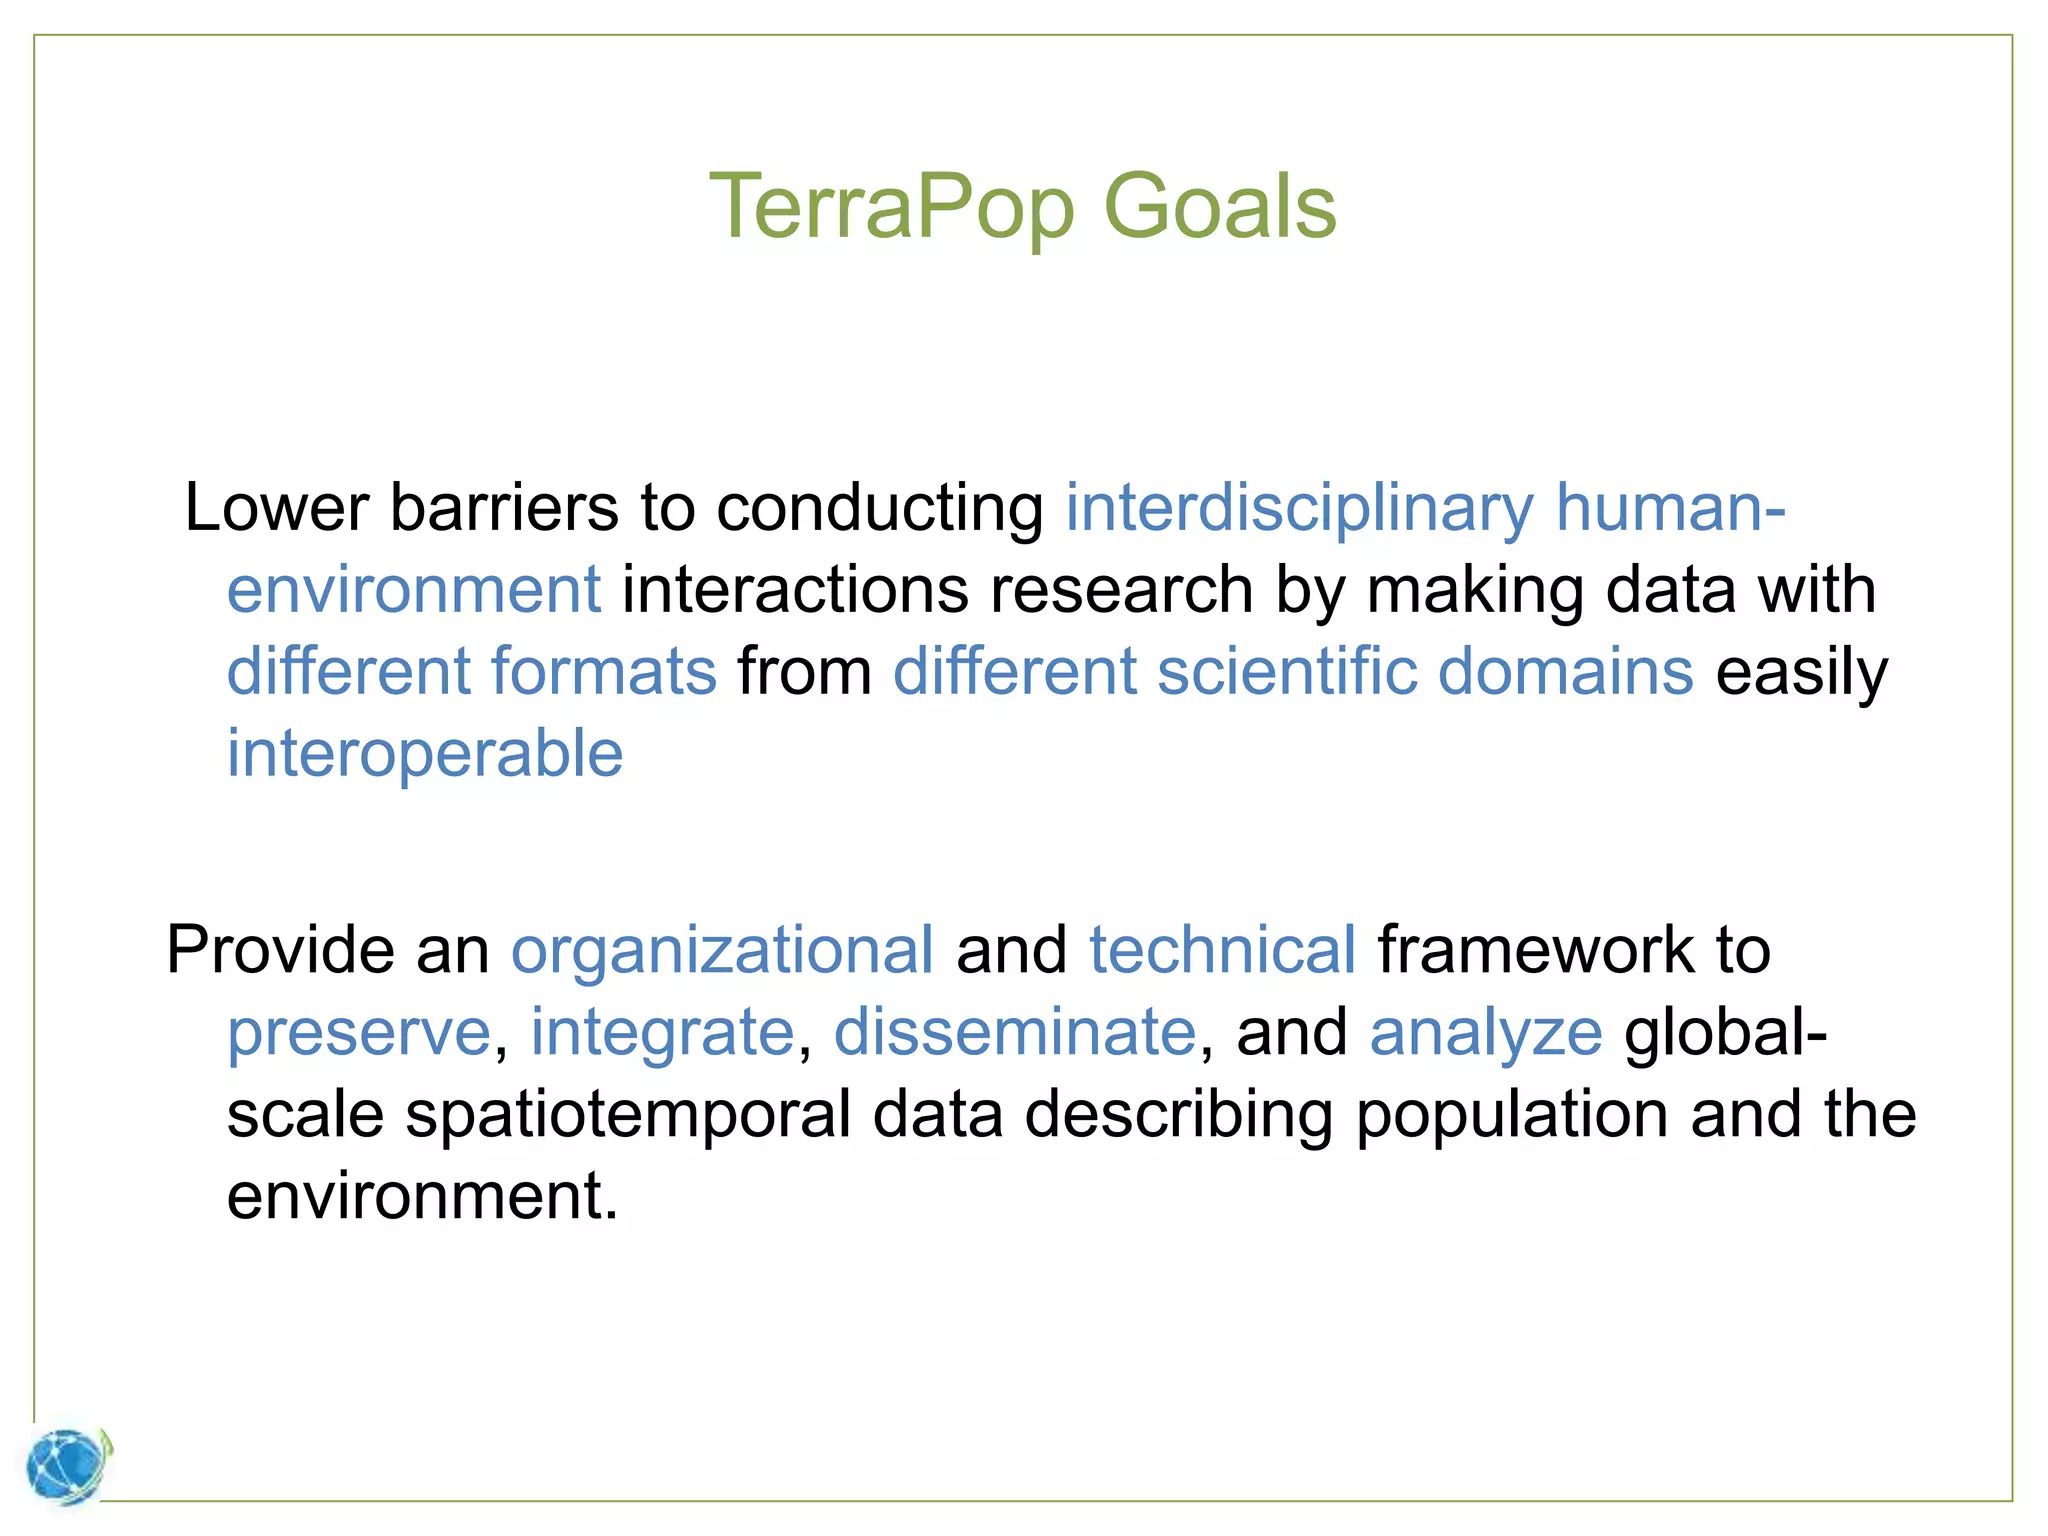
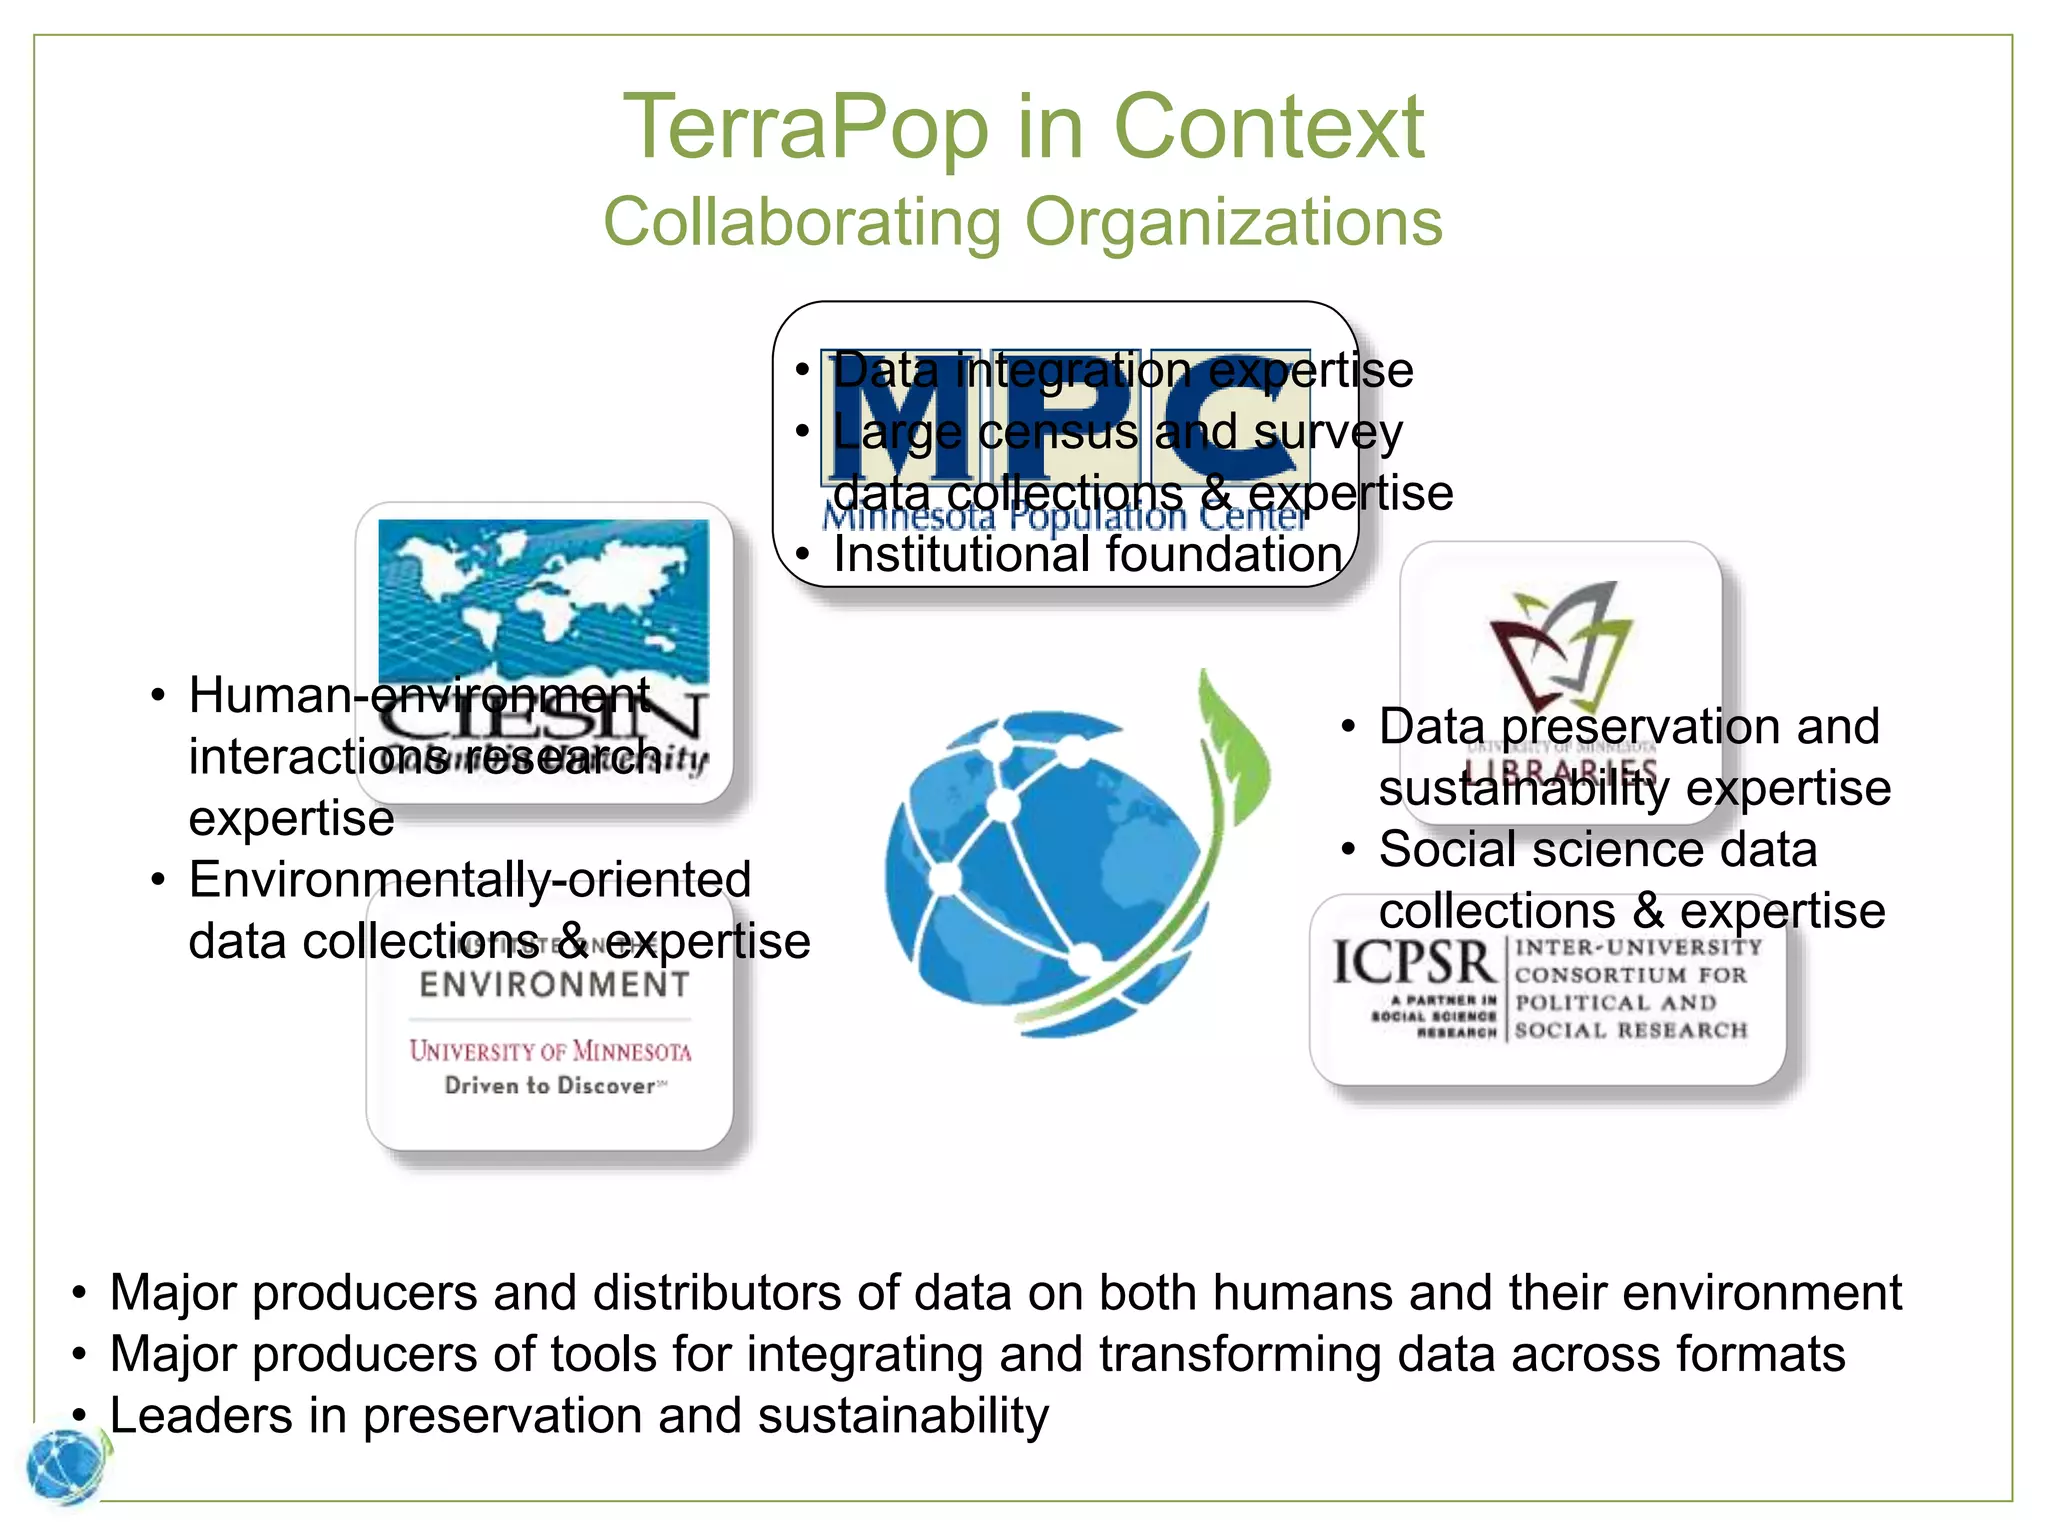
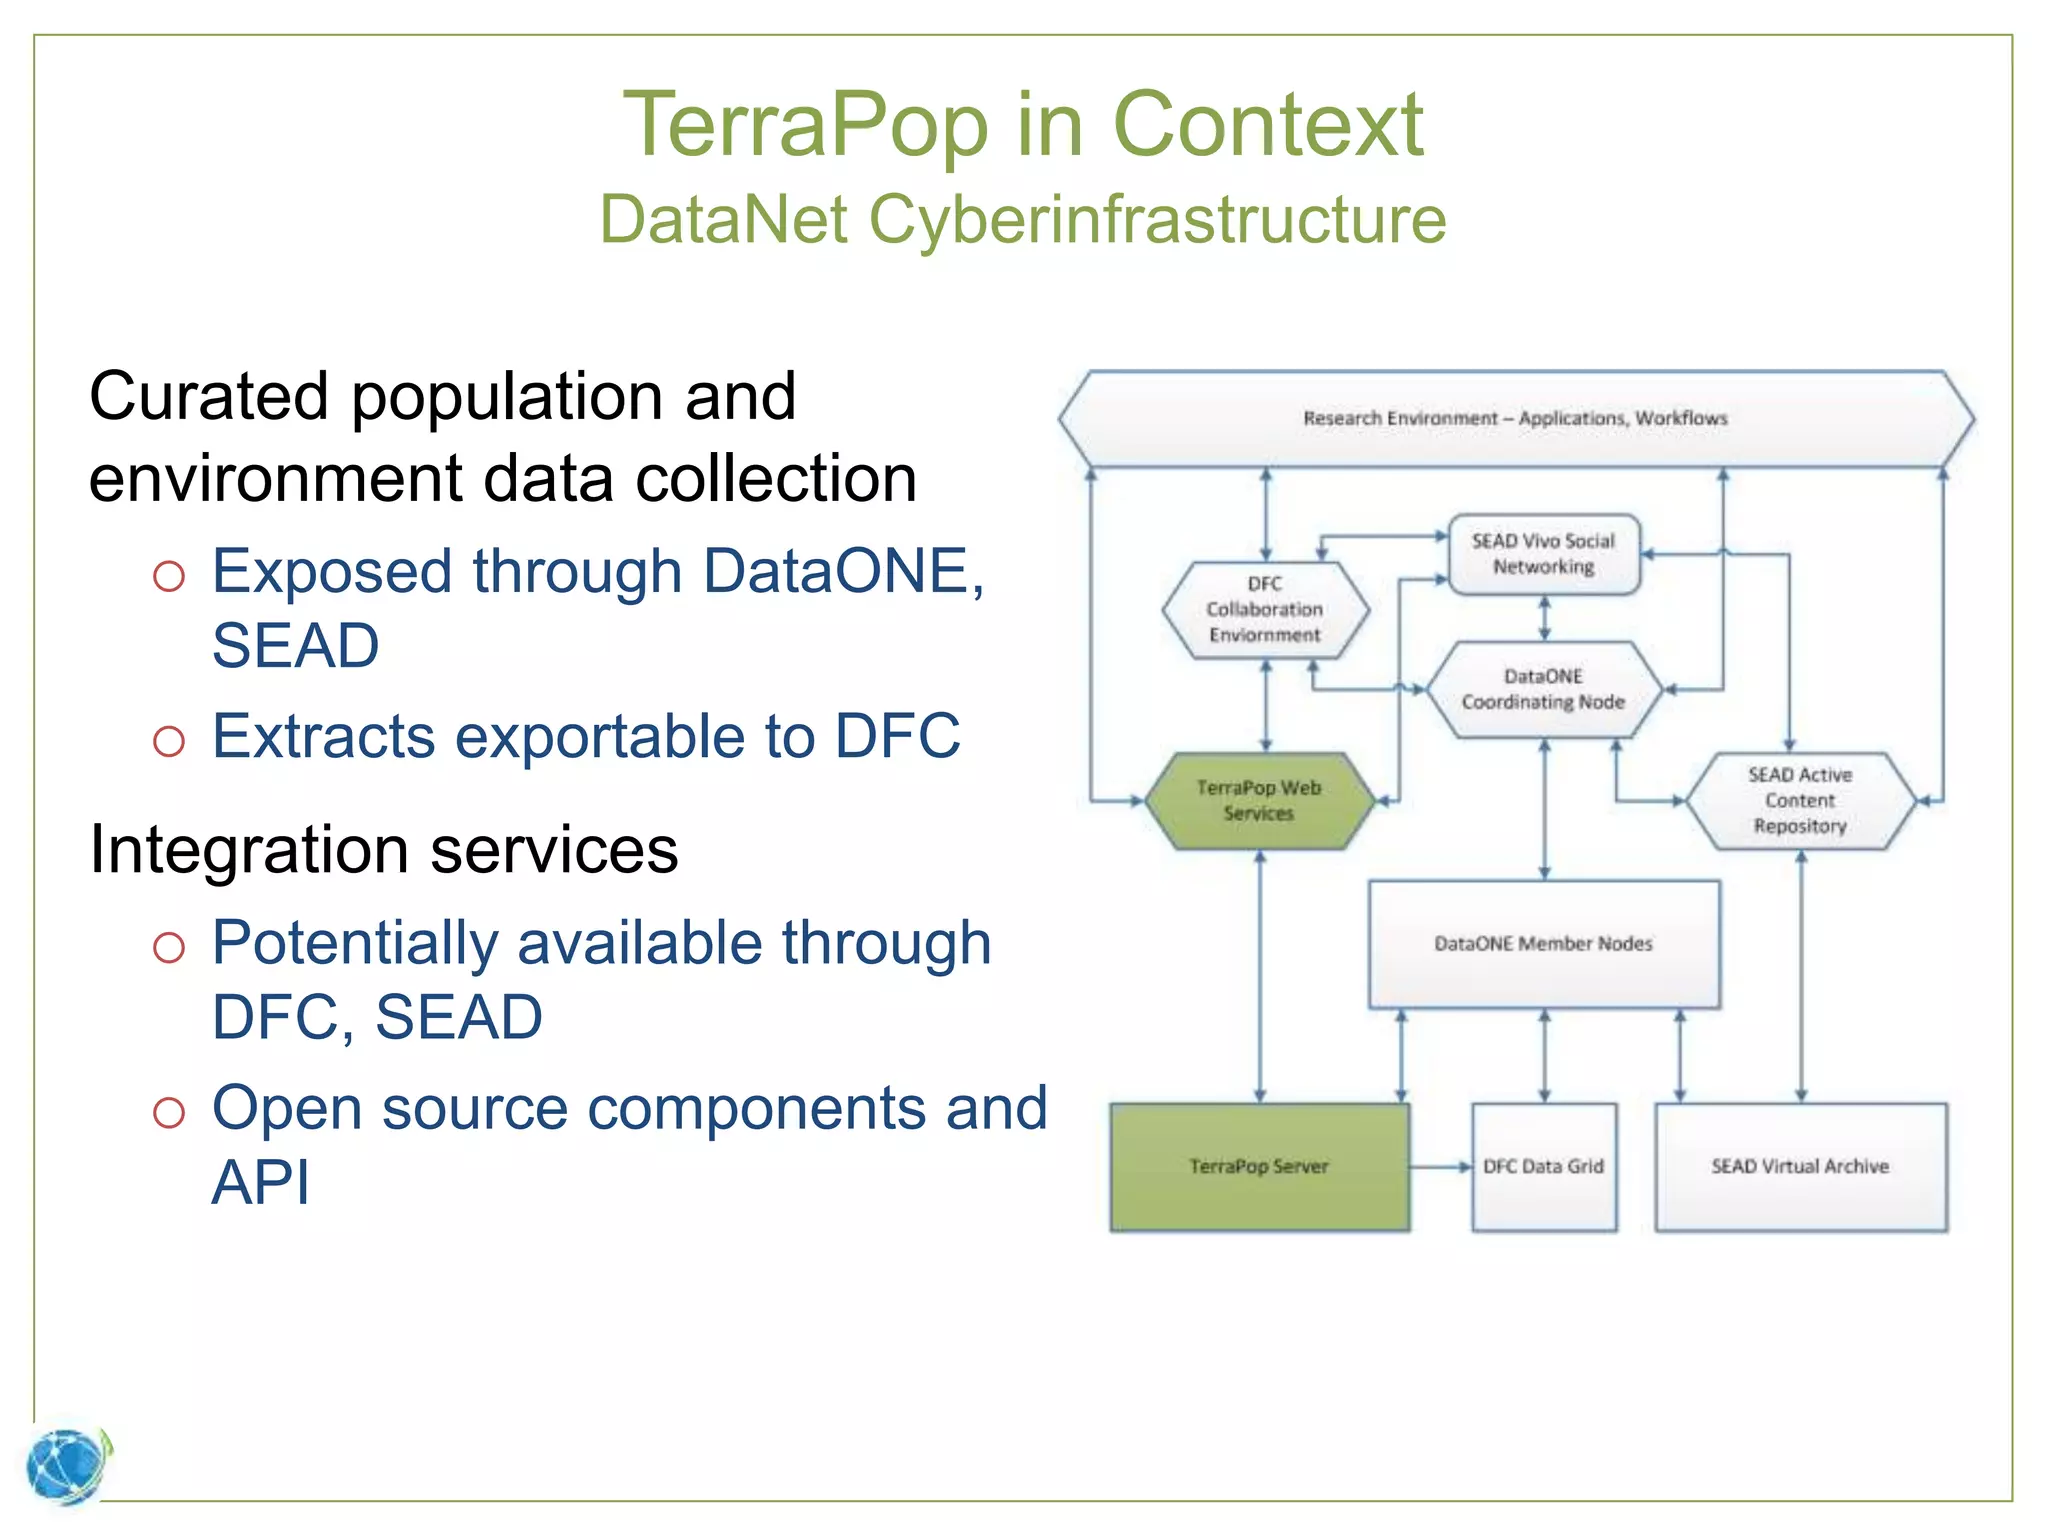
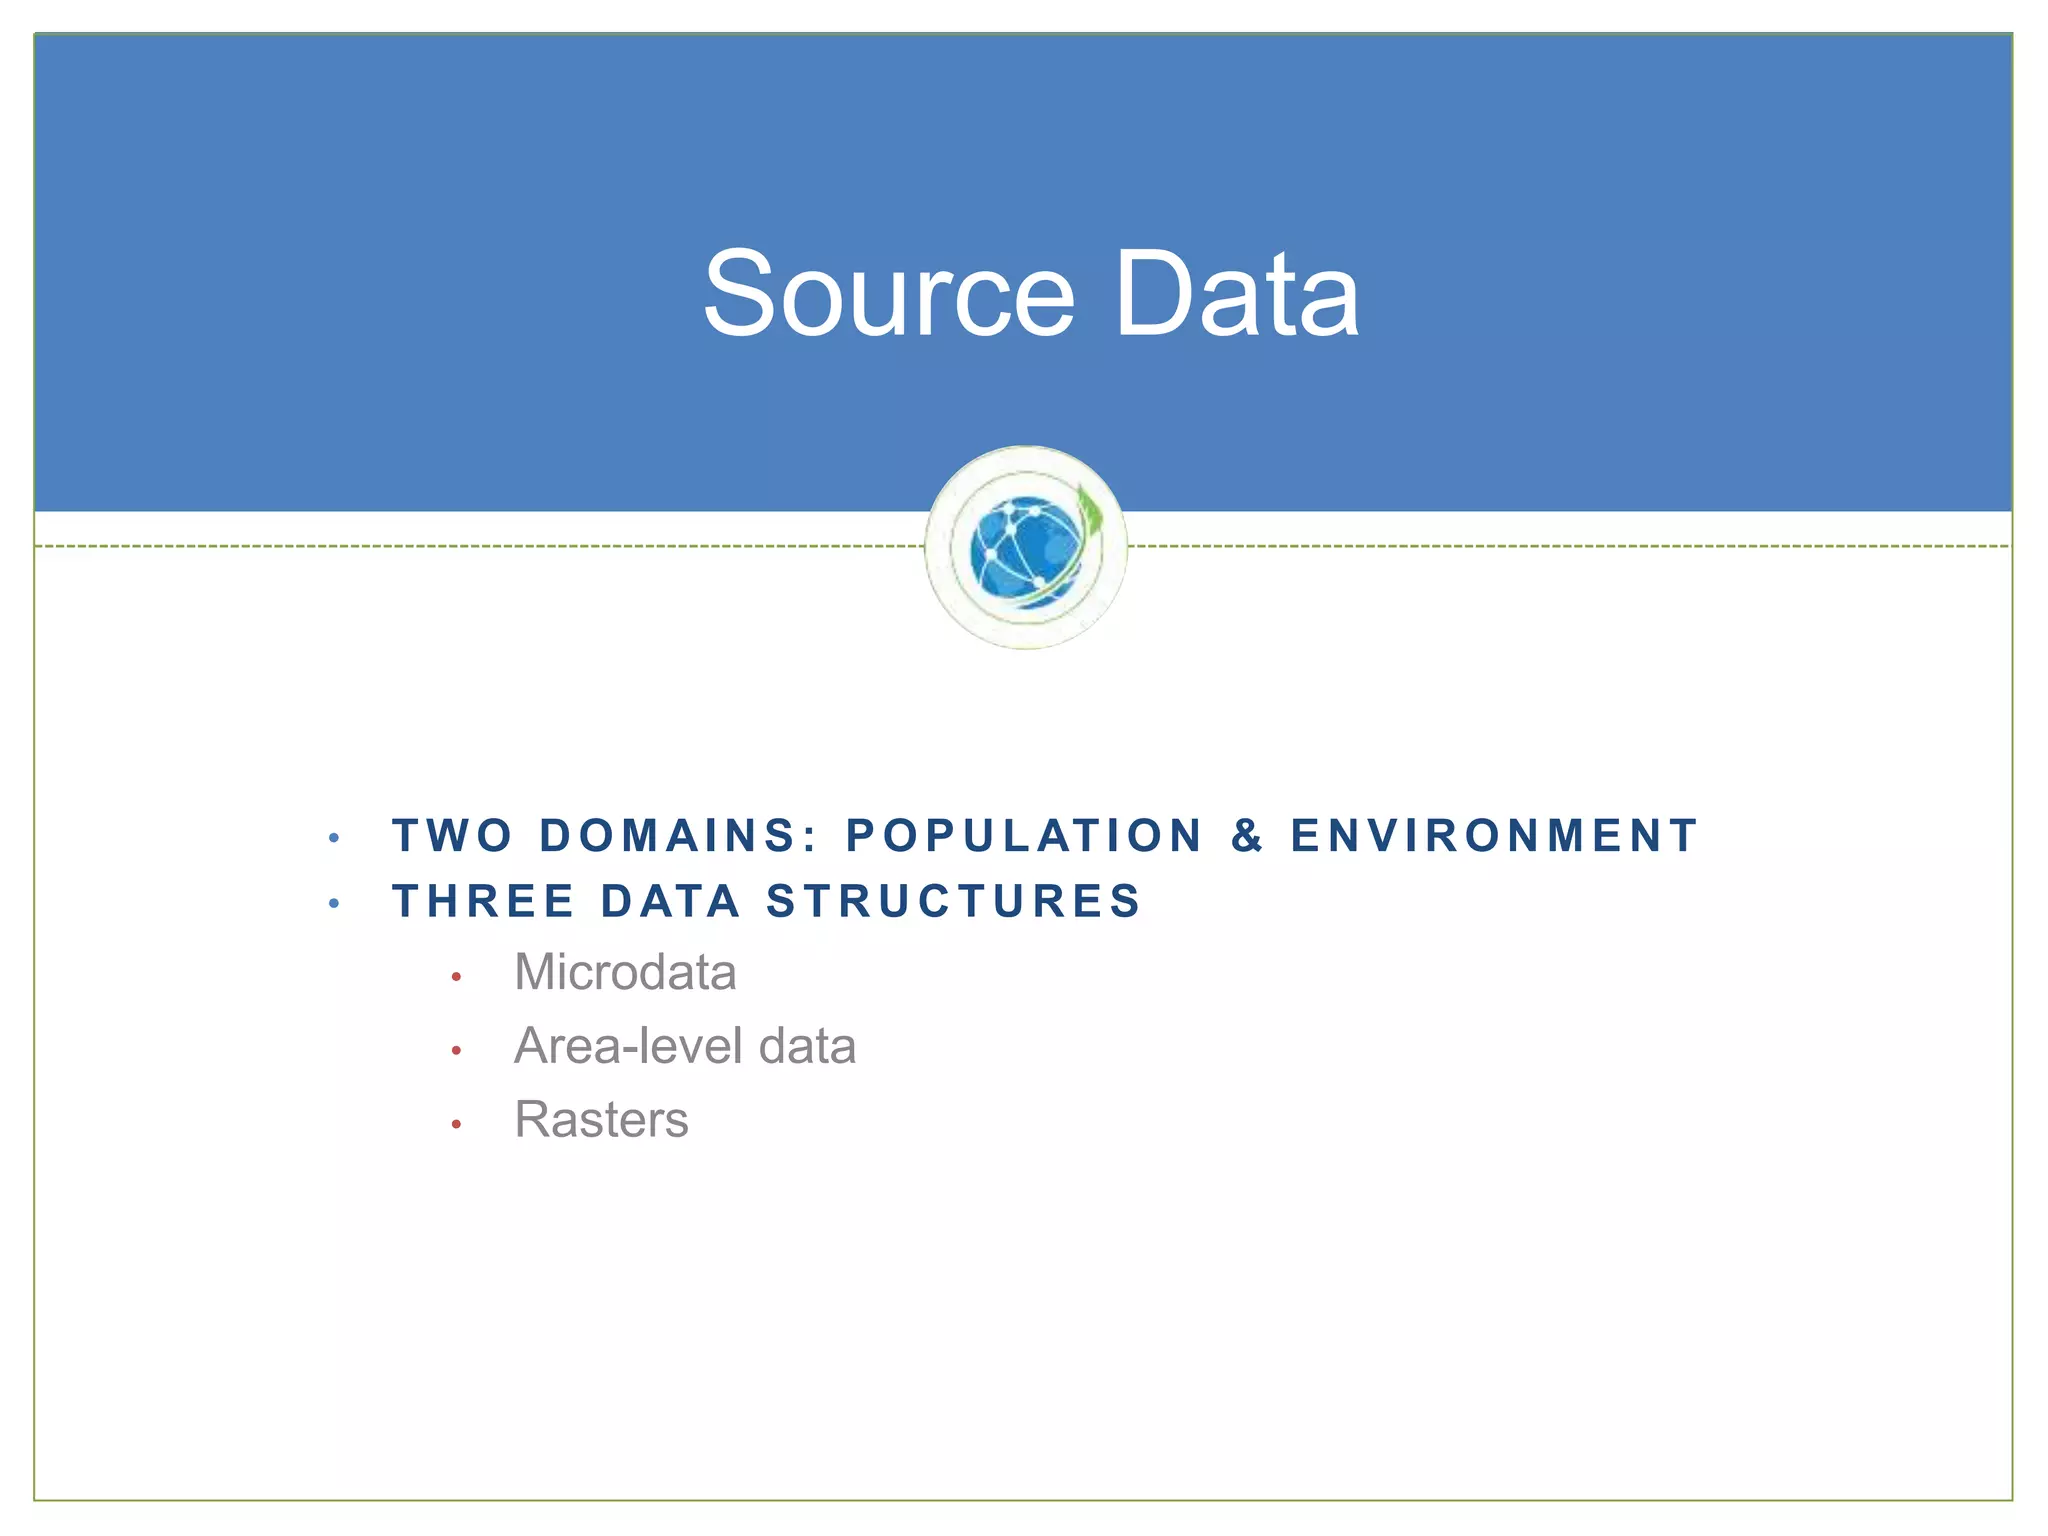
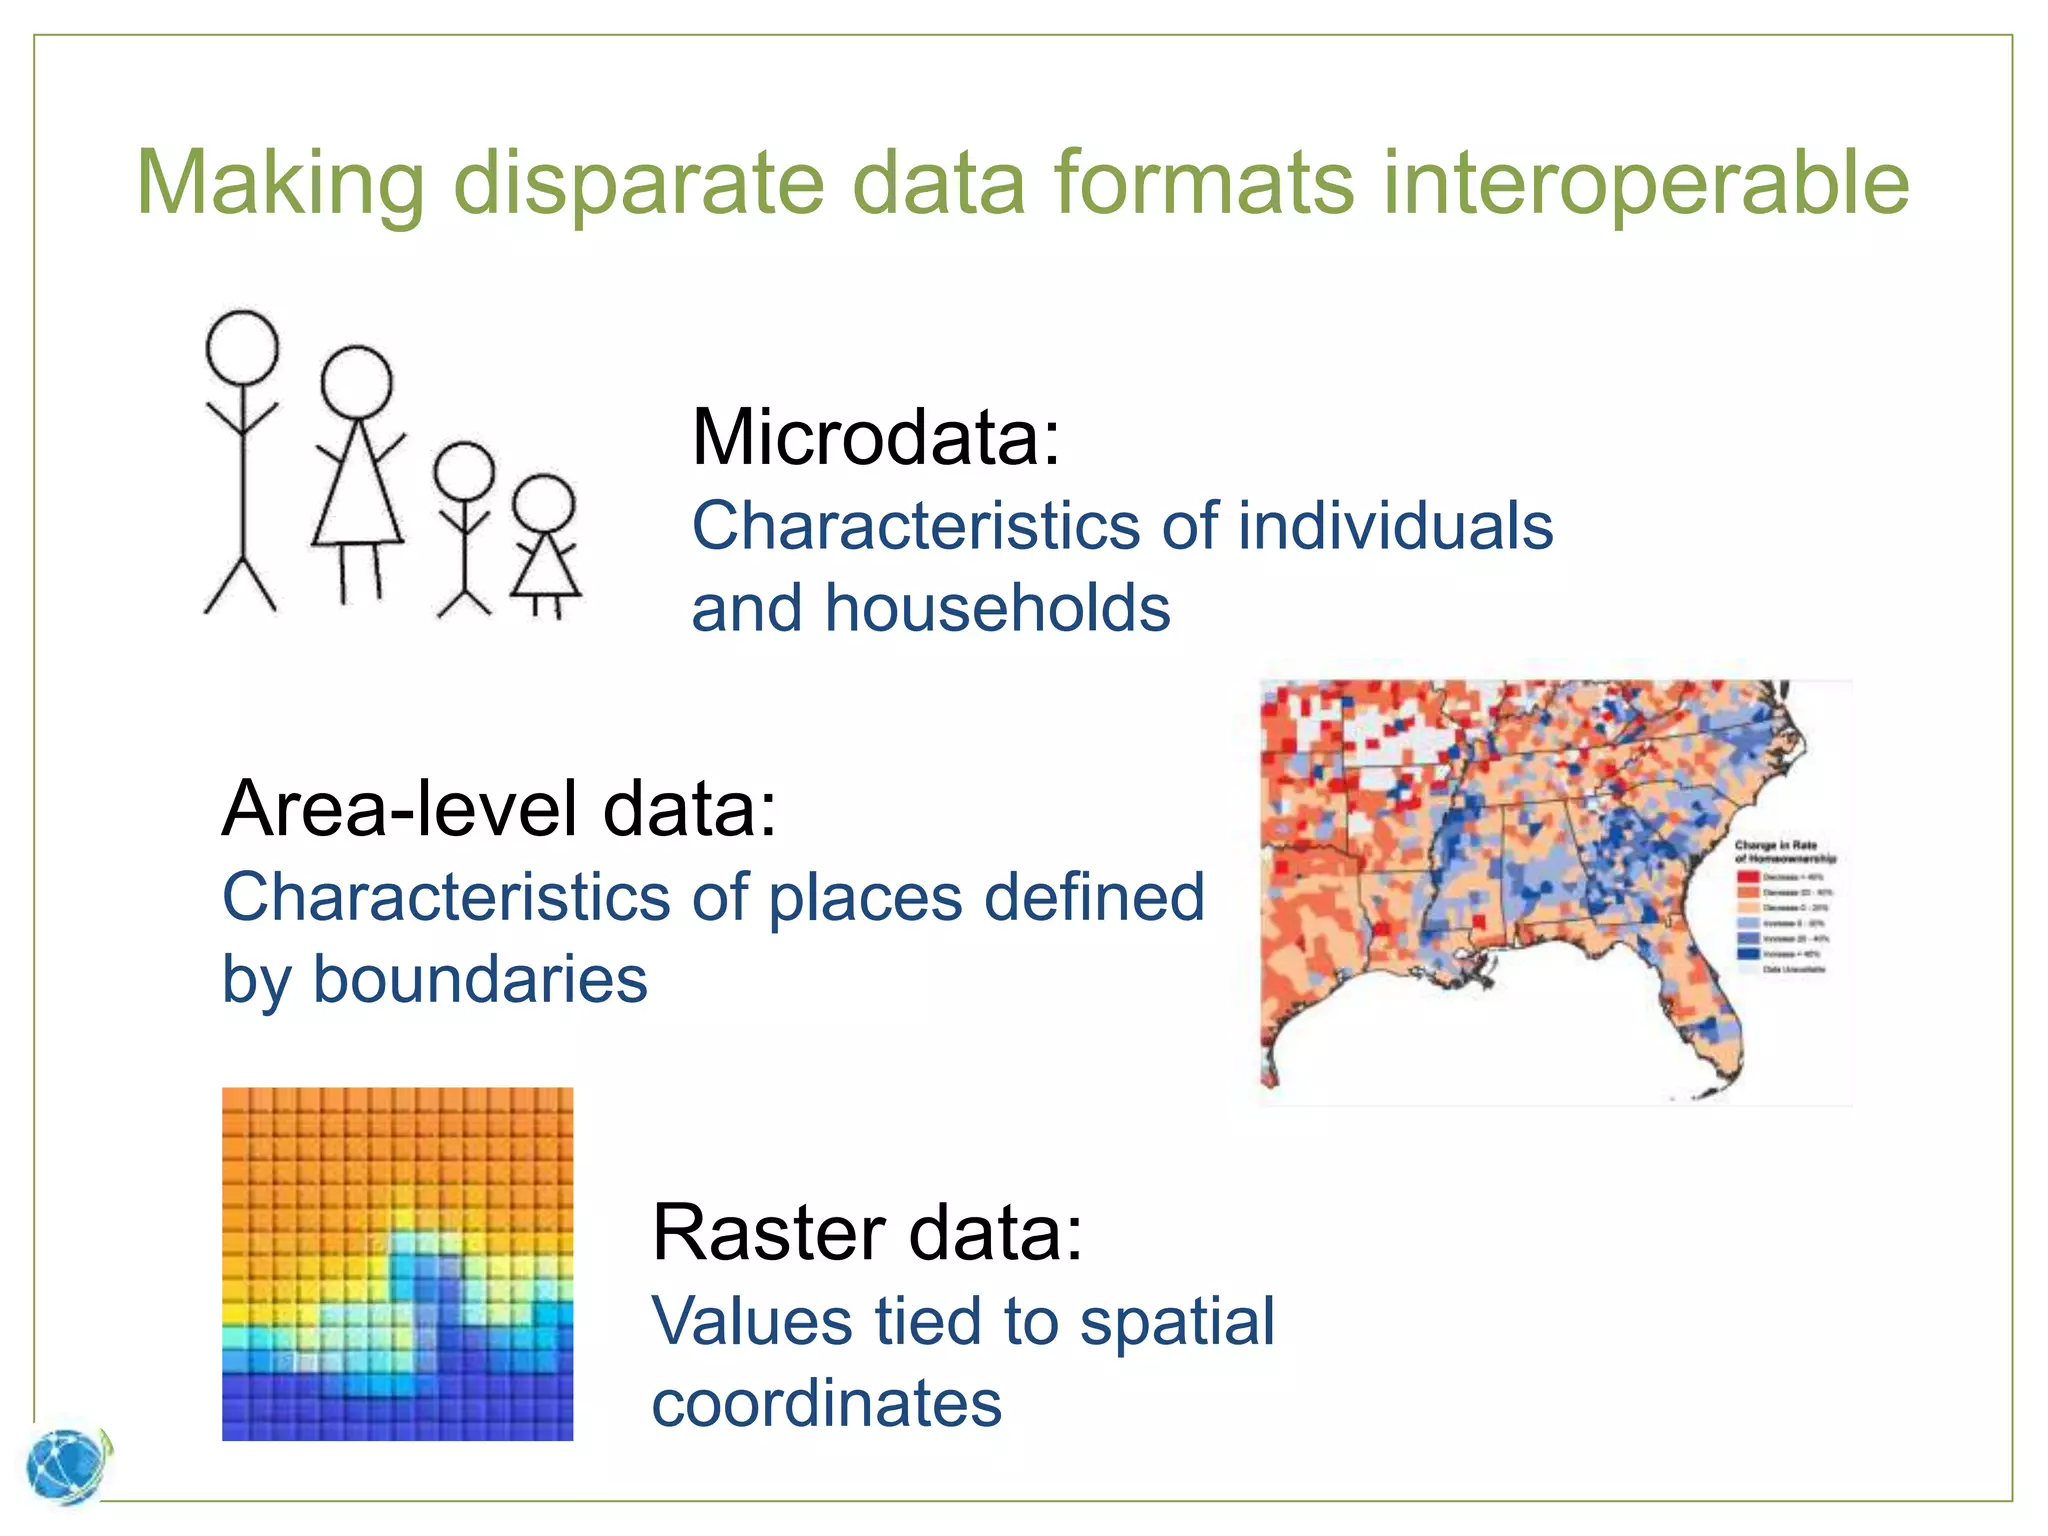
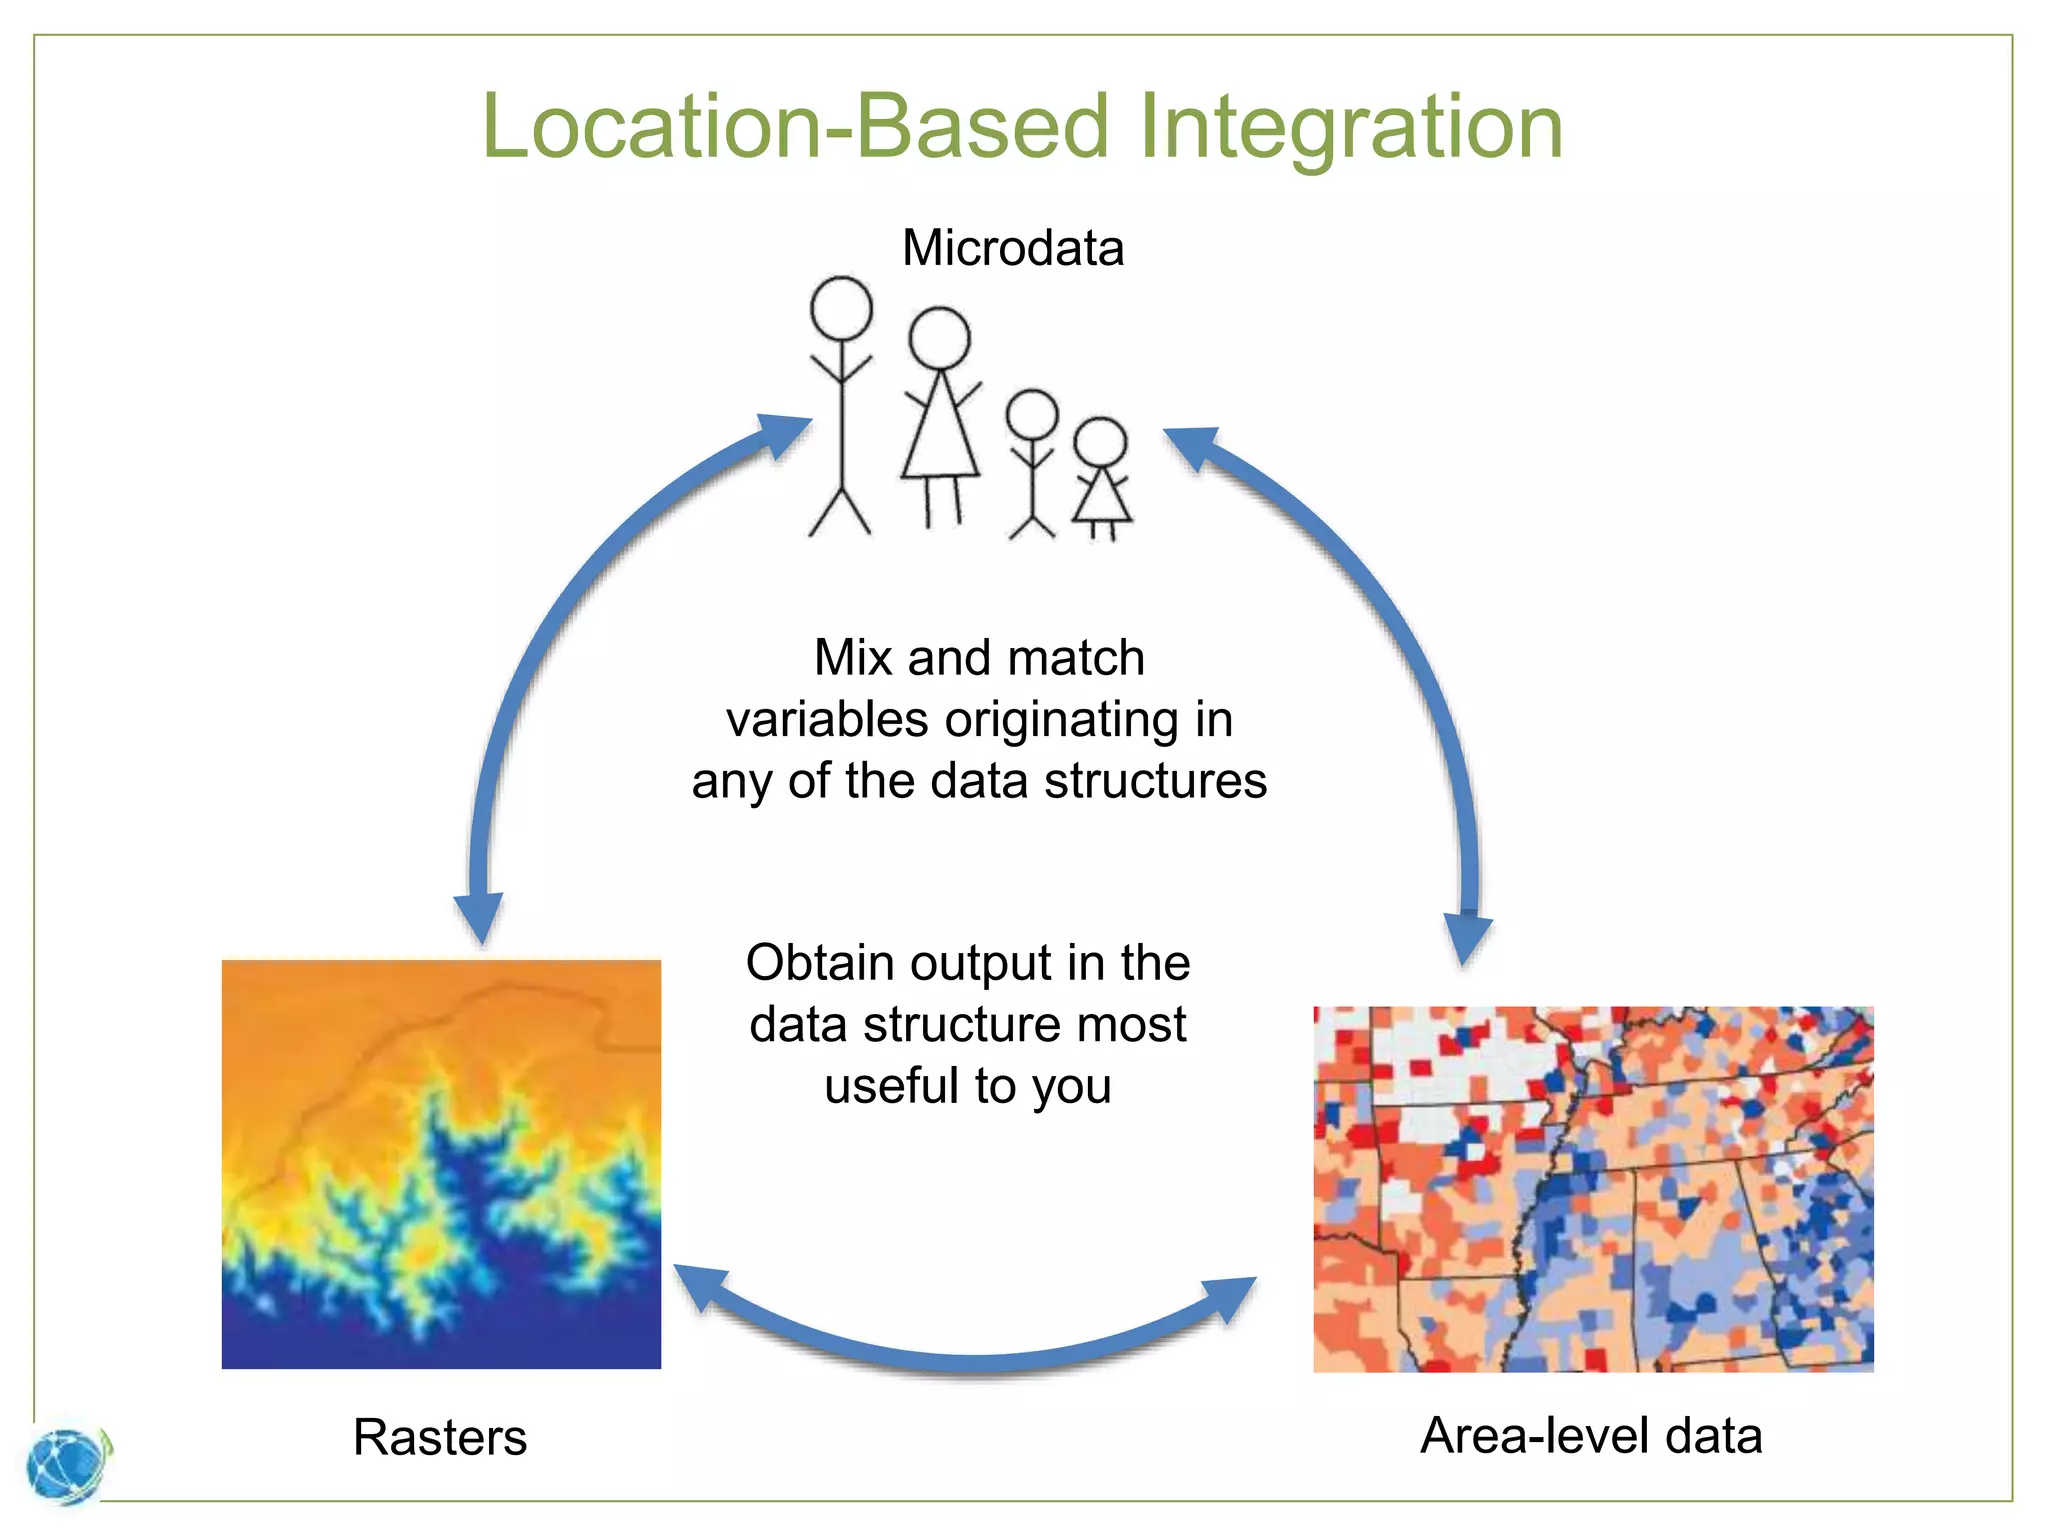
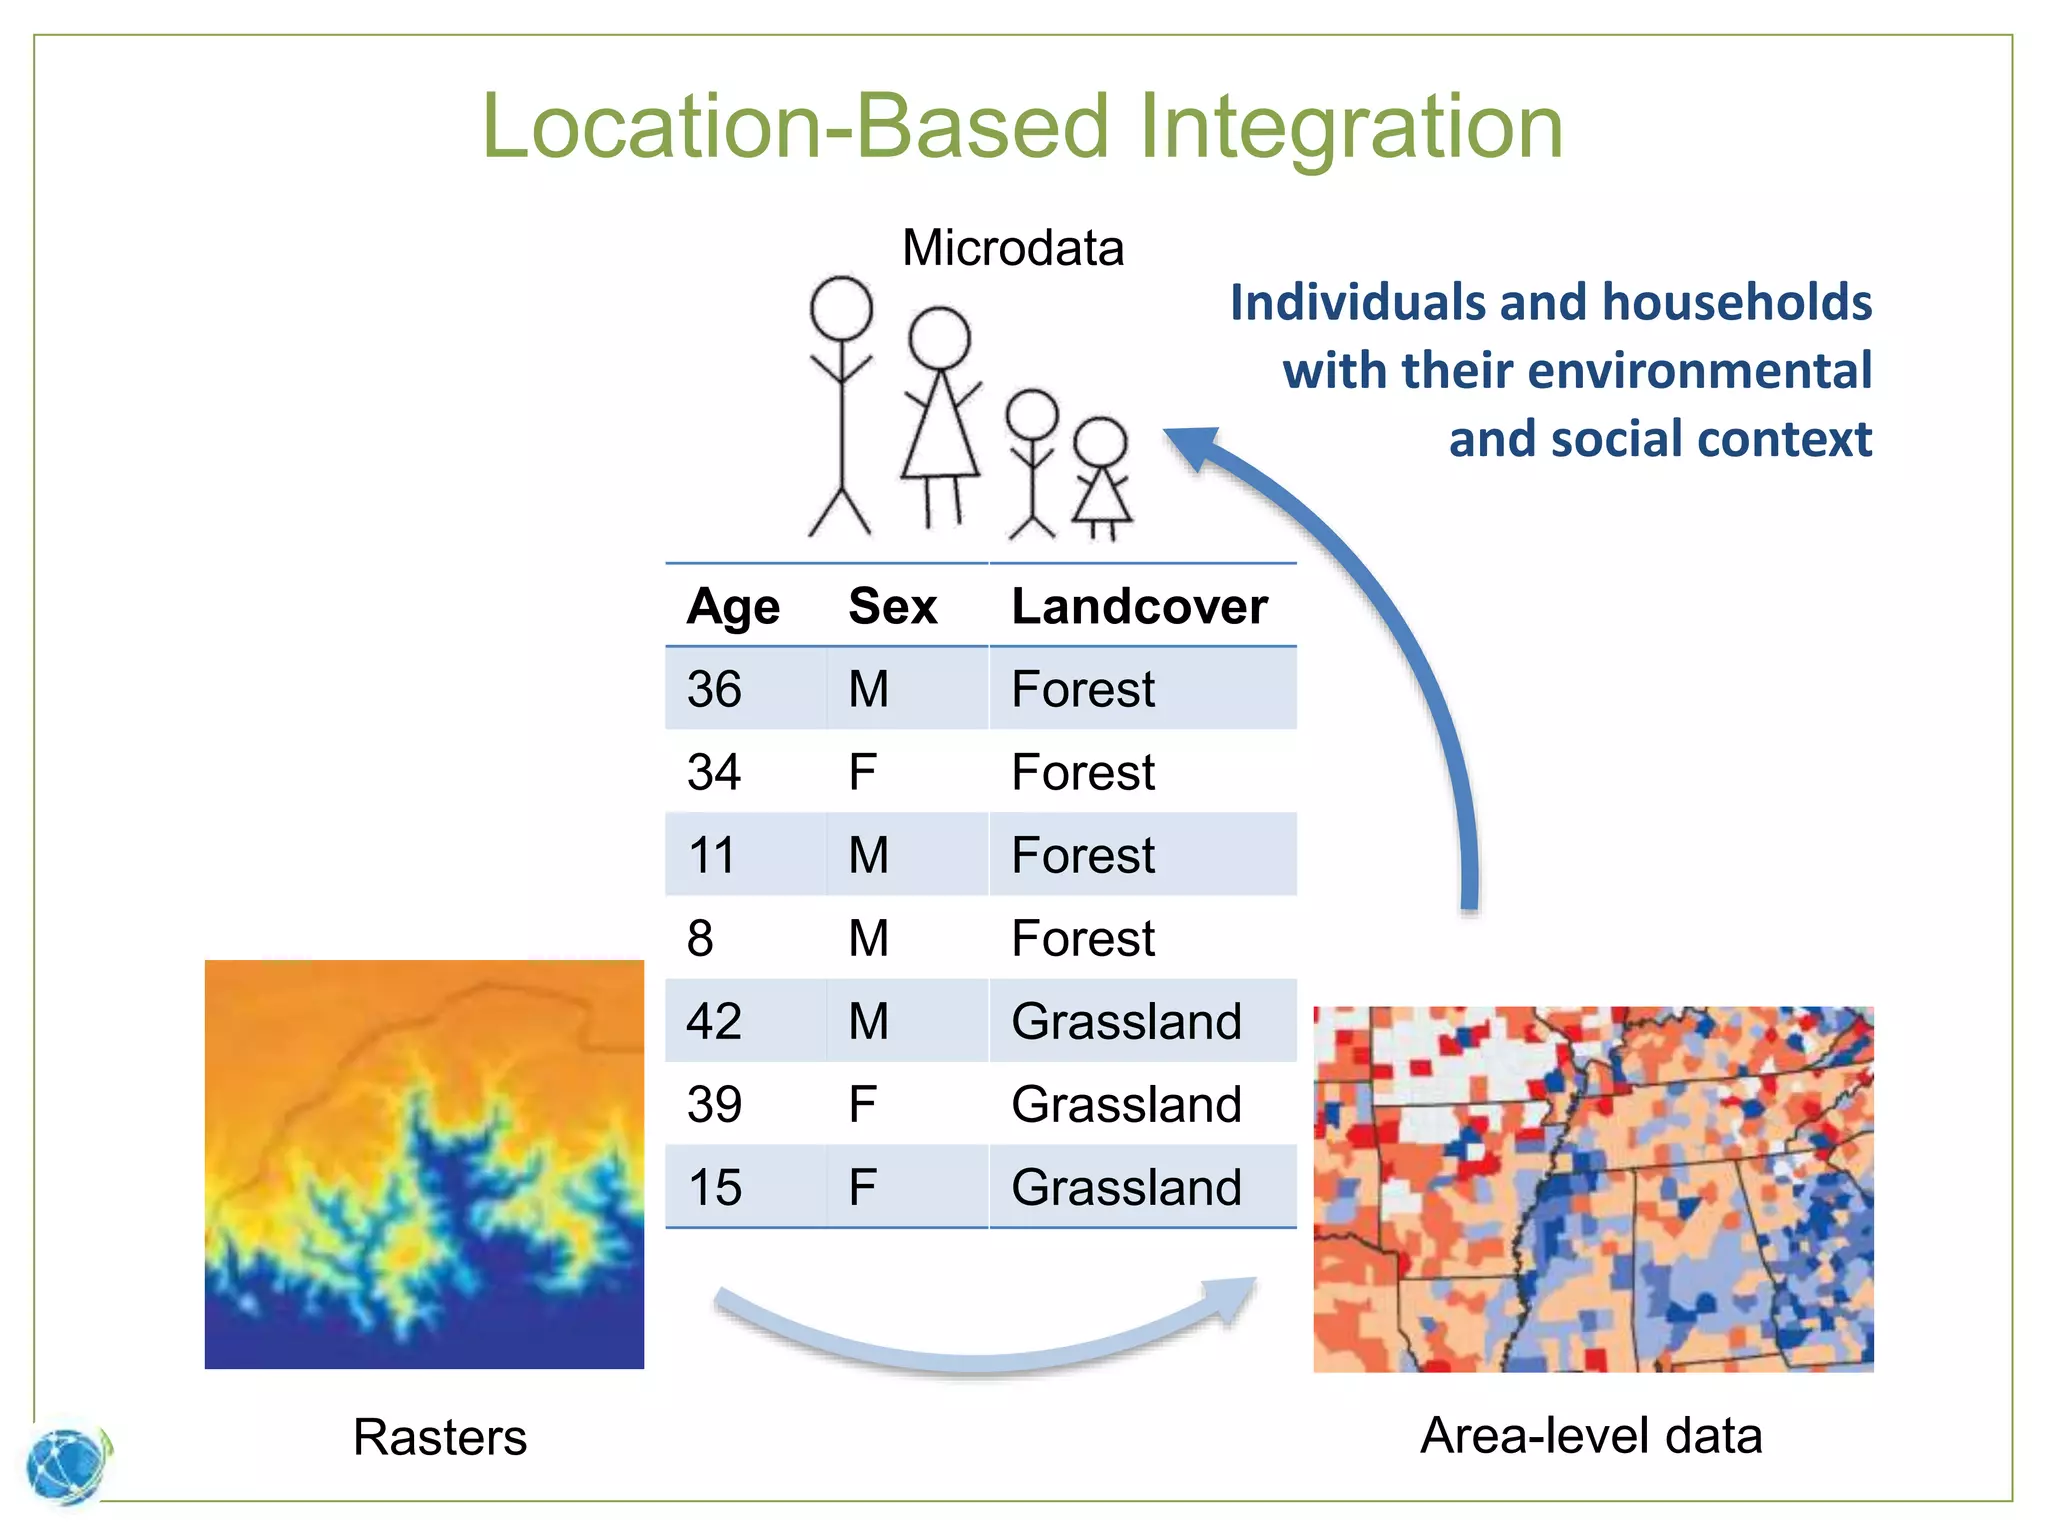
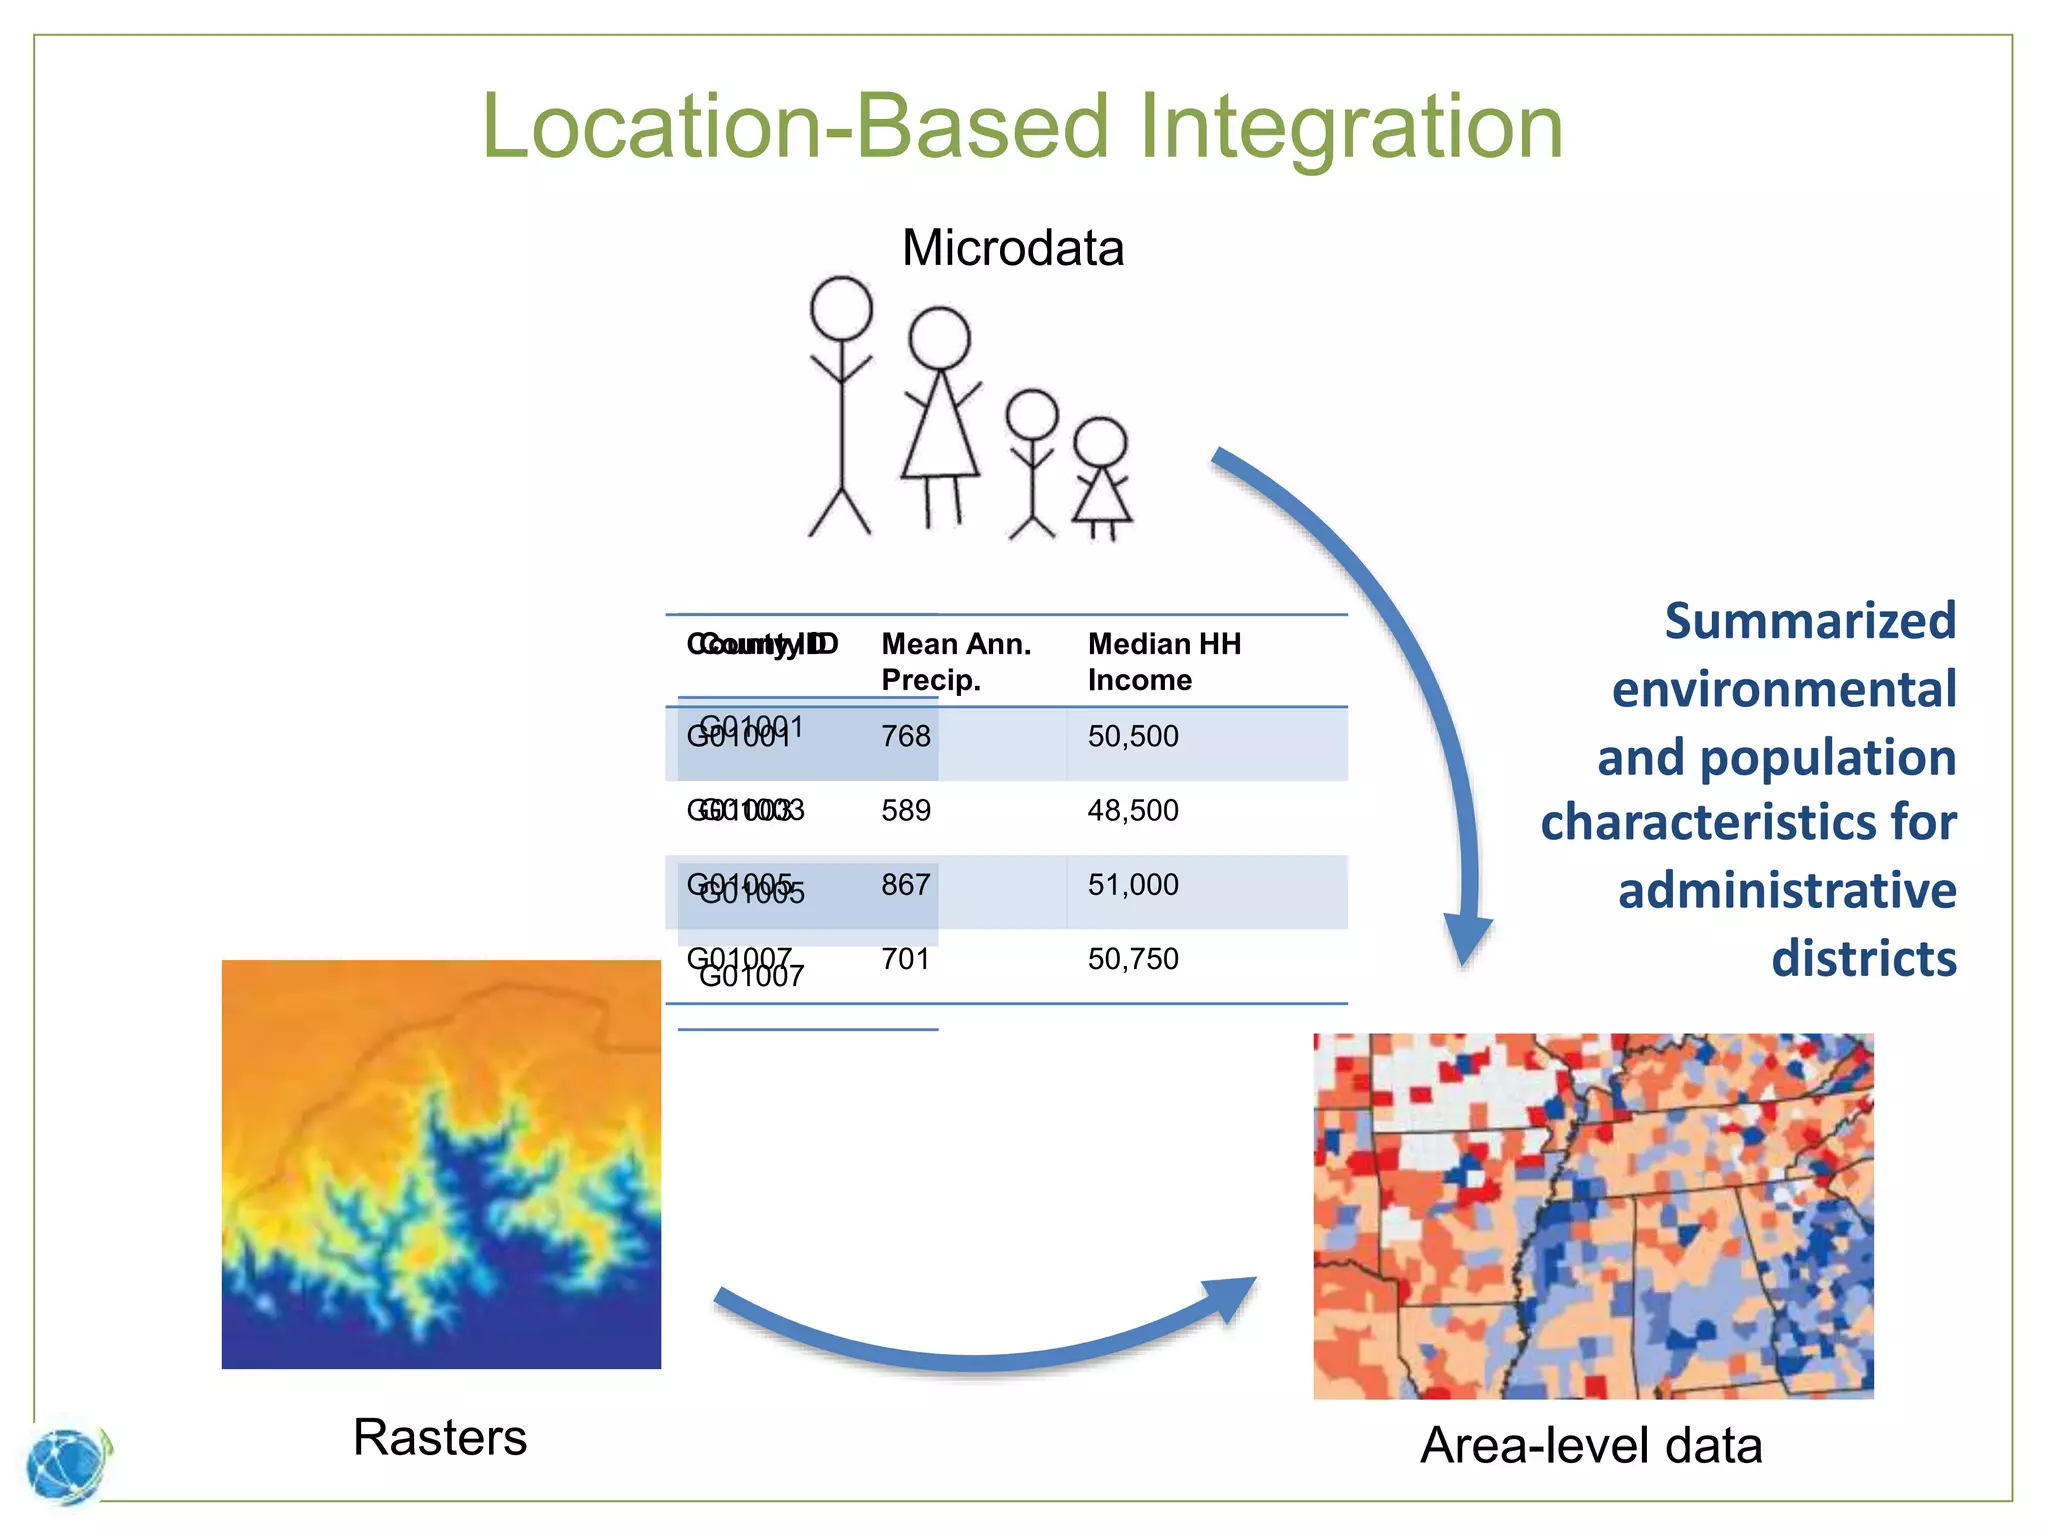
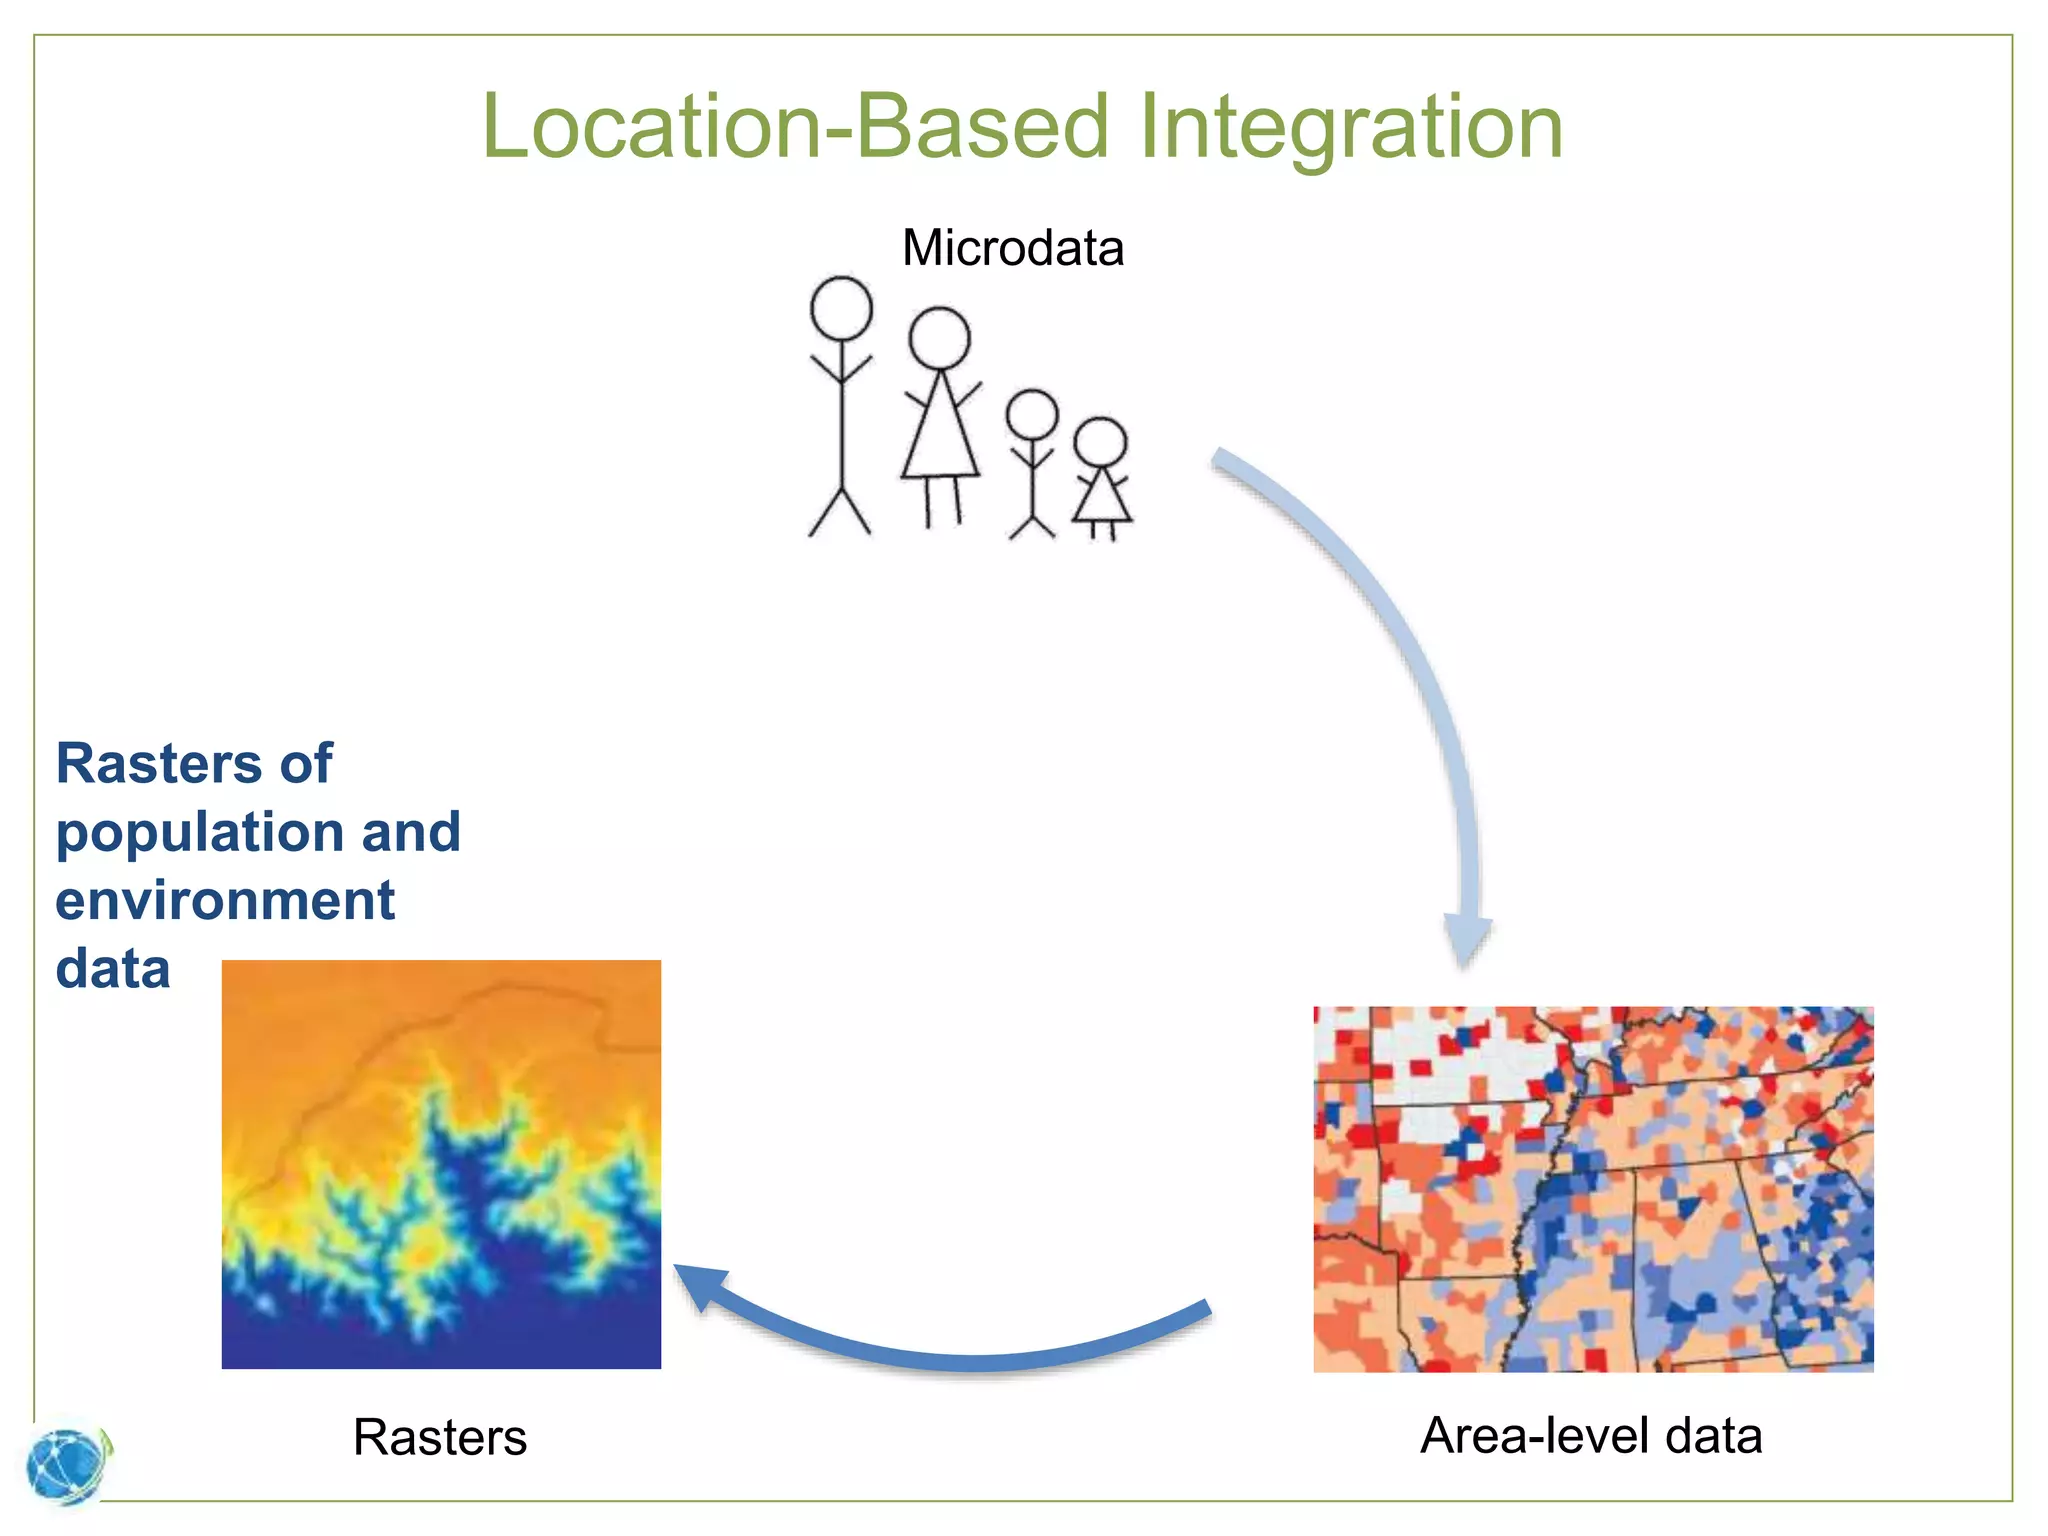
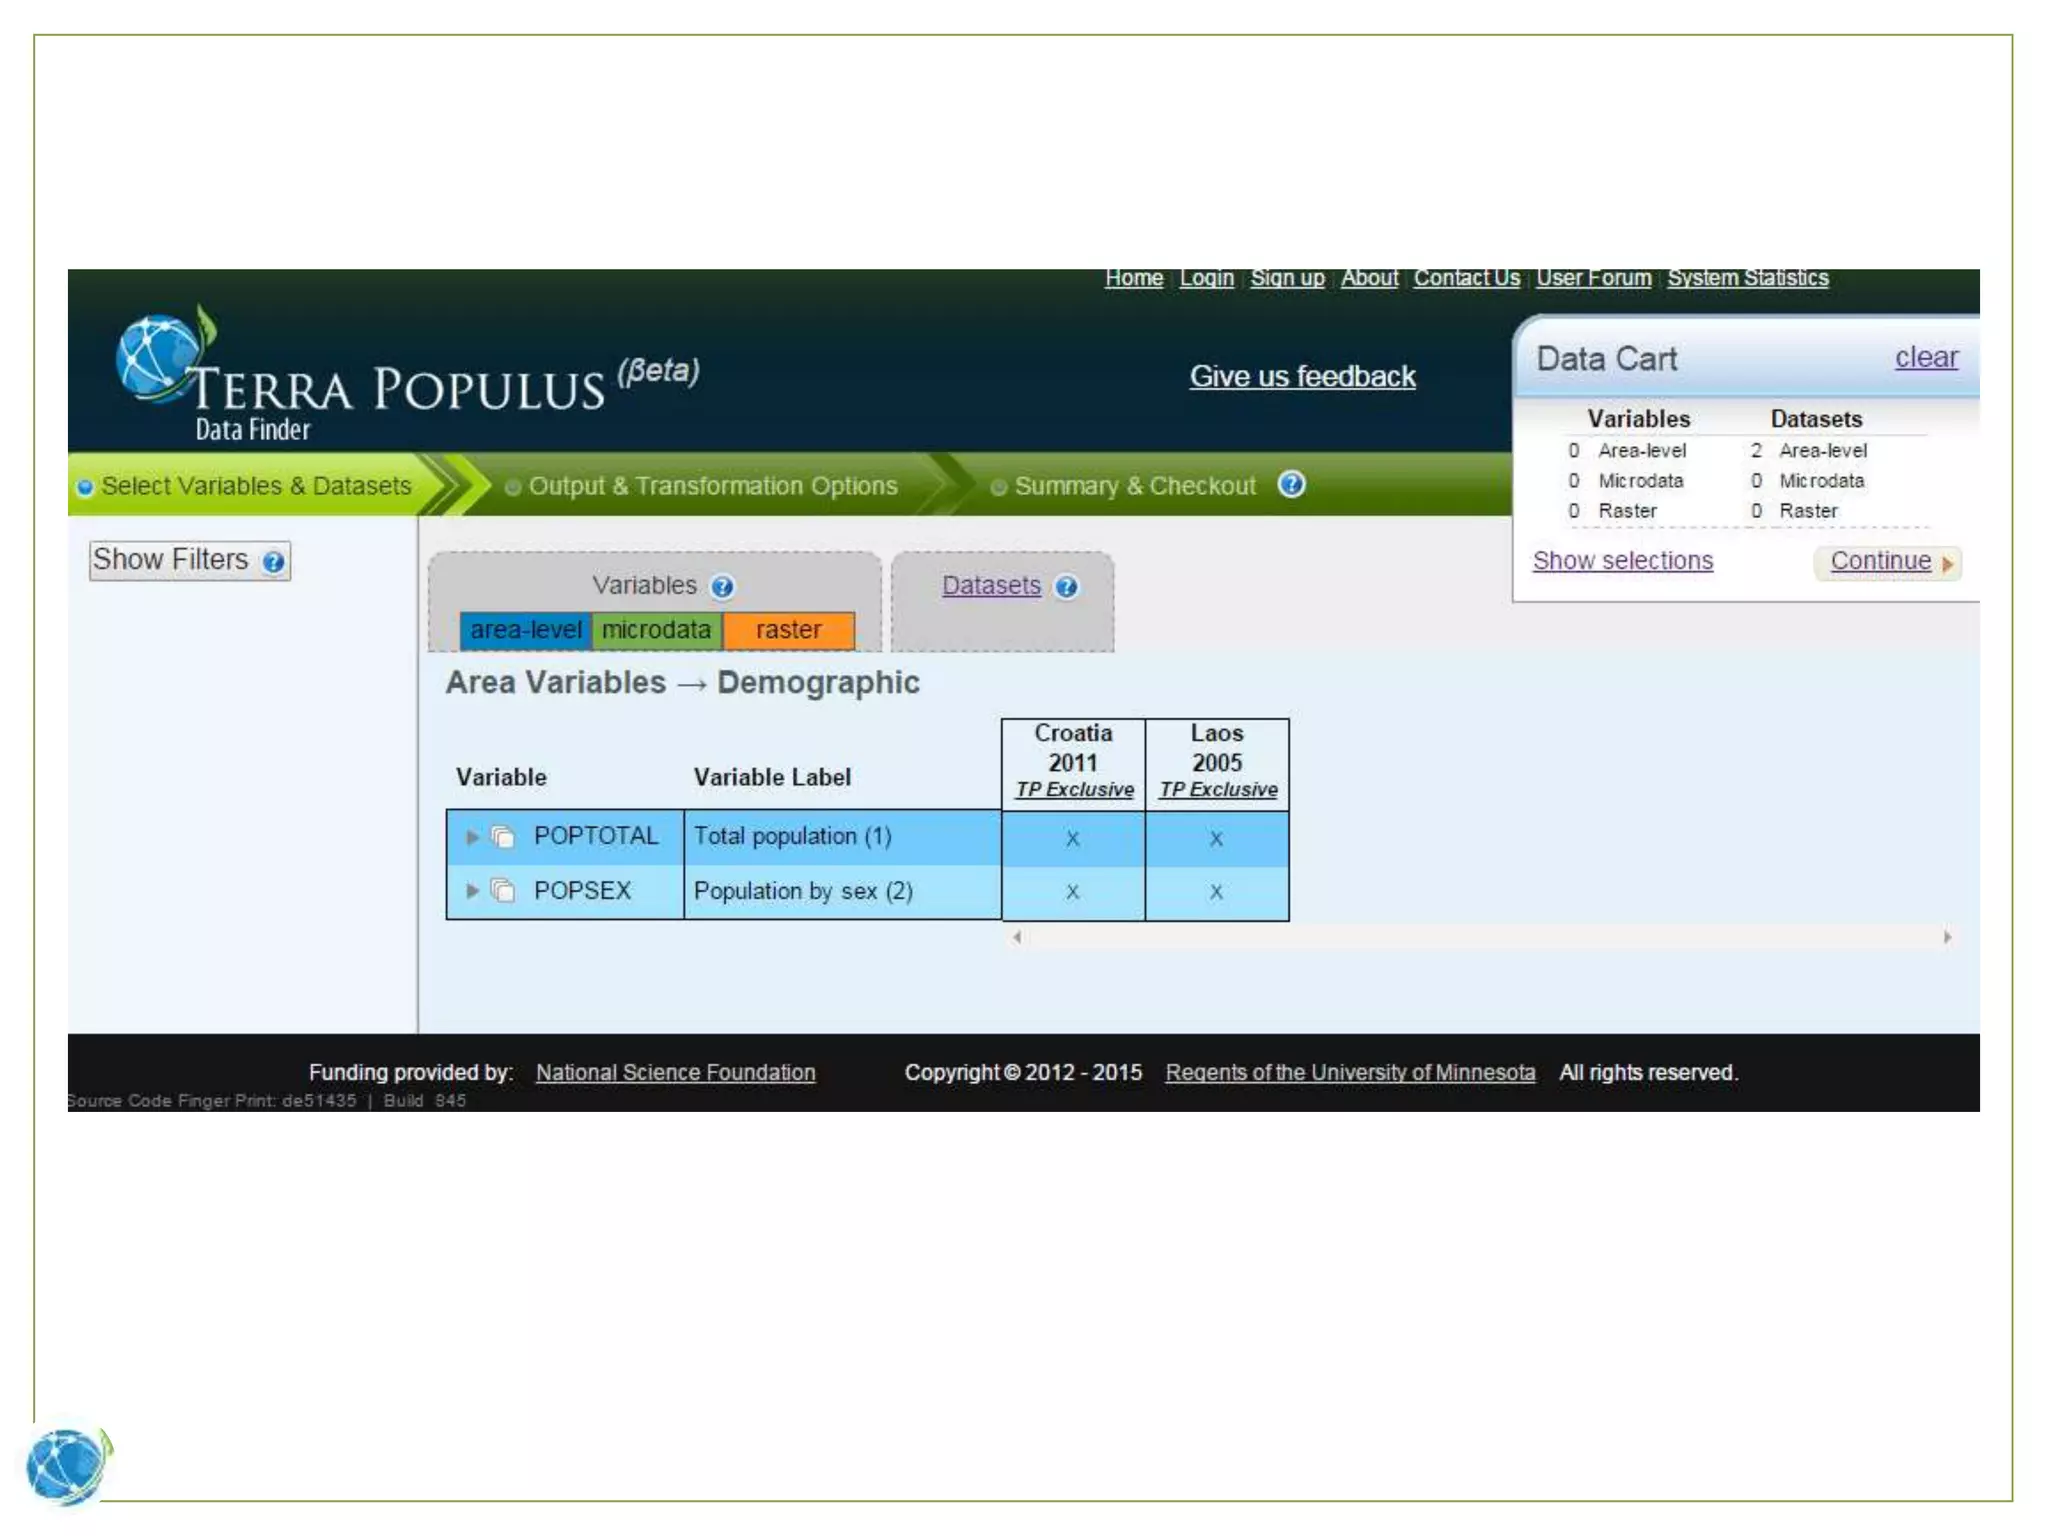
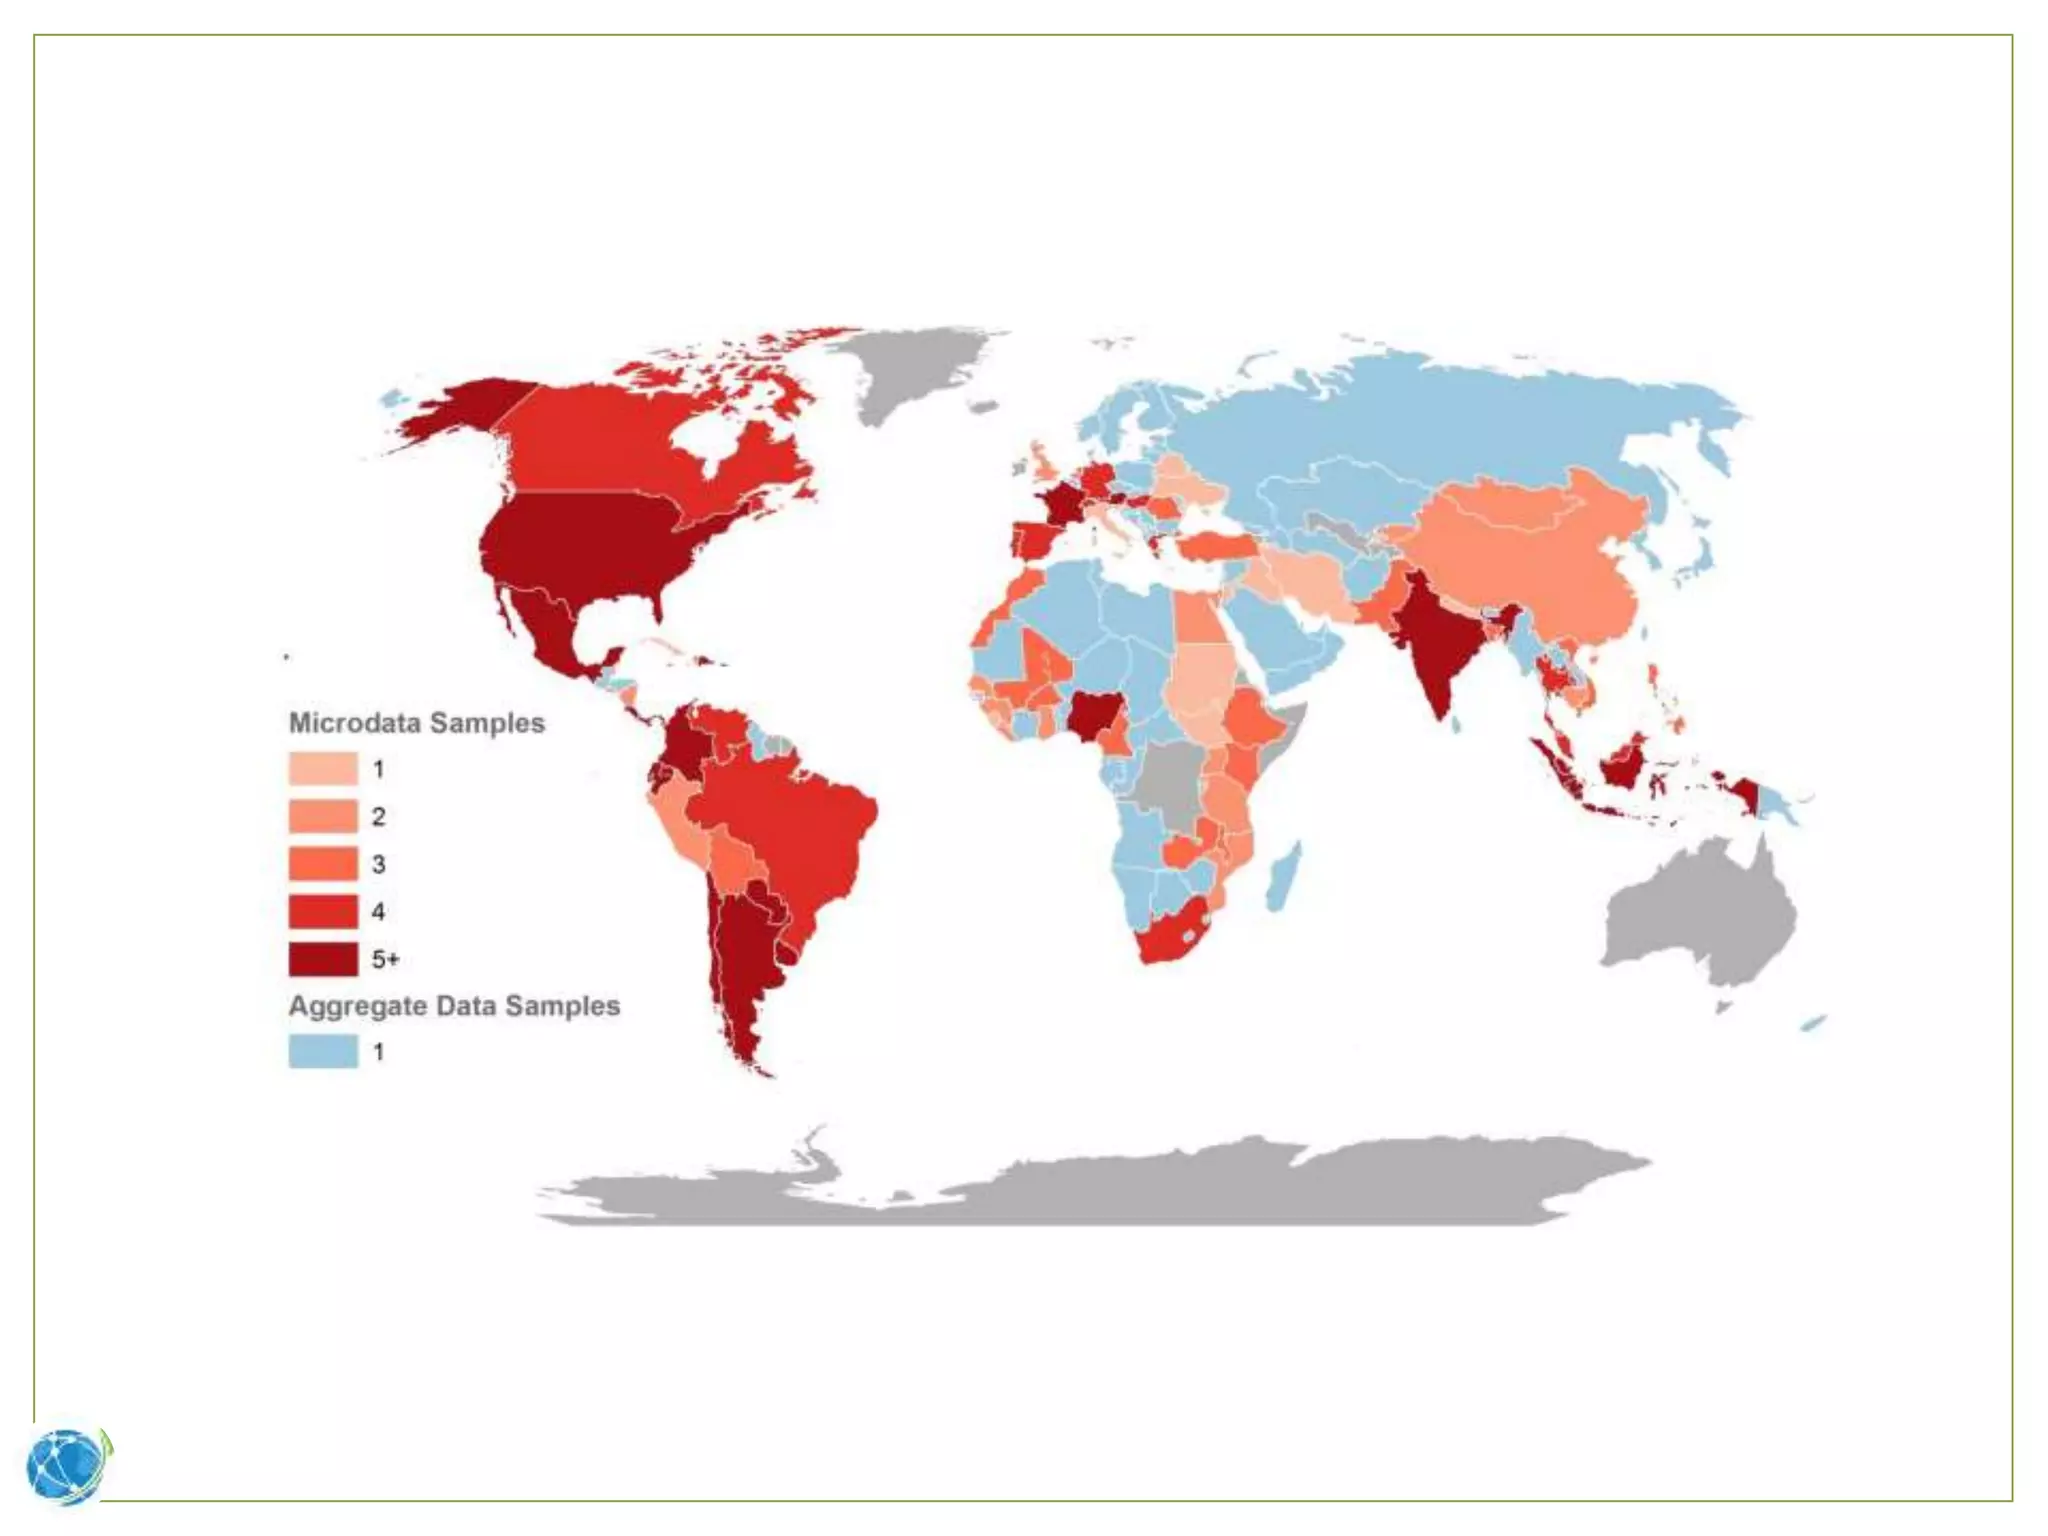
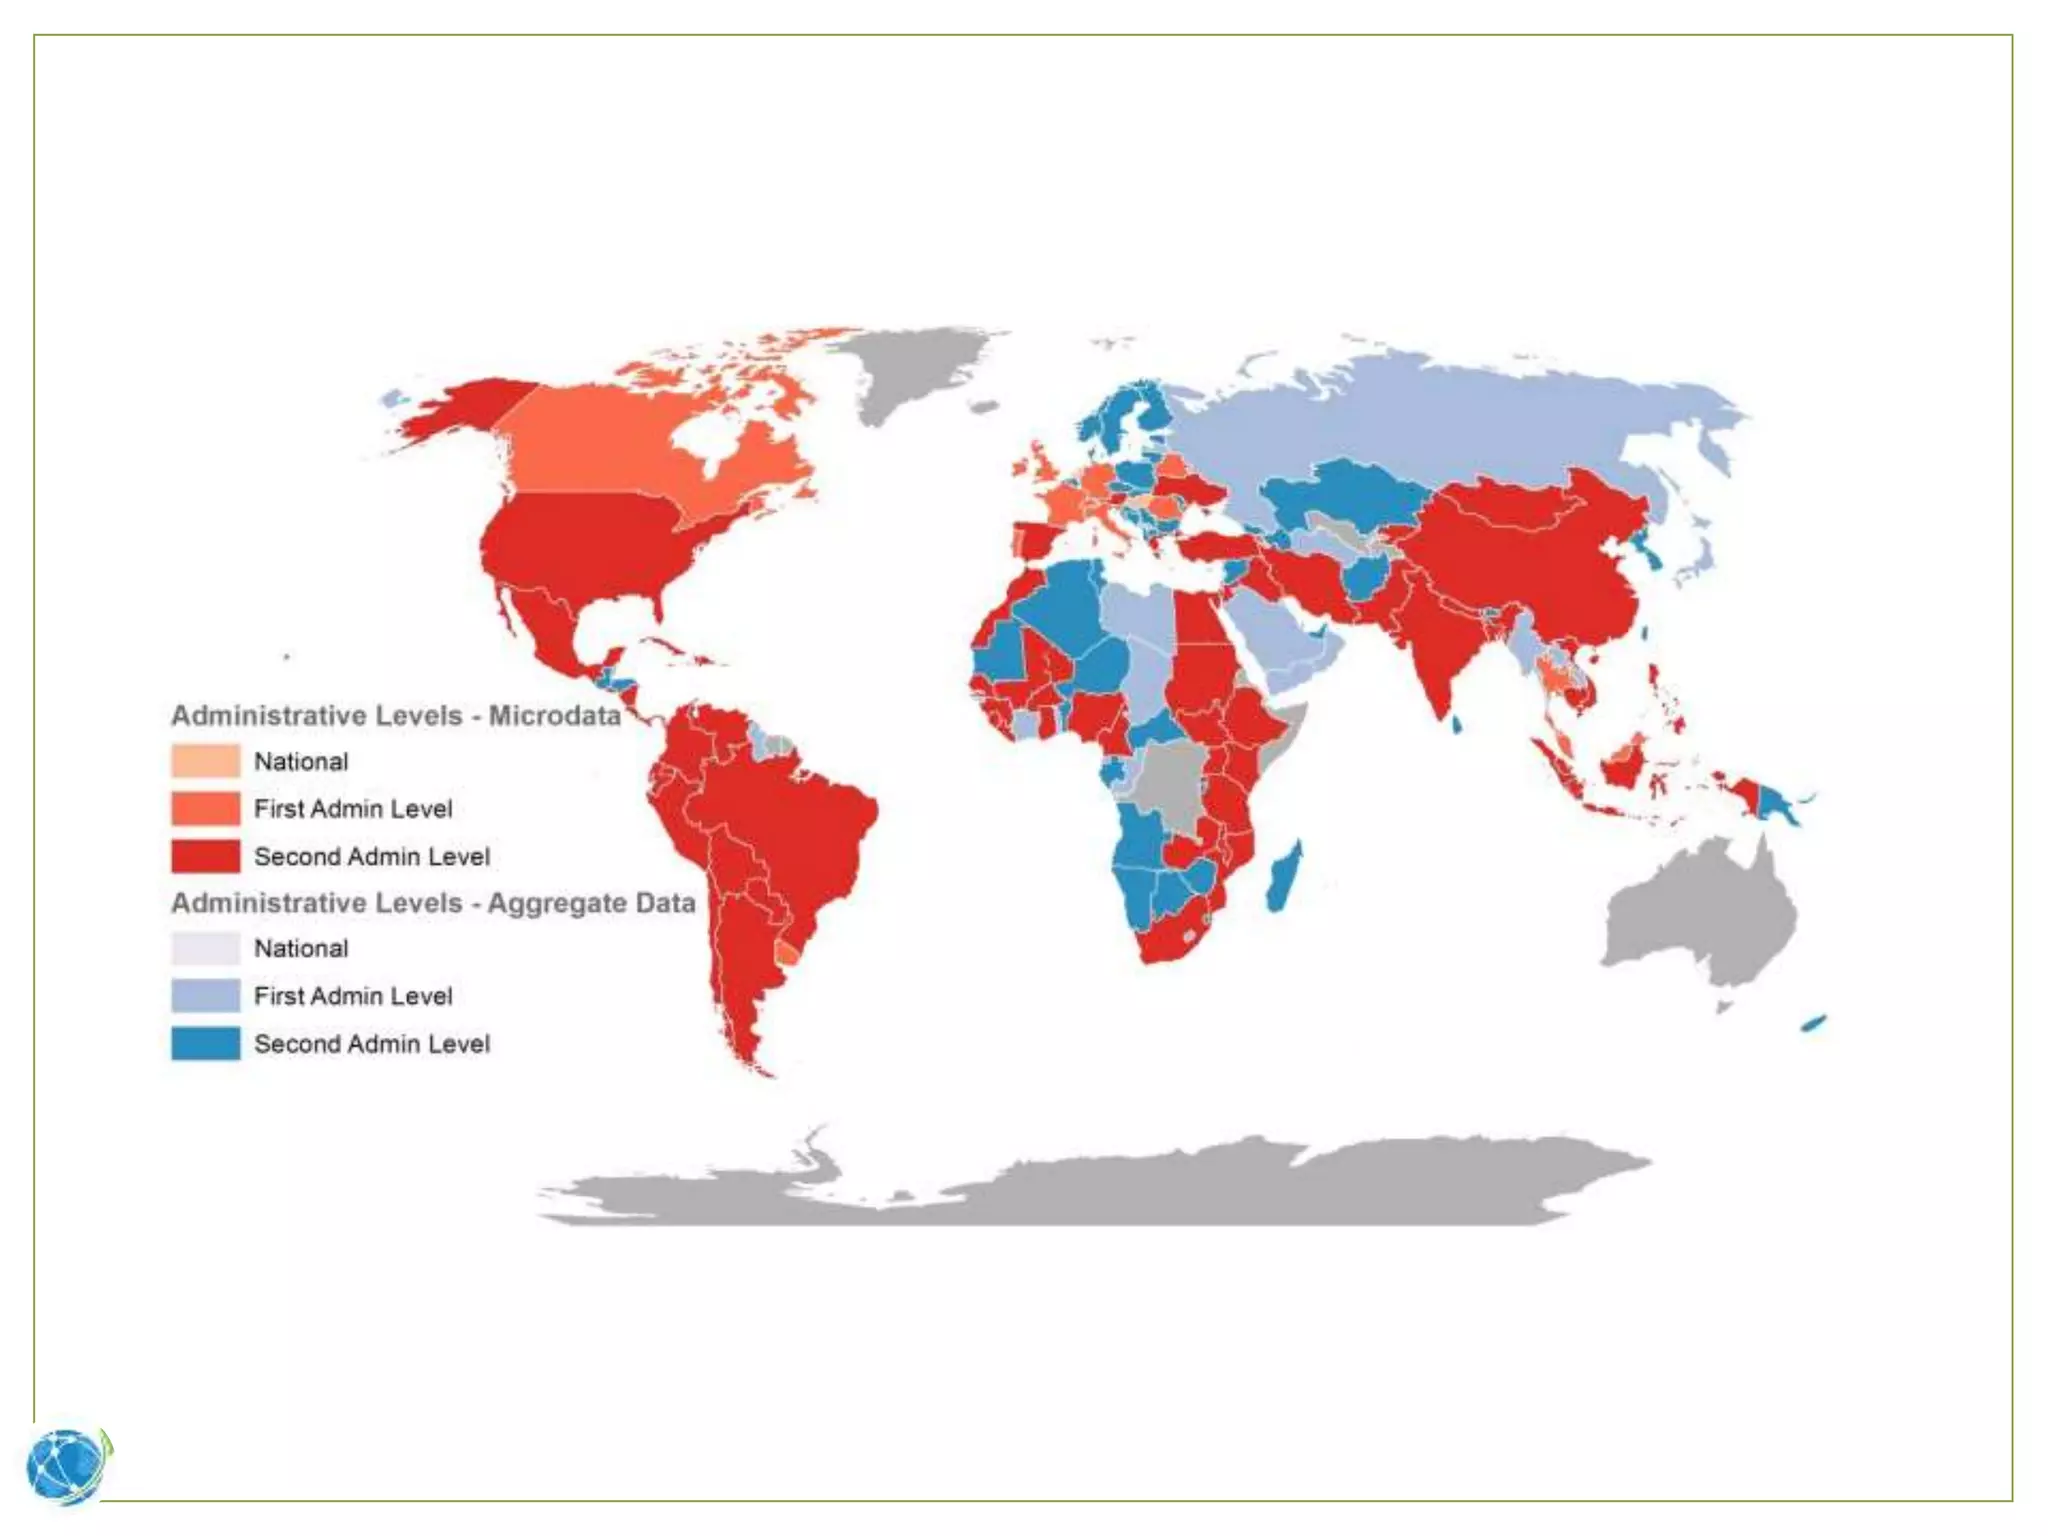

Terrapop aims to enhance interdisciplinary research on human-environment interactions by facilitating the interoperability of diverse data formats from various scientific domains. The initiative focuses on data preservation, integration, and accessibility while collaborating with organizations that specialize in data curation and sustainability. By improving data management practices and providing location-based integration, Terrapop plans to support researchers with a comprehensive understanding of population dynamics and environmental variables.


