Download to read offline
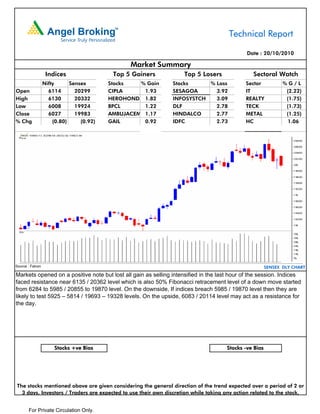


The markets opened on a positive note but closed lower as indices faced resistance at key levels. The Nifty closed down 0.80% at 6027 and Sensex closed down 0.92% at 19983. Among sectoral indices, IT and Realty declined the most while Healthcare rose. Cipla, Hero Honda, and BPCL gained the most while InfoSys, DLF, and Hindalco lost the most. The technical outlook is bearish if indices breach key support levels, while upside is limited by resistance levels. Pivot points are provided for 50 stocks.


