Download to read offline
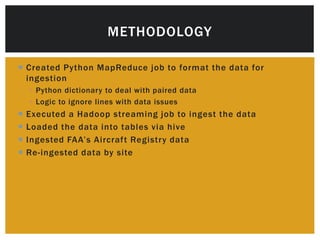
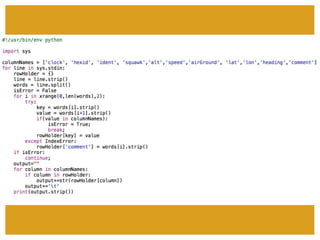
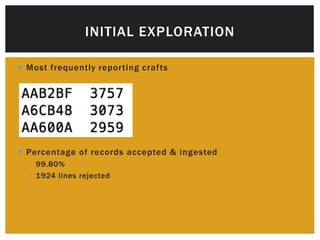
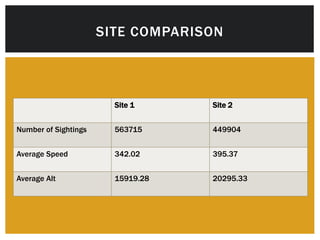
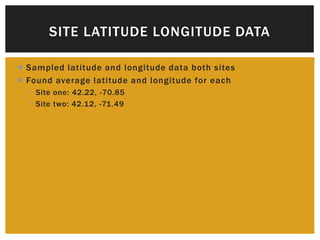
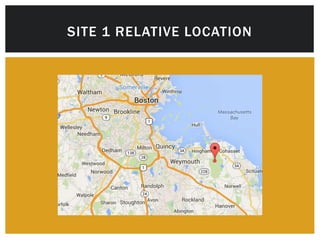
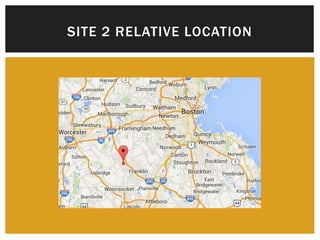
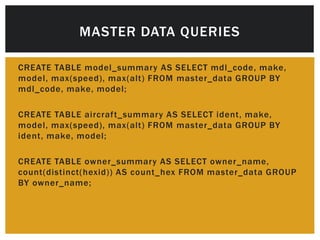


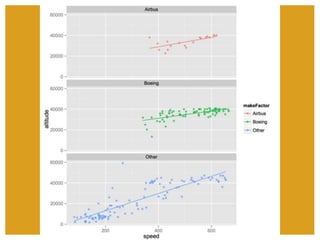


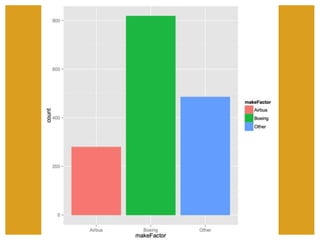
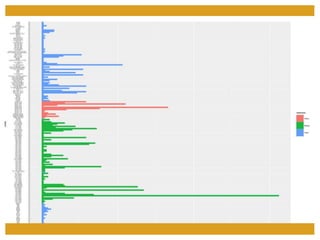

The document summarizes a Think Big Bootcamp project involving the ingestion and preliminary analysis of aircraft registry data from the FAA. It describes how the data was ingested using Python and Hadoop, then loaded into Hive tables. Initial exploration found the most frequently reported crafts and analyzed acceptance rates. Site comparison showed differences in average speed and altitude between two sites. Master data queries were created to summarize models, aircraft, and owners. Data visualizations analyzed fastest planes, speed vs altitude by make, unique flights by airline, and number of sightings by aircraft make.