Download as PDF, PPTX


![GLOB
The glob module finds all the pathnames matching a
specified pattern according to the rules used by the
Unix shell. No tilde expansion is done, but *, ?, and
character ranges expressed with [] will be correctly
matched.
glob.glob(pathname):
Return a possibly-empty list of path names that
match pathname, which must be a string containing a
path specification. pathname can be either absolute
(like /usr/src/Python-1.5/Makefile) or relative
(like ../../Tools/*/*.gif), and can contain shell-style
wildcards.](https://image.slidesharecdn.com/snowcoverassessmenttoolusingpython-140609104036-phpapp02/85/Snow-cover-assessment-tool-using-Python-9-320.jpg)
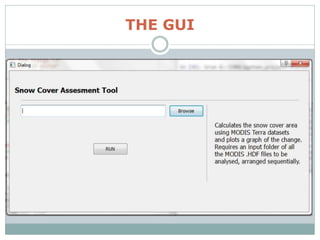
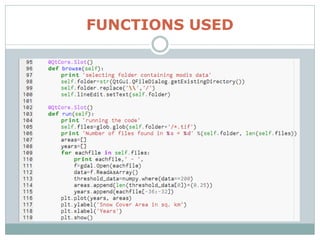
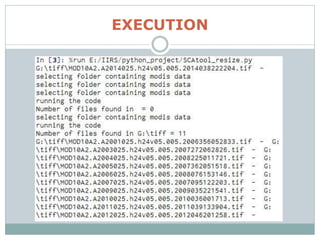
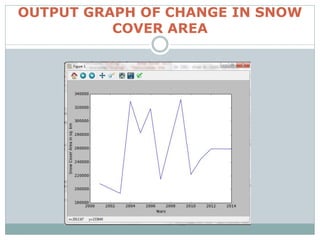


This document describes a tool created using Python to calculate snow cover area from MODIS Terra datasets and plot the change over time. It uses PyQt4 and PySide for the GUI, GDAL for image processing, NumPy for arithmetic and file listing, and Matplotlib for plotting. The tool allows the user to select input and output folders, runs snow cover calculations on the MODIS files, and displays the results as a graph of snow cover area over time. Future improvements could involve using more GDAL and OGR capabilities to generate output maps of permanent and seasonal snow cover.