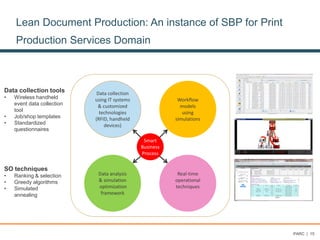
The document discusses smart business processes and process optimization. It introduces the concept of a smart business process as one that is continually optimized using data-driven simulation, optimization, and real-time analytics. It provides an overview of Xerox services capabilities and the need to improve processes using data-driven approaches. Examples of process optimization research areas are discussed like simulation optimization, process flexibility, and buffer optimization. The strategic vision is to advance the science of data-driven process simulation optimization and demonstrate significant business impacts.

![PARC | 4
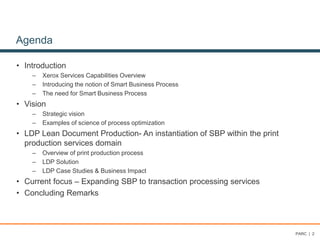
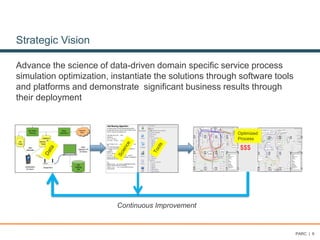
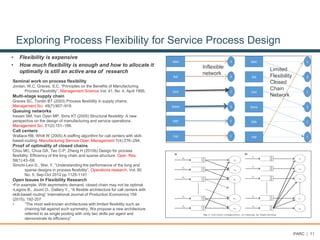
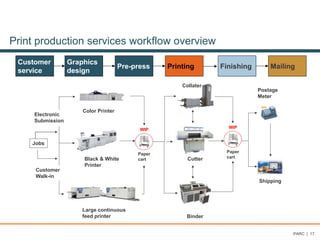
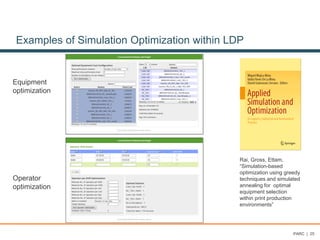
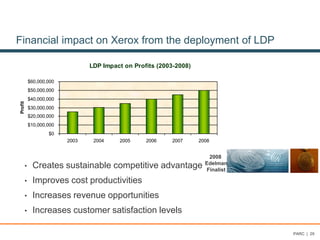
What is Smart Business Process?
A business process that is continually optimized and operated using data-driven simulation
optimization and real-time productivity analytics encapsulated in standalone and web-
based software solutions
Data collection
using IT systems
& customized
technologies
(RFID, handheld
devices)
Data analysis
& simulation
optimization
framework
Workflow
models
using
simulations
Real-time
operational
techniques)],([)(
),(min
xYExgwhere
xxg
=
Smart
Business
Process](https://image.slidesharecdn.com/talkdeliveredataigscienceexternalspeakersseries2015-190722022709/85/Smart-Business-Process-Framework-4-320.jpg)
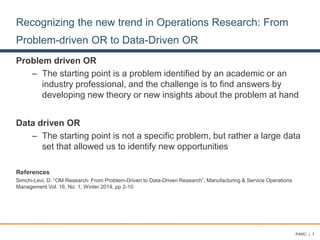
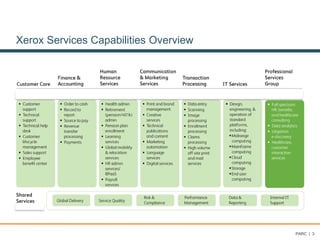
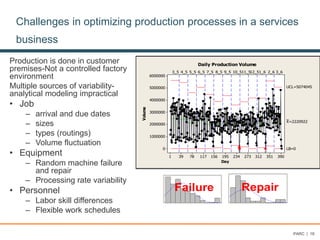
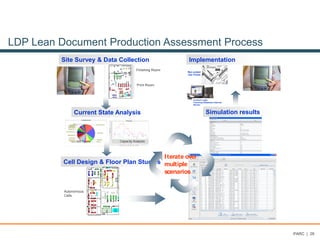
![Simulation Optimization – Discrete/Continuous
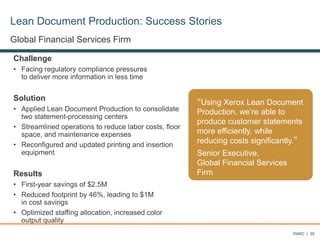
Optimization via simulation
where g(x) is the single objective
represented as the expected value of a random variable where represents the
randomness.
denotes the d-dimensional vectors with integer components
is the continuous parameter space
The distribution of is unknown function of the decision variable x but can be
determined via simulation models
Why is this hard?
• Simulation is computationally demanding
• The randomness makes it hard to compare and evaluate outcomes during the
optimization iterations and provide guarantees on optimality.
)],([)(
),(min
xYExgwhere
xxg
=
),( xY
),( xY
d
Z
d
R
PARC | 9](https://image.slidesharecdn.com/talkdeliveredataigscienceexternalspeakersseries2015-190722022709/85/Smart-Business-Process-Framework-9-320.jpg)
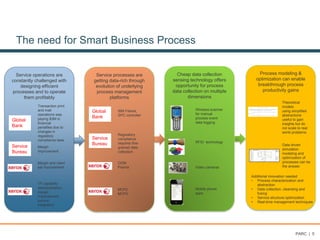
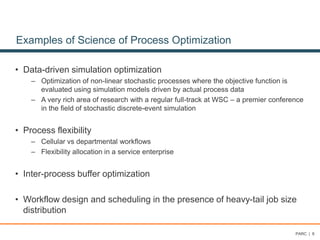
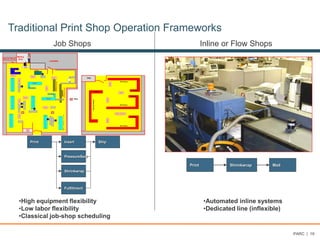
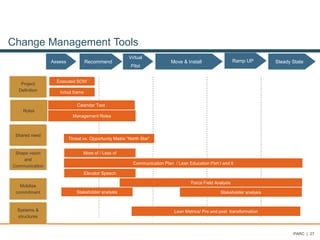
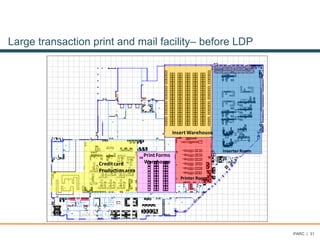
![Developing solutions to deal with high levels of task size
variability in service processes
• Let X be a random variable with cdf F(x)
= P[X≤ x] and complementary cdf (ccdf)
Fc(x) = P[X>x]. We say here that a
distribution F(x) is fat-tailed if
Fc (x) ~ cx-a 0<a<2
In the limit of x->∞
α
dlogx
(x)dLogF
lim
x
c
-=
→
• Size-based binning policies are
more effective when task size
distribution is heavy-tailed in
distributed server processing
• Methods have to be adapted to
take into account production
characteristics such as setups,
job arrival patterns, multiple job
types etc.
h
xxdF
h
M
xxdFxxdFxxdF
p
k
px
x
x
x
x
kx
h
h
=====
=
= -
)(
)(...)()(
1
2
1
1
0
x0=k xh=px1 x2 xi
1.0
F(x) = Pr{ X ≤ x }
1
1
)( 1
1
11
=
+
-
=
-
--
a
a
a
aa
if
if
k
p
k
p
h
i
k
h
ih
x
h
ii
k: smallest job size
p: largets job size
a: Exponent in the Bounded Pareto distribution
M: Mean
h: Number of cutoff points
Bounded Pareto Distribution f(x) = (akax-a-1)/(1-(k/p)a)
pxk
pdf
job size
• On Choosing a Task Assignment policy for a distributed server system: M. Harchol-Balter, M.E. Crovella, C.D Murta,
Lecture Notes in Computer Science, Springer Berlin/Heidelberg.
• Size-independent vs. size-dependent policies in scheduling heavy-tailed distributions. Nham, J. (MS Thesis, MIT)
PARC | 13](https://image.slidesharecdn.com/talkdeliveredataigscienceexternalspeakersseries2015-190722022709/85/Smart-Business-Process-Framework-13-320.jpg)
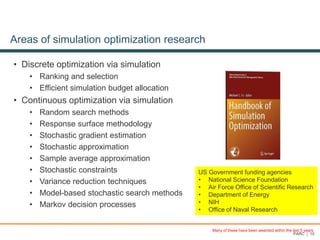
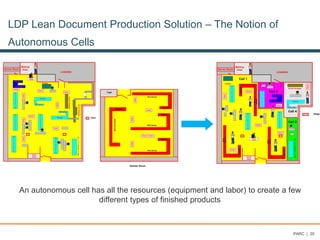
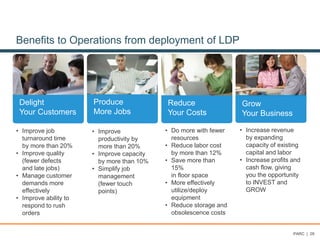
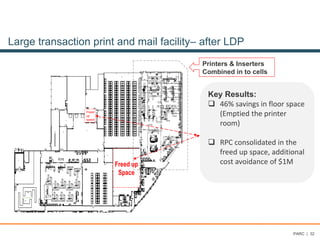
![• Simulation optimization enables us to optimize
complex service processes in the presence of
variability and uncertainty
• Optimal allocation of flexibility in service
operations can deliver almost the same benefit as
full flexibility
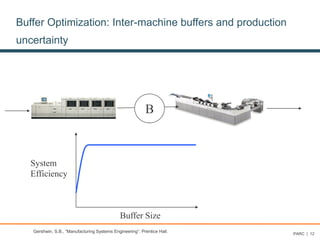
• Buffer optimization can enable systems to delivery
high throughput in the presence of failures and
downtime
• Novel scheduling strategies are utilized for dealing
with extremely high levels of variability in task size
distributions
PARC | 14
Benefits of a scientific approach to business process
optimization
)],([)(
),(min
xYExgwhere
xxg
=
System
Efficiency
Buffer Size
x0=k xh=px1 x2 xi
pdf
job size
AAdam
BBob
CCarol
DDianne
EEdith
FFred
AAdam
BBob
CCarol
DDianne
EEdith
FFred](https://image.slidesharecdn.com/talkdeliveredataigscienceexternalspeakersseries2015-190722022709/85/Smart-Business-Process-Framework-14-320.jpg)


![제 23회 보아즈(BOAZ) 빅데이터 컨퍼런스 - [MBOAX] : ABSA를 활용한 소비자 반응 분석 기반 운영 효율화 대시보드 설계](https://cdn.slidesharecdn.com/ss_thumbnails/3-1boaz23rdconferencemboax-260203102709-9d519923-thumbnail.jpg?width=640&height=640&fit=bounds)


