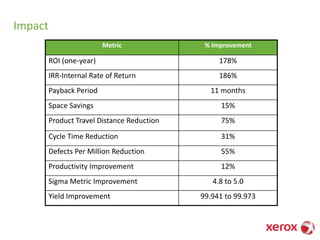
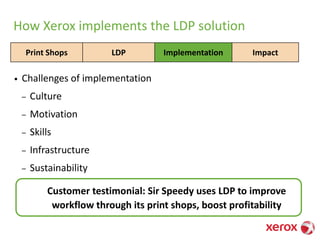
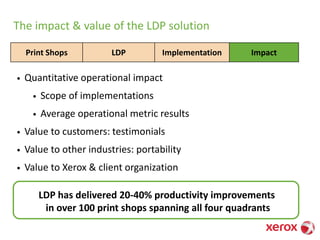
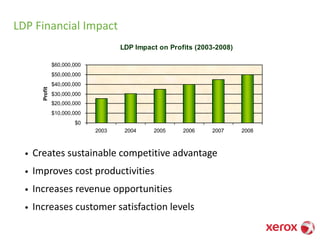
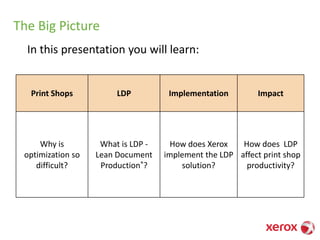
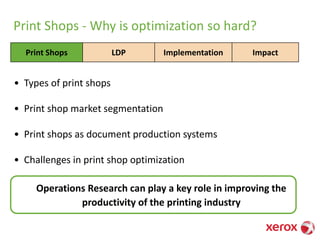
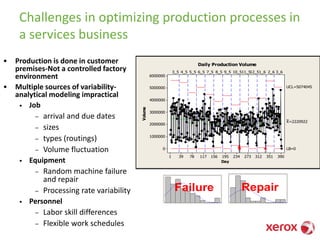
The document discusses the Lean Document Production® (LDP) implemented by Xerox to improve productivity in the printing industry, achieving over $200 million in productivity enhancements. LDP utilizes operations research methodologies to optimize print shop processes, resulting in significant operational improvements such as reduced cycle times and increased revenues. It highlights challenges in print shop optimization and presents quantitative impacts of LDP across various implementations in print shops.


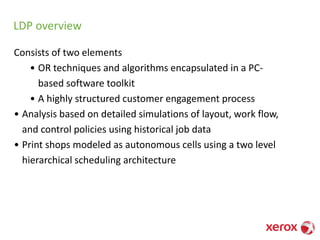

![Characterizing and analyzing very high variability using
fat-tailed distributions
Let X be a random variable with cdf F(x) = P[X≤ x] and complementary
cdf (ccdf) Fc(x) = P[X>x]. We say here that a distribution F(x) is fat-tailed
if
Fc (x) ~ cx-a 0<a<2 (1)
In the limit of x->∞ (2)
α
dlogx
(x)dLogF
lim
x
c
-=
→
Heavy-tailed distribution determination
-6
-5
-4
-3
-2
-1
0
0 1 2 3 4 5 6 7 8 9 10 11 12 13 14 15
Ln(JobSize)
Ln(CCDF)
Heavy-tailed distribution
determination
Fat-tailed distribution determination](https://image.slidesharecdn.com/edelmancompetitionpresentationslides-190722023358/85/Edelman-competition-presentation-slides-23-320.jpg)