The document discusses the multiobjective optimization and quantitative trade-off analysis in the design of xerographic systems, emphasizing the need for a holistic approach to understand subsystem interactions for achieving high performance. Traditional compartmentalized design methods are inadequate for extreme performance requirements, necessitating a focus on the relationships between design variables and performance criteria. The methodology described aims to optimize multiple objectives simultaneously while addressing inherent trade-offs and conflicts within the system design.
![1 Copyright © 1997 by ASME
Proceedings of DETC’97:
1997 ASME Design Engineering Technical Conferences
September 14-17,1997,Sacramento,California
DETC97/DTM-3885
MULTIOBJECTIVE OPTIMIZATION AND QUANTITATIVE TRADE-OFF ANALYSIS IN
XEROGRAPHIC SYSTEM DESIGN
Sudhendu Rai
Member of Research & Technology Staff
Wilson Center for Research & Technology
Xerox Corporation, Webster NY14580
ABSTRACT
A complex engineering system such as a xerographic marking
engine is an aggregate of interacting subsystems that are coupled through a
large number of constraints and design variables. The traditional way of
designing these systems is to decouple the overall design into smaller
subsystems and assign teams to work on these subsystems. This approach is
critical to making the project manageable and enabling concurrent
development. However, if the goal is to design systems that can deliver best
possible performance, i.e. if the performance limits are being pushed to the
extreme, characterizing the interactions becomes critical.
Multiobjective optimization is a design methodology that addresses
the issue of designing large systems where the goal is to simultaneously
optimize a finite number of performance criteria that come from one or more
disciplines and are coupled through a set of design variables and constraints.
This approach to design makes explicit and quantitative the inherent trade-offs
that need to be made in doing coupled system design. It also enables the
determination of the attainable limits of performance from a given system.
This paper will discuss the multiobjective optimization
methodology and optimal methods of performing quantitative trade-off
analysis. These design methods will be applied to problems from the
xerographic design domain and results will be presented.
INTRODUCTION
The traditional way of designing large engineering
systems has been to break it down into smaller subsystems;
work on them in somewhat of an isolated manner and put them
together to produce the whole system. The subdivision into
smaller subsystems was essential in the past to make the project
manageable and enable concurrent development and worked
well since the performance requirement was not high and the
market pressures on cost and product development time were
low. However, if the goal is to design products whose
performance is being pushed to extreme, it is no longer
reasonable to take the traditional compartmentalized view to
product design. It becomes necessary to focus on the
interactions between the various subsystems and characterize
the trade-offs between various objectives in a quantitative and
precise manner.
The area of integrated design has been receiving the
attention of several researchers in the recent past. For example,
integrated structure/control system design efforts have focussed
on trying to look at the interactions between controller design
and mechanical design and focus on simultaneous optimization
of the performance characteristics coming from the two
disciplines. (For examples see, Khot & Venkayya et.al [4],
Miller & Shim [7], Hale & Lisowski [3], Bodden & Junkins
[1], Meirovitch [6], Rai & Asada [12]). Other researchers have
focussed on the design of structural optimization of mechanical
systems that can improve static and dynamic characteristics of
the structures. (For examples see, Eschenauer et. al. [2], Koski
[5], Rai & Asada [11]). In a separate report prepared for ARPA,
the authors Whitney et. al. [19] highlight the need for a systems
perspective to electromechanical product design.
This paper will focus on some of the issues involved
in the design of large xerographic marking engines. A design
methodology will be presented and corroborated with practical
examples that illustrate how some of these issues can be
resolved. The first section of the paper will briefly describe the
xerographic marking process. In the second section some of
the issues involved in designing systems that can deliver
extremely high performance will be examined. The design
methodology of multiobjective optimization will then be
described in the context of xerographic system design and
illustrated with relevant examples.
1.0 The Xerographic Marking Engine
The section provides an overview of the xerographic
marking process. For a more in-depth description, the reader is
referred to Pai & Springett [9]. The xerographic subsystems](https://image.slidesharecdn.com/dtm3885-210224185612/85/MULTIOBJECTIVE-OPTIMIZATION-AND-QUANTITATIVE-TRADE-OFF-ANALYSIS-IN-XEROGRAPHIC-SYSTEM-DESIGN-1-320.jpg)
![1 Copyright © 1997 by ASME
Proceedings of DETC’97:
1997 ASME Design Engineering Technical Conferences
September 14-17,1997,Sacramento,California
DETC97/DTM-3885
MULTIOBJECTIVE OPTIMIZATION AND QUANTITATIVE TRADE-OFF ANALYSIS IN
XEROGRAPHIC SYSTEM DESIGN
Sudhendu Rai
Member of Research & Technology Staff
Wilson Center for Research & Technology
Xerox Corporation, Webster NY14580
ABSTRACT
A complex engineering system such as a xerographic marking
engine is an aggregate of interacting subsystems that are coupled through a
large number of constraints and design variables. The traditional way of
designing these systems is to decouple the overall design into smaller
subsystems and assign teams to work on these subsystems. This approach is
critical to making the project manageable and enabling concurrent
development. However, if the goal is to design systems that can deliver best
possible performance, i.e. if the performance limits are being pushed to the
extreme, characterizing the interactions becomes critical.
Multiobjective optimization is a design methodology that addresses
the issue of designing large systems where the goal is to simultaneously
optimize a finite number of performance criteria that come from one or more
disciplines and are coupled through a set of design variables and constraints.
This approach to design makes explicit and quantitative the inherent trade-offs
that need to be made in doing coupled system design. It also enables the
determination of the attainable limits of performance from a given system.
This paper will discuss the multiobjective optimization
methodology and optimal methods of performing quantitative trade-off
analysis. These design methods will be applied to problems from the
xerographic design domain and results will be presented.
INTRODUCTION
The traditional way of designing large engineering
systems has been to break it down into smaller subsystems;
work on them in somewhat of an isolated manner and put them
together to produce the whole system. The subdivision into
smaller subsystems was essential in the past to make the project
manageable and enable concurrent development and worked
well since the performance requirement was not high and the
market pressures on cost and product development time were
low. However, if the goal is to design products whose
performance is being pushed to extreme, it is no longer
reasonable to take the traditional compartmentalized view to
product design. It becomes necessary to focus on the
interactions between the various subsystems and characterize
the trade-offs between various objectives in a quantitative and
precise manner.
The area of integrated design has been receiving the
attention of several researchers in the recent past. For example,
integrated structure/control system design efforts have focussed
on trying to look at the interactions between controller design
and mechanical design and focus on simultaneous optimization
of the performance characteristics coming from the two
disciplines. (For examples see, Khot & Venkayya et.al [4],
Miller & Shim [7], Hale & Lisowski [3], Bodden & Junkins
[1], Meirovitch [6], Rai & Asada [12]). Other researchers have
focussed on the design of structural optimization of mechanical
systems that can improve static and dynamic characteristics of
the structures. (For examples see, Eschenauer et. al. [2], Koski
[5], Rai & Asada [11]). In a separate report prepared for ARPA,
the authors Whitney et. al. [19] highlight the need for a systems
perspective to electromechanical product design.
This paper will focus on some of the issues involved
in the design of large xerographic marking engines. A design
methodology will be presented and corroborated with practical
examples that illustrate how some of these issues can be
resolved. The first section of the paper will briefly describe the
xerographic marking process. In the second section some of
the issues involved in designing systems that can deliver
extremely high performance will be examined. The design
methodology of multiobjective optimization will then be
described in the context of xerographic system design and
illustrated with relevant examples.
1.0 The Xerographic Marking Engine
The section provides an overview of the xerographic
marking process. For a more in-depth description, the reader is
referred to Pai & Springett [9]. The xerographic subsystems](https://image.slidesharecdn.com/dtm3885-210224185612/75/MULTIOBJECTIVE-OPTIMIZATION-AND-QUANTITATIVE-TRADE-OFF-ANALYSIS-IN-XEROGRAPHIC-SYSTEM-DESIGN-1-2048.jpg)
![3 Copyright © 1997 by ASME
translate to requirements and allocations on the individual
subsystems in an optimal manner is a significantly difficult
problem that can be determined only through a quantitative
consideration of the interactions and trade-offs between
different subsystems?
2.2 Objective Conflict
Image quality is a performance that has several
dimensions such as line quality, contrast, variations in print
colors from the desired colors etc. The design goal is
simultaneously optimize on all dimensions of quality to achieve
customer satisfaction. However, in a typical xerographic
machine these objectives are conflicting in nature. It is not
possible to simultaneously optimize all performance measures.
The problem therefore is to make judicious trade-offs between
the conflicting measures and determine the corresponding
design and operating setpoints that will deliver the desired
performance.
2.3 Preference Articulation
The existence of conflict in design necessitates that
design decisions be made that best resolve the conflicting
objectives. Conflict resolution is best achieved if preferences
are articulated explicitly and precisely. If design decisions are
made with implicit assumptions that have not been articulated
precisely, then there is no guarantee that the design achieved is
optimal.
Image quality is a performance that has both objective
and subjective components. In the presence of subjective and
objective components of performance, it is often hard to
explicitly articulate the preferences of the design decision-
maker. Methods are needed that can enable quantification of
design preferences in the presence of uncertainties.
2.4 Family of Designs
Traditional optimization methods seek to determine
the best possible design solution. However, in real systems, the
search for “the best” design is an utopian ideal. There are
usually several designs that meet the requirements of image
quality and cost and it is essential to select from “some
optimal” set of designs. In other words, there is no unique
design from the “systems viewpoint” but instead there is a
family of designs from which the design-decision-maker has to
choose his design.
3.0 Multiobjective Design Optimization of Xerographic
Systems
The system design problem is characterized by the
presence of several metrics of performance that have to be
simultaneously optimized, a set of design variables that
influences them and the existence of equality and inequality
constraints.
Multiobjective optimization is a design methodology
that addresses the issue of designing large systems where the
goal is to simultaneously optimize a finite number of
performance criteria that come from one or more disciplines
and are coupled through a set of design variables and
constraints. This section will provide a brief description of the
multiobjective optimization design methodology fundamentals.
3.1 Pareto-Optimality
Problem Statement
Let us assume that the design variables of interest are
represented by the vector:
x=[x1,x2,...,xn]T
(1)
The performance criteria are represented by the vector:
f(x)=[f1(x),f2(x),...,fm(x)]T
(2)
The equality constraints are given as:
g(x)=[g1(x),g2(x),...,gp(x)]T
= 0 (3)
and the inequality constraints are denoted by:
h(x)=[h1(x),h2(x),...,hq(x)]T
<= 0 (4)
The design goal is to find a vector of design variables
x* that simultaneously minimizes all the components of the
objective function vector f(x) without violating the constraints
specified by equations (3) and (4). The multi-objective
optimization is different from the single objective problem in
the sense that instead of minimizing only one objective function
in single objective optimization, the design goal is to
simultaneously minimize a finite number of performance
criteria that are represented above as components of the vector
f. In other words, the multi-objective optimization problem is a
vector minimization problem when contrasted with the
traditional scalar function optimization problem.
It is the typical characteristic of multi-objective
optimization problems stated above that not all of the
performance criteria (described above as the vector f(x)) can be
simultaneously minimized. In other words, the multiple criteria
often conflict with each other so that none of the feasible
solutions can simultaneously minimize all of the criteria. To
deal with such a situation, it is necessary to introduce the
concept of Pareto-optimality (Pareto [10]).
A vector x* is Pareto-optimal if and only if there is no
other vector x with the characteristics:
fj(x) <= fj(x*) for all j m}
and
fj(x) < fj(x*) for at least one j {1, ... , m}(5)
A Pareto-optimal solution (for the multi-objective
minimization problem) is such that it is not possibly to move](https://image.slidesharecdn.com/dtm3885-210224185612/85/MULTIOBJECTIVE-OPTIMIZATION-AND-QUANTITATIVE-TRADE-OFF-ANALYSIS-IN-XEROGRAPHIC-SYSTEM-DESIGN-3-320.jpg)
![4 Copyright © 1997 by ASME
feasibly from that solution to any other point in the design
space without increasing at least one of the performance
criterion.
Illustration
The concept of Pareto-optimality is best illustrated for
the case when two objective functions are being simultaneously
optimized. Figure 2 shows the mapping of the functions from
the design variable space to the space of performance criteria.
The boundary of Pareto-optimal solutions is shown (in bold) in
the space of performance metrics. It is obvious that within the
space of feasible solutions shown in the figure, only the
solutions lying on the Pareto-optimal curve have the
characteristic property that moving on the curve, f1 and f2
cannot be simultaneously decreased - one objective can be
decreased only at the expense of another. Also, each point on
the Pareto-optimal curve corresponds to one set of design
variables x which is termed as a Pareto-optimal design.
For problems involving three metrics, the Pareto-
optimal solutions lie on a surface that can be plotted in three
dimensions. However, for problems with higher dimensions, it
is no longer possible to visually show all the solutions and one
has to look at the numerical values of the objective functions to
make the appropriate trade-offs
Design Space Design Objective Space
Pareto-optimal
curve or “trade-off”
curve
Figure2: Mapping from the design variable space to the design
objectives space showing the Pareto-optimal curve
3.2 Direct Methods of Obtaining Pareto-optimal
solutions
The multi-objective problem of generating Pareto-
optimal solutions for the performance criteria vector f(x) is
accomplished by formulating a scalar substitute problem,
min p[f(x)] (6)
where the function p is called a preference function
whose arguments are the components of the vector f(x). There
are numerous methods of formulating the preference function
such that minimizing the preference function yield a Pareto-
optimal solution.
This section will describe some of these methods.
a. Method of Objective Weighting
The method of objective weighting is one of the most
intuitive ways of forming the preference function. In this
approach, a linear combination of the individual objective
functions is used as the preference function. Thus:
p[f(x)] = [wjfj(x)] = wT
f(x) (7)
The weights are usually chosen to lie between 0 and
1.0 and are normalized so that their sum is equal to 1 ie.
0.0 <= wi =< 1.0, wj = 1.0 (8)
This approach will find the Pareto optimal solutions if
the feasible objective space is convex. It cannot find those
solutions where the objective space is non-convex. This is
illustrated in Figure 3.
Figure 3: Solution region with both concave and convex
Pareto-optimal solutions
In Figure 3, the solutions represented by the concave
portion of the Pareto-optimal solution curve cannot be
determined the weighted objective approach. However, the
solutions that lie on the convex region of the Pareto-optimal
curve can be determined by the weighted objective approach.
Another limitation of this approach to generating the Pareto-
optimal solutions is that it is often not possible to generate
uniformly spaced points on the trade-off curve (or hypersurface
in higher dimensions) by uniformly varying the weights.
b. Method of Distance Functions (or Goal
Programming)
Vector norms or measures of distance in the space of
objective functions are often used to scalarize the vector
minimization problem into a scalar minimization problem. The
substitute problem is then written as:
p[f(x)] = [ |fj(x) - yj|n
]1/n
1 <= n =< (9)
Usually, the value of n is chosen to be 1 or 2. The
value yj are often called the demand level or aspiration level.
This approach is not guaranteed to yield a Pareto-optimal
solution. That is obvious from Figure 4. Solutions for aspiration
level y1 and y2 will lead to Pareto-optimal solutions (shown as
black dots) on the Pareto optimal solution curve (or surface for
Concave feasible Pareto-
optimal solution boundary
solution boundary
Convex feasible Pareto-
optimal solution boundary
Convex feasible Pareto-
optimal solution boundary
f1
f2](https://image.slidesharecdn.com/dtm3885-210224185612/85/MULTIOBJECTIVE-OPTIMIZATION-AND-QUANTITATIVE-TRADE-OFF-ANALYSIS-IN-XEROGRAPHIC-SYSTEM-DESIGN-4-320.jpg)
![5 Copyright © 1997 by ASME
higher order vectors) whereas the solution for aspiration level
y3 will not be Pareto-optimal but will lie inside the feasible
region and coincide with y3.
Figure 4: Solutions generated using the method of distance
functions
3. Method of Min-Max Formulation with Objective
Weighting
The weighted min-max formulation tries to minimize
the maximum deviation of the functions from the individual
minimum weighted by some weighting. If fj
*
denotes the
minimum value of fj(x) then the weighted deviation of fj(x) is
measured by :
zj = wj|fj(x) - fj
*
| / |fj
*
| j = 1, ... , m (10)
The min-max formulation attempts to find the
minimum of the maximum zj. In the first step, the individual
minima for each function fj are computed. Then a slack
variable is introduced and the following constrained
optimization problem is solved.
min [ ]
subject to.
zj < for each j = 1, ... , m (11)
This approach of generating the Pareto-optimal
solutions has the advantage that both convex and concave
regions of Pareto-optimal solution curve of surface can be
determined ( Steur [18]). In other words the entire set of Pareto-
optimal solutions can be generated by choosing appropriate
values of the weights.
For a more detailed exposition the reader is referred to
[2],[13],[17] and [18]. Another interesting account of
multiobjective optimization activity in the former USSR can be
found in [8].
3.3Example of Pareto-optimal Xerographic Design
Setpoint Determination
This section will describe the application of
multiobjective optimization design methodology to determine
the design setpoint solutions that simultaneously optimize two
conflicting image quality attributes.
Problem Statement
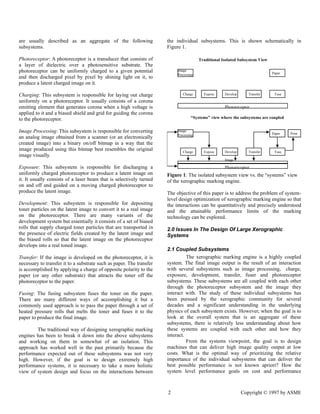
The creation of a latent image on a photoreceptor and
its subsequent development is one of the fundamental functions
of a marking engine.(For a description of various development
methods, the reader is referred to Schaffert [14], Schein [16]).
The latent image is created on the photoreceptor as a result of
exposure by a light source of a uniformly charged
photoreceptor. As the photoreceptor carrying the latent image
moves through the development region, the fields created as a
result of the potential difference between the image on the
photoreceptor and the development rolls causes charged toner
particles to migrate from the donor rolls to the latent image on
the photoreceptor and develop it, as shown schematically in
Figure 5. (This developed image is subsequently transferred
and fused to a substrate such as paper or transparency).
- -
- -
- -
- -
- -
- -
- -
- -
- -
- -
- -
- -
- -
- -
- -
- -
- -
- -
- -
- -
- -
- -
- -
- -
- -
- -
- -
- -
- -
- -
- -
- -
- -
- -
- -
- -
- -
- -
- -
- -
- -
- -
- -
- -
- -
- -
- -
- -
- -
- -
- -
- -
- -
- -
- -
- -
- -
- -
- -
- -
- -
- -
- -
- -
- -
- -
- -
- -
- -
Developer Roll
- -
- -
- -
- -
- -
- -
- -
- -
- -
- -
- -
- -
- -
- -
- -
- -
- -
- -
- -
- -
- -
- -
Cloud of Charged
Toner Particles
+ + + + + + + + + + + + + + + +
_ _ _ _ _ _ _ _ _ _ _ _
_ _ _ _ _ _ _ _ _ _
Moving
Photoreceptor
Latent Image
Figure 5: Schematic view of the image development in a
xerographic marking engine
A critical problem during the image development is
that it is often not possible to develop all types of images with
extremely high fidelity and resolution. In other words, if one
tries to determine an operating condition setpoint that develops
fine lines extremely well, then thick lines or solid areas areas
do not develop that well and vice-versa. (For an elaborate
discussion, see Scharfe [15]).
In one approach to xerographic development, the
region between the photoreceptor and the development rolls is
filled with a cloud of charged toner particles and it is this cloud
that is responsible for the development of the latent image. If
the cloud is brought too close excessive background can occur.
There are several xerographic system design variables that
f1
y3
y1
y2
f2](https://image.slidesharecdn.com/dtm3885-210224185612/85/MULTIOBJECTIVE-OPTIMIZATION-AND-QUANTITATIVE-TRADE-OFF-ANALYSIS-IN-XEROGRAPHIC-SYSTEM-DESIGN-5-320.jpg)
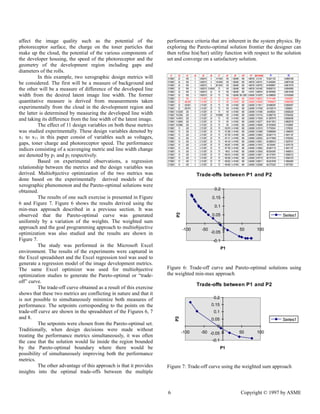
![7 Copyright © 1997 by ASME
Trade-offs between P1 and P2
-0.1
-0.05
0
0.05
0.1
-100 -50 0 50 100
P1
P2
Series1
Figure 8: Trade-off curve using the goal programming
approach.
4.0 Conclusions
This paper demonstrates the use of multiobjective
design methodology for quantitatively studying the optimal
trade-offs that confront designers who have to make design
decisions in the face of coupled and conflicting performance
requirements in the design of a complex engineering systems
such as a xerographic marking engine. It was shown that
instead of a unique solution to the system design problem,
there exists a family of Pareto-optimal designs from which the
design choices have to be made. It was also shown that the
methodology can be used on experimental data. This is often
the case when the engineering processes being studied are
either not amenable to precise modeling and even if such first
principle models exist, they are computationally expensive for
performing rigorous optimization studies.
Future work includes extending the methodology to
more performance indices when it is not possible to visualize
the Pareto-optimal hypersurface of design solutions and the
designer has to make decisions by interacting with the decision
support system.
Acknowledgements:
The author is grateful to Howard Mizes for providing
experimental data, and several other members of the Wilson
Center for providing valuable input leading to a better
understanding of the problem.
REFERENCES
[1]Bodden, D.S., and Junkins, J.L., “Eigenvalue Optimization
Algorithms for Structure/Controller Design Iterations”. Journal
of Guidance, Control and Dynamics, Vol. 8, No. 6, 1985.
[2]Eschenauer, H., Koski, J. and Osyzcka, A. [editors] ,
“Multicriteria Design Optimization, Procedures and
Applications”. Springer-Verlag Berlin, Heidelberg, 1990.
[3]Hale, A.L., and Lisowski, R.J. and Dahl, W.E., “Optimal
Simultaneous Structural and Control Design of Maneouvering
Flexible Spacecraft”, Journal of Guidance, Control and
Dynamics, Vol. 8, No. 1, 1985.
[4]Khot, N.S., Venkayya, V.B. and Eastep, F.E., “Optimal
Structural Modifications to Enhance the Active Vibration
Control of Flexible Structure”, AIAA Journal Vol. 24. No. 8,
1986
[5]Koski, J., and Osyzcka, A., “Optimal Counterweight
Balancing of Robot Arms Using Multicriteria Approach”, in
“Multicriteria Design Optimization, Procedures and
Applications”. Springer-Verlag Berlin, Heidelberg, 1990.
[6] Meirovitch, L., “Dynamics and Control of Structures”. A
Wiley-Interscience Publication. John-Wiley & Sons. 1989.
[7]Miller, D.F., Shim, J., “Gradient-Based Combined Structural
and Control Optimization”, Journal of Guidance and Control,
Vol. 13, No. 5, Sep-Oct 1990, pp. 859-866
[8]Multiobjective Programming in the USSR; Liebarmann.
Eliot R..; Academic Press, 1991.
[9]Pai.D.M., Springett, B.E., “Physics of Electrophotography”.
Reviews of Modern Physics, Vol. 65, No. 1, January 1993
[10]Pareto,V., Manual of Political Economy. Translation of the
French edition (1927) by A.S. Schwier. London-Basingslohe:
The Mcmillan Press Ltd., 1971.
[11]Rai, S., Asada, H., “Computer-Aided Structure
Modification of Electromechanical Systems Using Singular
Value Decomposition”. ASME Journal of Mechanical Design.,
Jan. 1994.
[12]Rai, S., Asada, H., “Integrated Structure/Control Design of
High Speed Planar Robots Based on Time Optimal Control”,
ASME Journal of Dynamic Systems Measurement and Control,
Dec. 1995.
[13]Sawaragi, Y., Nakayama, H., Tanino, T. , “ Theory of
Multiobjective Optimization”. Academic Press (1985).
[14]Schaffert, R.M., “Electrophotography”. Focal Press
Limited. 31 Fitzroy Square, London, W.J. U.K.
[15]Scharfe, M.E., “Electrophotography: Principles and
Optimization”. Research Studies Press Ltd., John Wiley and
Sons. Inc.](https://image.slidesharecdn.com/dtm3885-210224185612/85/MULTIOBJECTIVE-OPTIMIZATION-AND-QUANTITATIVE-TRADE-OFF-ANALYSIS-IN-XEROGRAPHIC-SYSTEM-DESIGN-7-320.jpg)
![8 Copyright © 1997 by ASME
[16]Schein, L.B., “Electrophotography & Development
Physics”. Springer-Verlag 1987.
[17]Stadler, W., : “Multicriteria Optimization in Engineering
and in the Sciences”. New York and London: Plenum Press,
1988.
[18]Steur, R.E., “Multiple Criteria Optimization: Theory,
Computation and Application”. Wiley Series in Probability and
Mathematical Statistics -Applied (1986).
[19]Whitney,D.E., Nevins, J.L., DeFazio, T.L., Gustavson,R.E.,
“Problems and Issues In Design and Manufacture of Complex
Electro-Mechanical Systems”. Technical Report submitted by
Charles Stark Draper Laboratory, Inc.](https://image.slidesharecdn.com/dtm3885-210224185612/85/MULTIOBJECTIVE-OPTIMIZATION-AND-QUANTITATIVE-TRADE-OFF-ANALYSIS-IN-XEROGRAPHIC-SYSTEM-DESIGN-8-320.jpg)


![[1] artigo modelherarquicos](https://cdn.slidesharecdn.com/ss_thumbnails/1artigomodelherarquicos-160530150448-thumbnail.jpg?width=640&height=640&fit=bounds)


