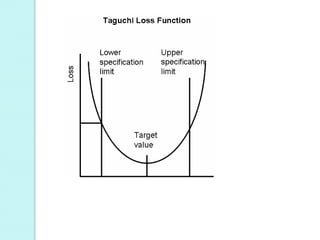
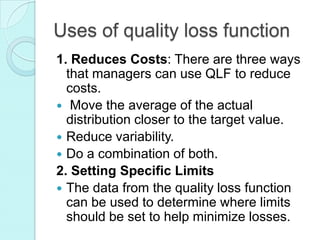
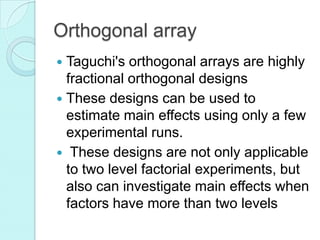
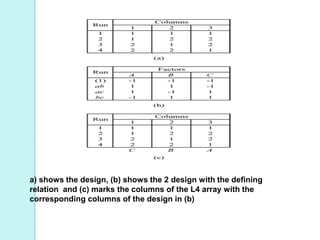
Genichi Taguchi
(January 1, 1924 – June 2, 2012)
Presented by :
REVA
BM 012125
EARLY LIFE
 Taguchi was born and raised in the textile town
of tokamachi in Niigata prefecture
 In 1950, he joined the Electrical Communications
Laboratory (ECL) when statistical quality control
was beginning to become popular in Japan, under
the influence of W. Edwards Deming , he
collaborated widely and in 1954-1955
 Genichi Taguchi is well known for
developing a methodology to improve
quality and reduce costs.
 In the United States, is referred to as
the Taguchi Methods. he also
developed the quality loss function.
LOSS FUNCTION
 The Taguchi Loss Function is
graphical depiction of loss in which
taguchi describe a phenomenon affecting
the value of products produced by a
company.
 Traditionally, companies measure quality
by the number of defects or the defect
rate. In this system, defects are identified
through inspections of the materials and
products. Upper and lower quality limits
are established. Everything that does not
fall within the limits is considered a
defect.
 In this approach, the closer to the
target value, the better.
 It does not matter whether the
deviation is above or below the target
value.
 Under this approach the deviation is
quadratic.
Three things can be summarise by
taguchi’s philosophy:
 We can improve quality without
increasing cost.
 We can reduce cost by improving
quality.
 We can reduce cost by reducing
variation. (When we do so,
performance and quality will
automatically improve.)
Uses of quality loss function
1. Reduces Costs: There are three ways
that managers can use QLF to reduce
costs.
 Move the average of the actual
distribution closer to the target value.
 Reduce variability.
 Do a combination of both.
2. Setting Specific Limits
 The data from the quality loss function
can be used to determine where limits
should be set to help minimize losses.
Orthogonal array
 Taguchi's orthogonal arrays are highly
fractional orthogonal designs
 These designs can be used to
estimate main effects using only a few
experimental runs.
 These designs are not only applicable
to two level factorial experiments, but
also can investigate main effects when
factors have more than two levels
a) shows the design, (b) shows the 2 design with the defining
relation and (c) marks the columns of the L4 array with the
corresponding columns of the design in (b)
Geneci taguchi

Geneci taguchi

  • 1.
    Genichi Taguchi (January 1,1924 – June 2, 2012) Presented by : REVA BM 012125
  • 2.
    EARLY LIFE  Taguchiwas born and raised in the textile town of tokamachi in Niigata prefecture  In 1950, he joined the Electrical Communications Laboratory (ECL) when statistical quality control was beginning to become popular in Japan, under the influence of W. Edwards Deming , he collaborated widely and in 1954-1955
  • 3.
     Genichi Taguchiis well known for developing a methodology to improve quality and reduce costs.  In the United States, is referred to as the Taguchi Methods. he also developed the quality loss function.
  • 4.
    LOSS FUNCTION  TheTaguchi Loss Function is graphical depiction of loss in which taguchi describe a phenomenon affecting the value of products produced by a company.  Traditionally, companies measure quality by the number of defects or the defect rate. In this system, defects are identified through inspections of the materials and products. Upper and lower quality limits are established. Everything that does not fall within the limits is considered a defect.
  • 6.
     In thisapproach, the closer to the target value, the better.  It does not matter whether the deviation is above or below the target value.  Under this approach the deviation is quadratic.
  • 7.
    Three things canbe summarise by taguchi’s philosophy:  We can improve quality without increasing cost.  We can reduce cost by improving quality.  We can reduce cost by reducing variation. (When we do so, performance and quality will automatically improve.)
  • 8.
    Uses of qualityloss function 1. Reduces Costs: There are three ways that managers can use QLF to reduce costs.  Move the average of the actual distribution closer to the target value.  Reduce variability.  Do a combination of both. 2. Setting Specific Limits  The data from the quality loss function can be used to determine where limits should be set to help minimize losses.
  • 9.
    Orthogonal array  Taguchi'sorthogonal arrays are highly fractional orthogonal designs  These designs can be used to estimate main effects using only a few experimental runs.  These designs are not only applicable to two level factorial experiments, but also can investigate main effects when factors have more than two levels
  • 10.
    a) shows thedesign, (b) shows the 2 design with the defining relation and (c) marks the columns of the L4 array with the corresponding columns of the design in (b)