Downloaded 1,652 times


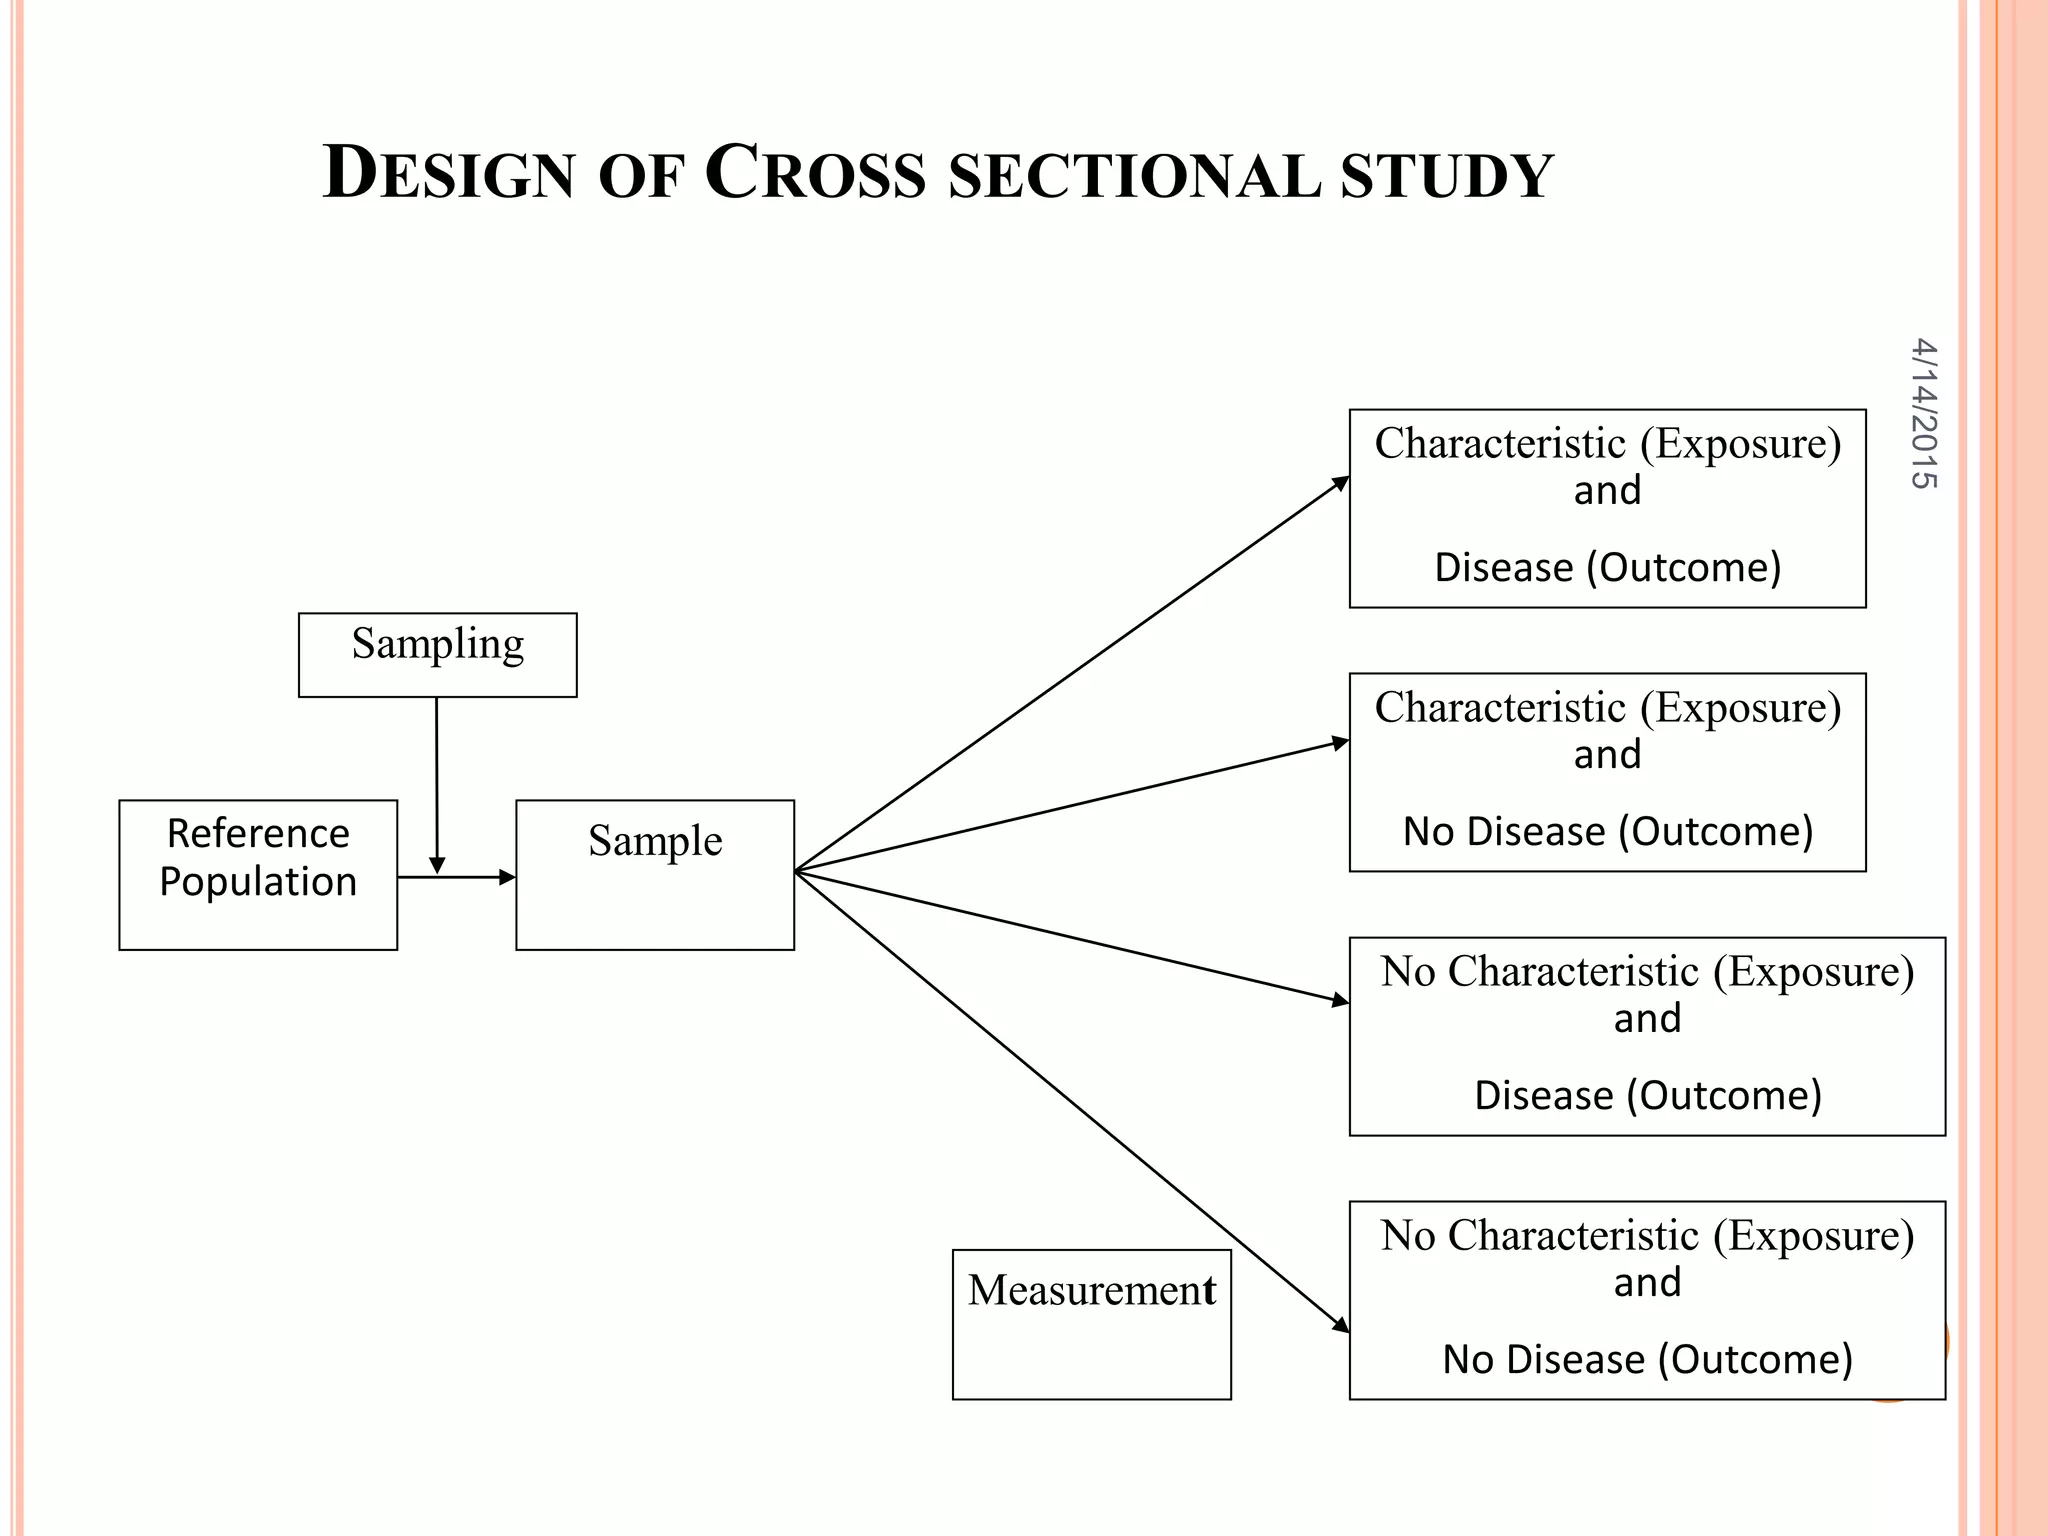
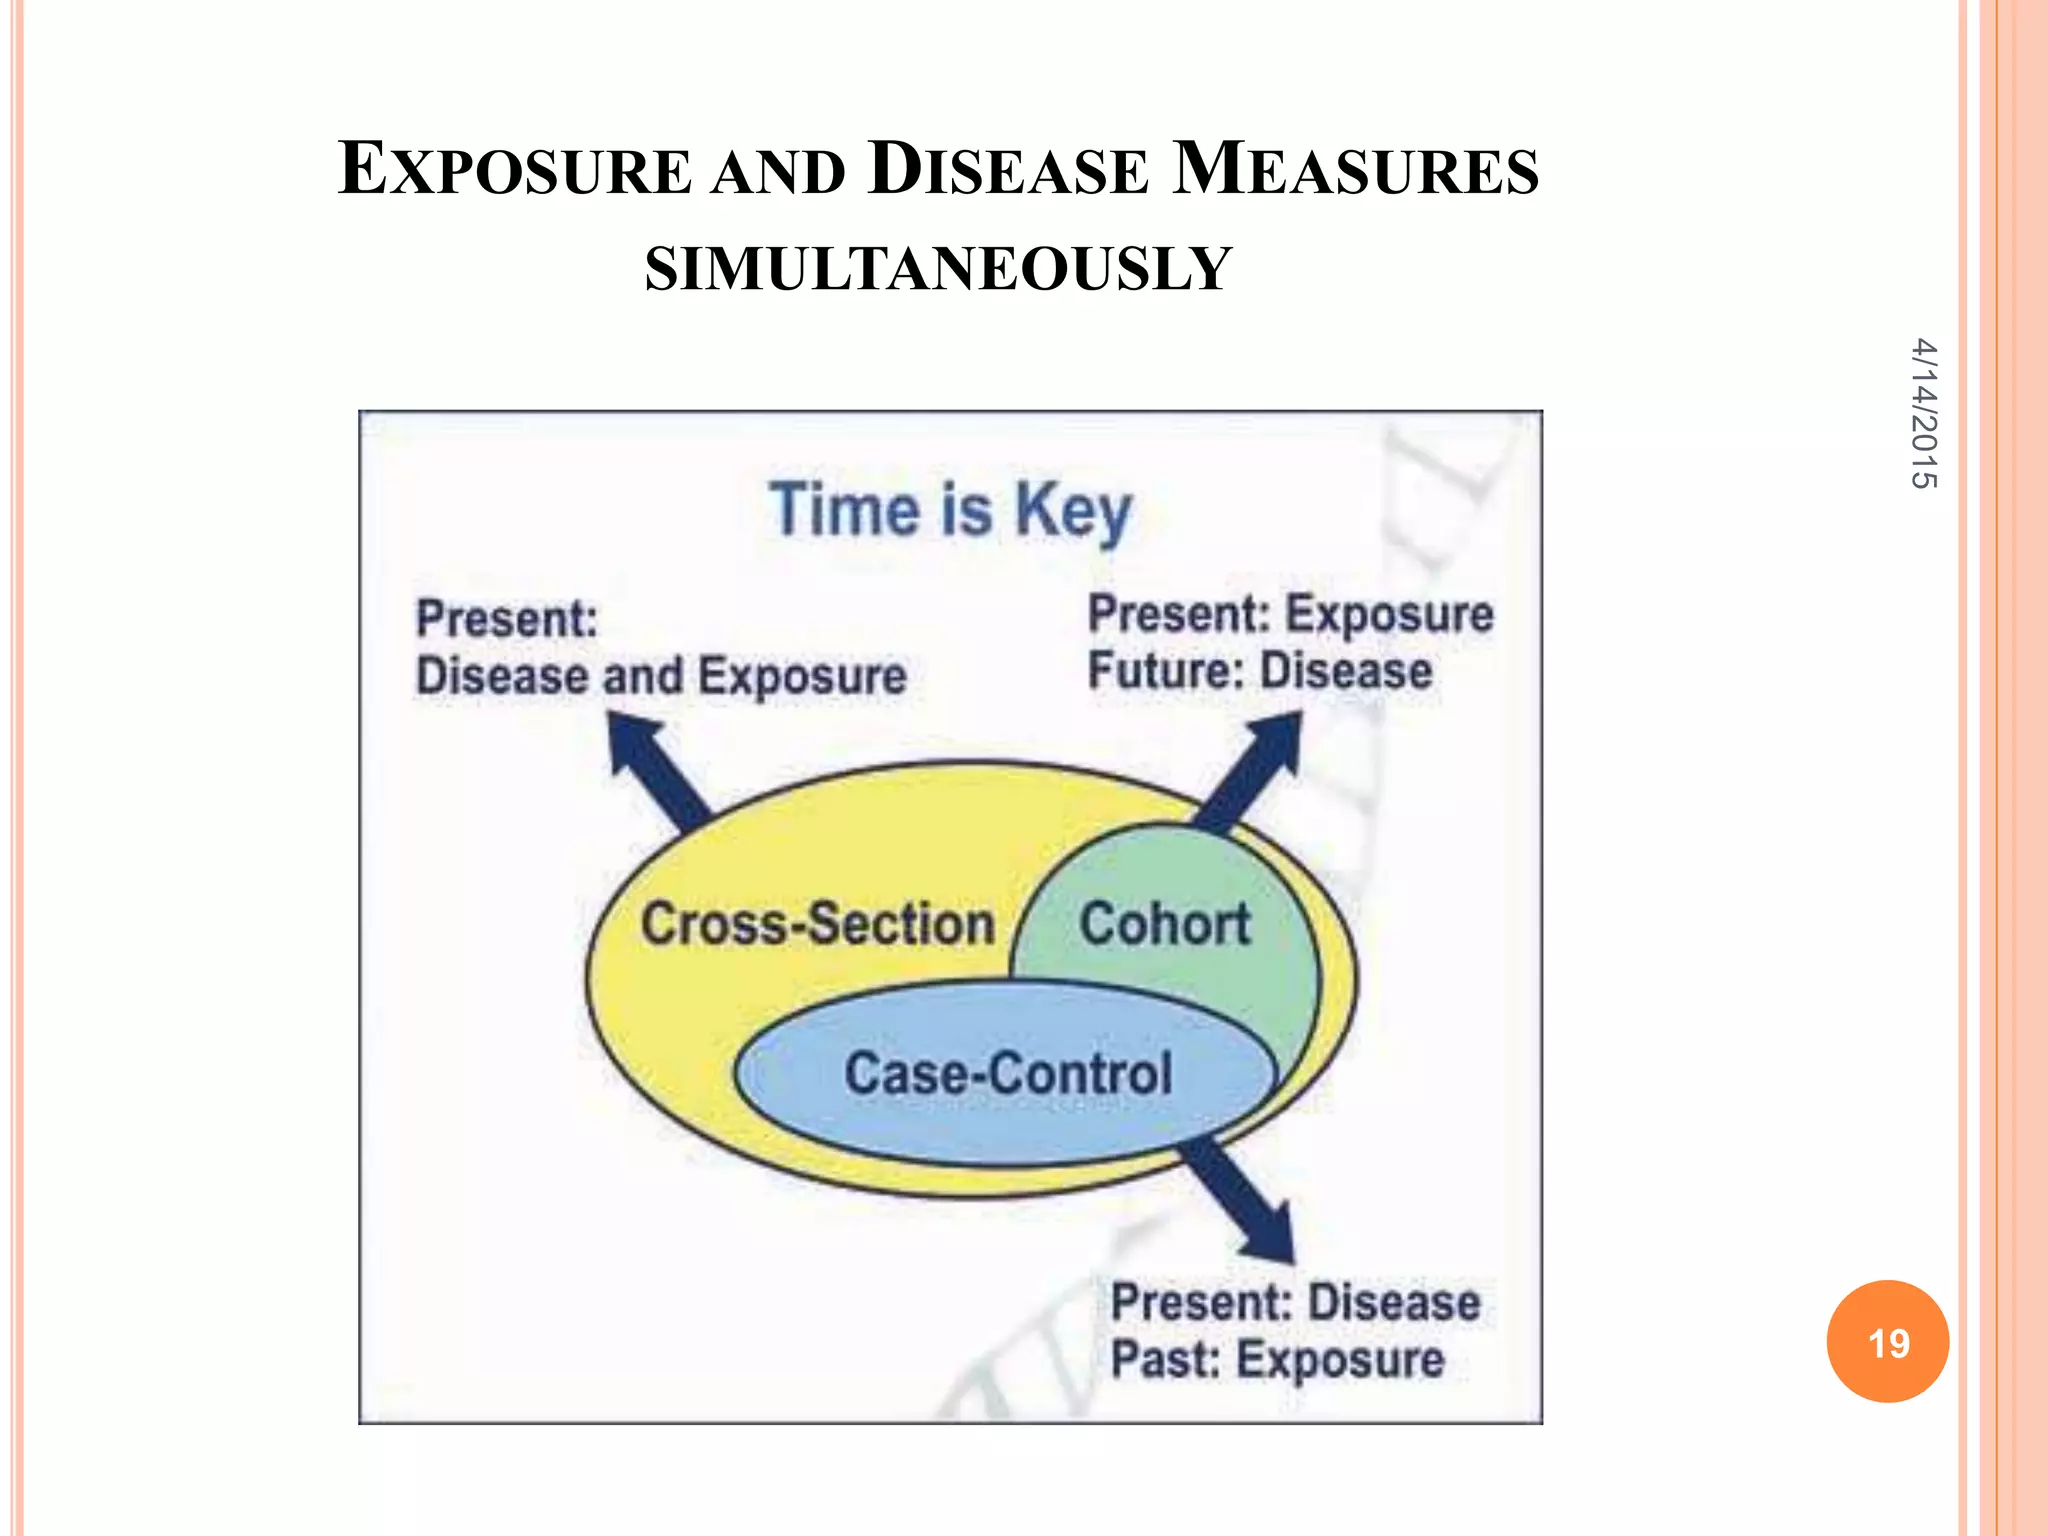


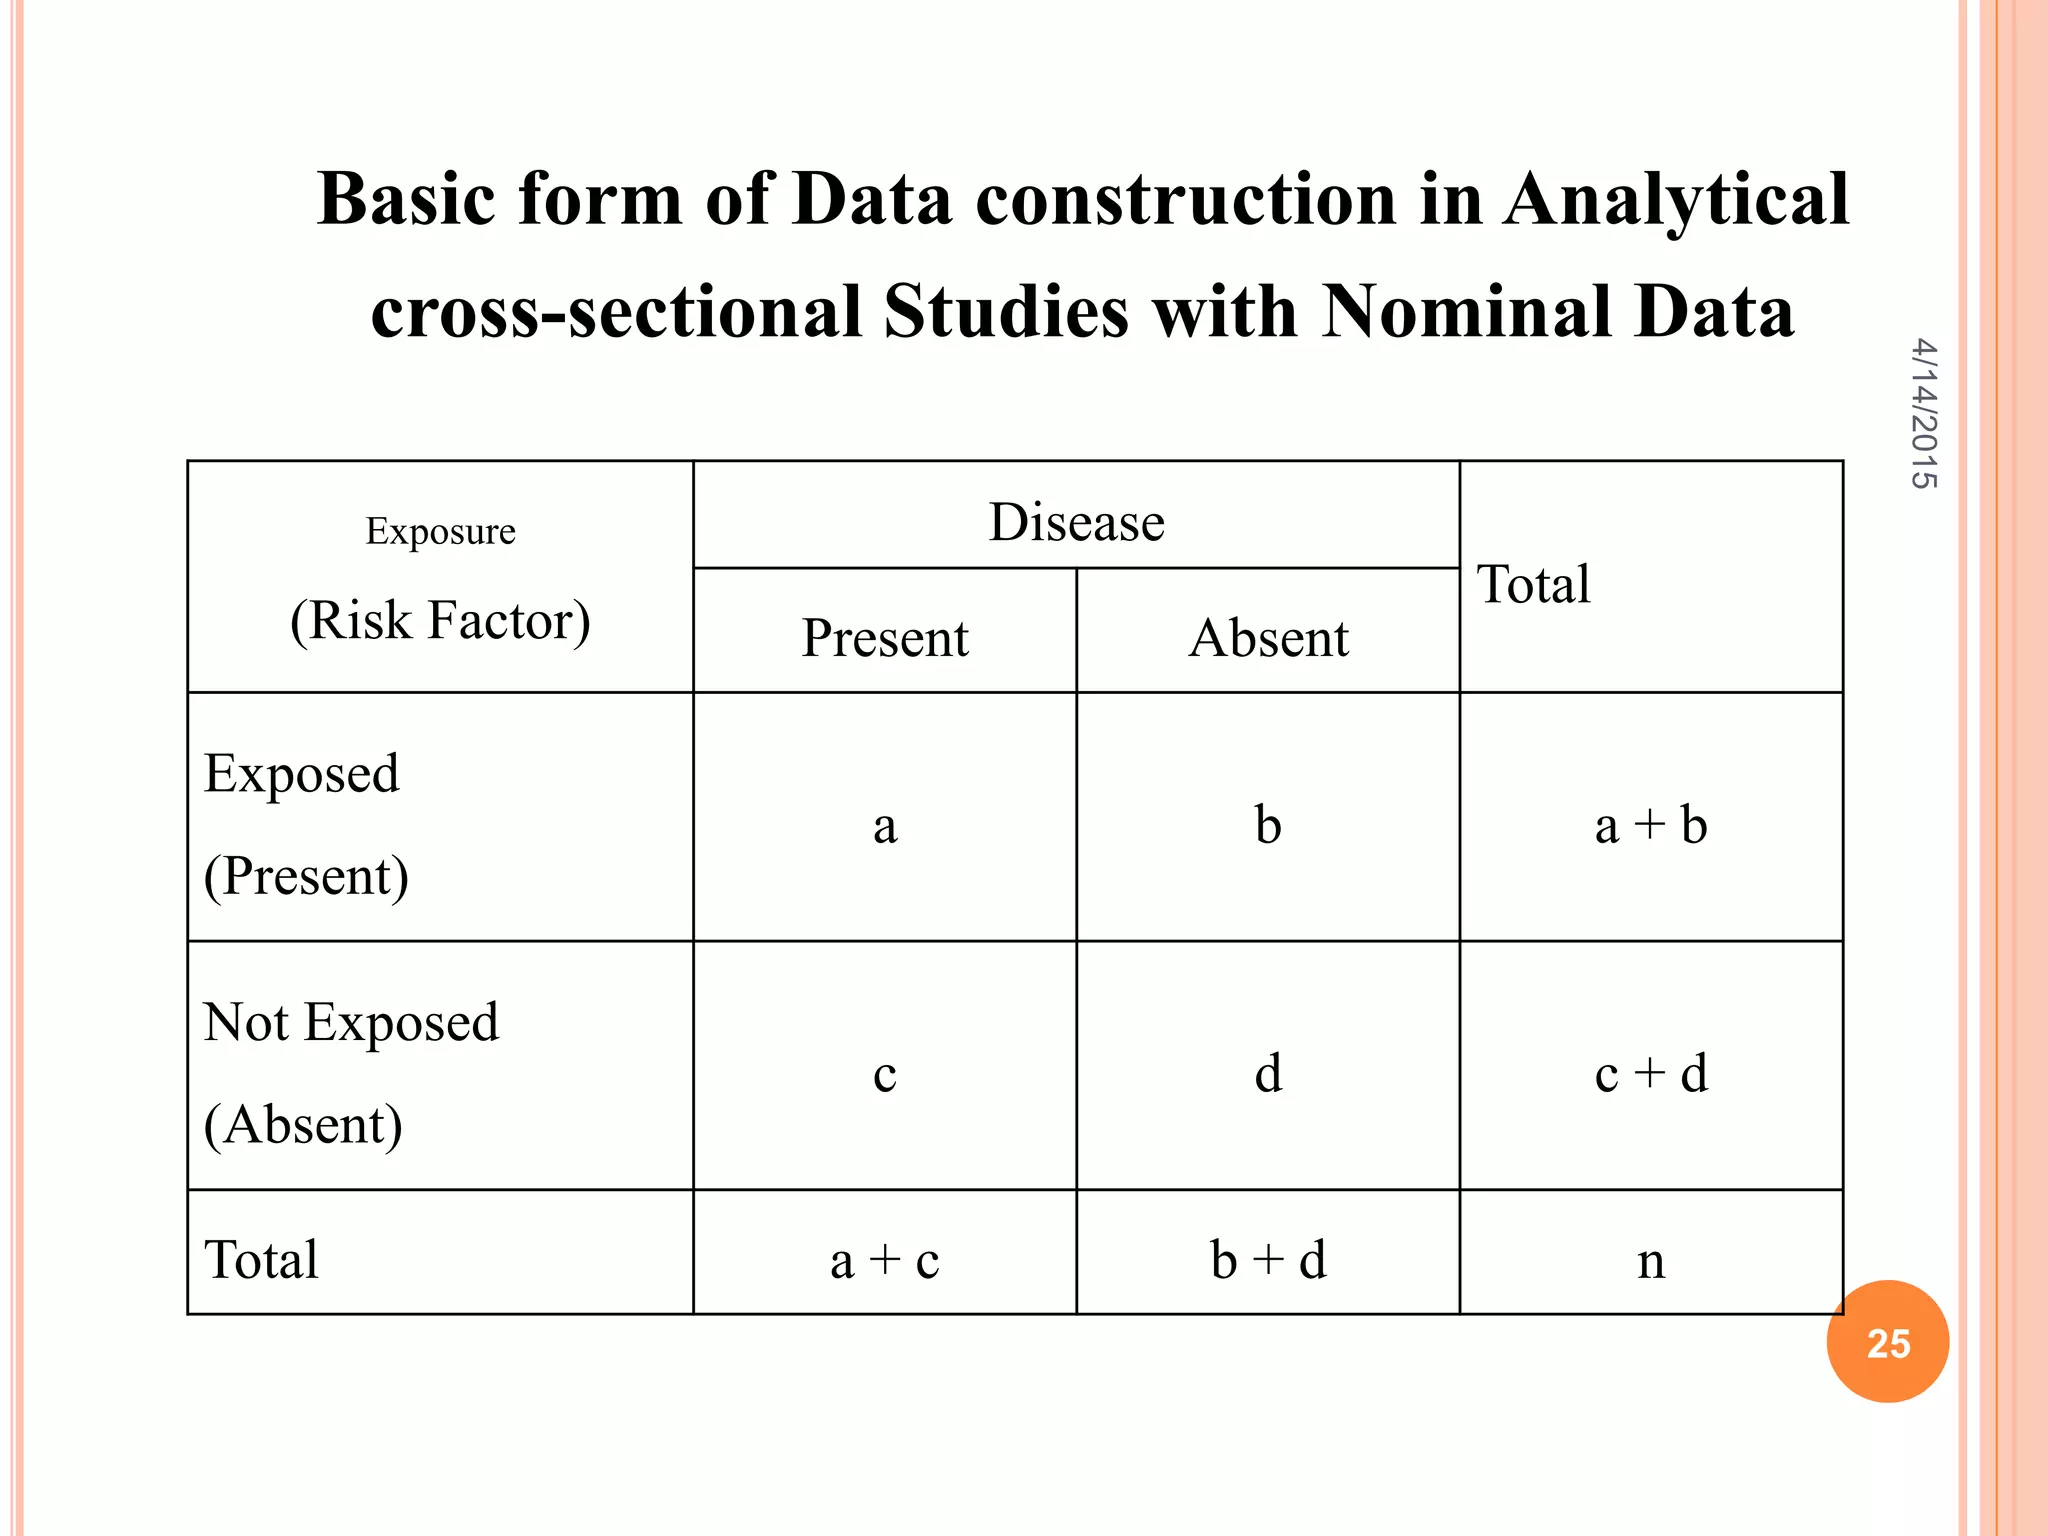
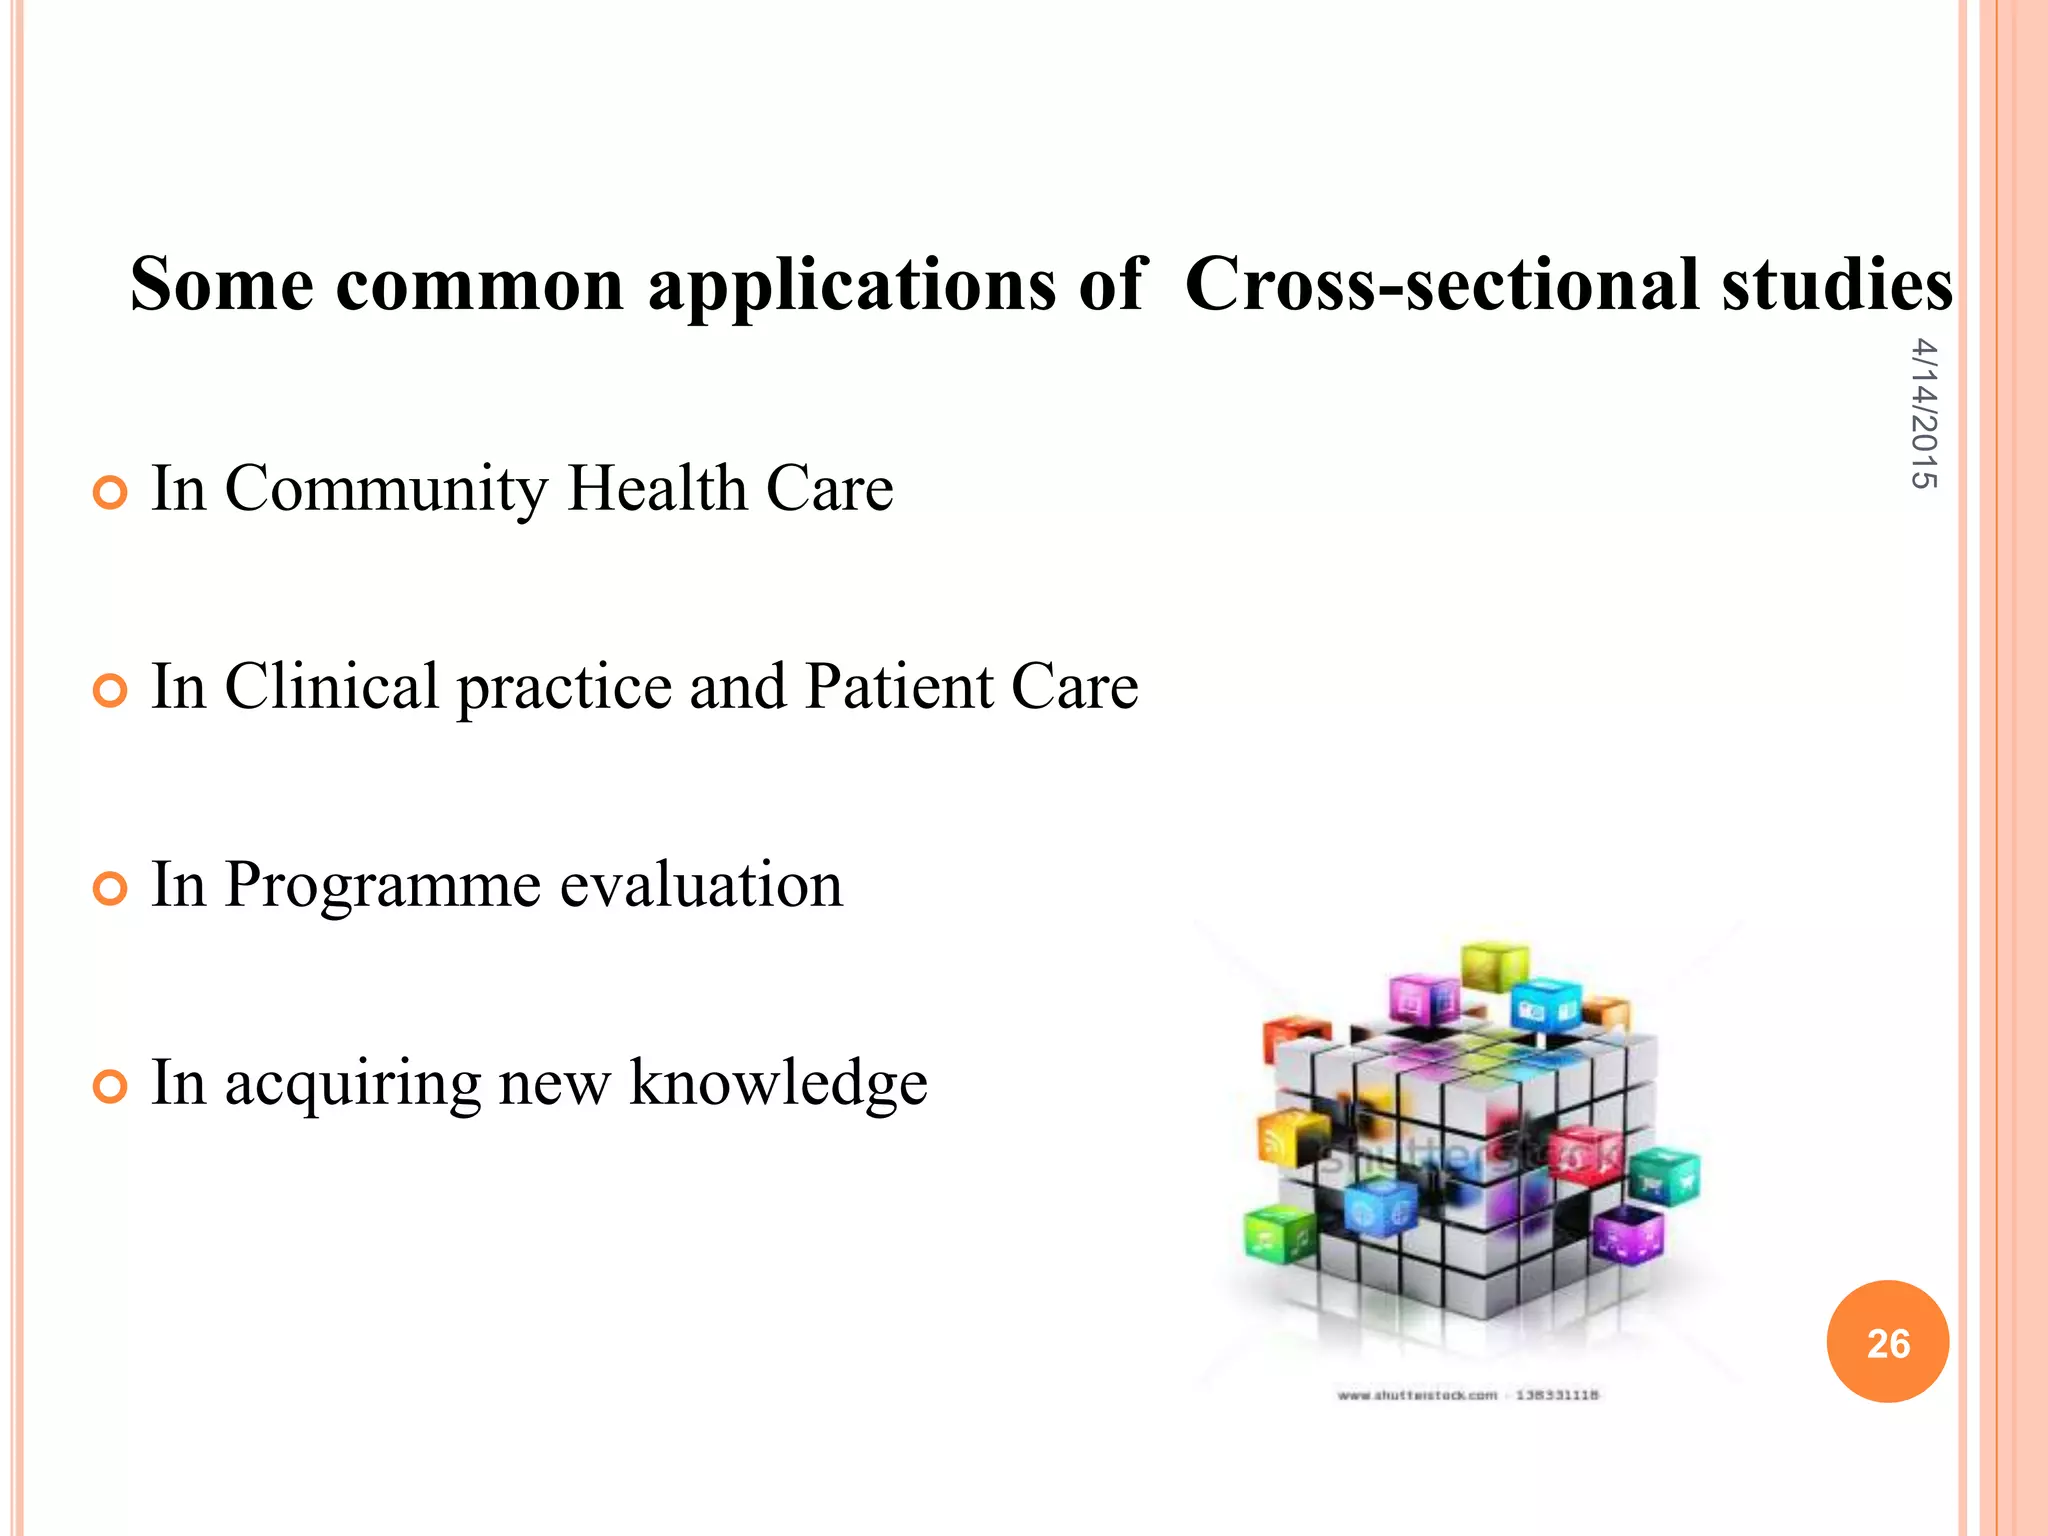


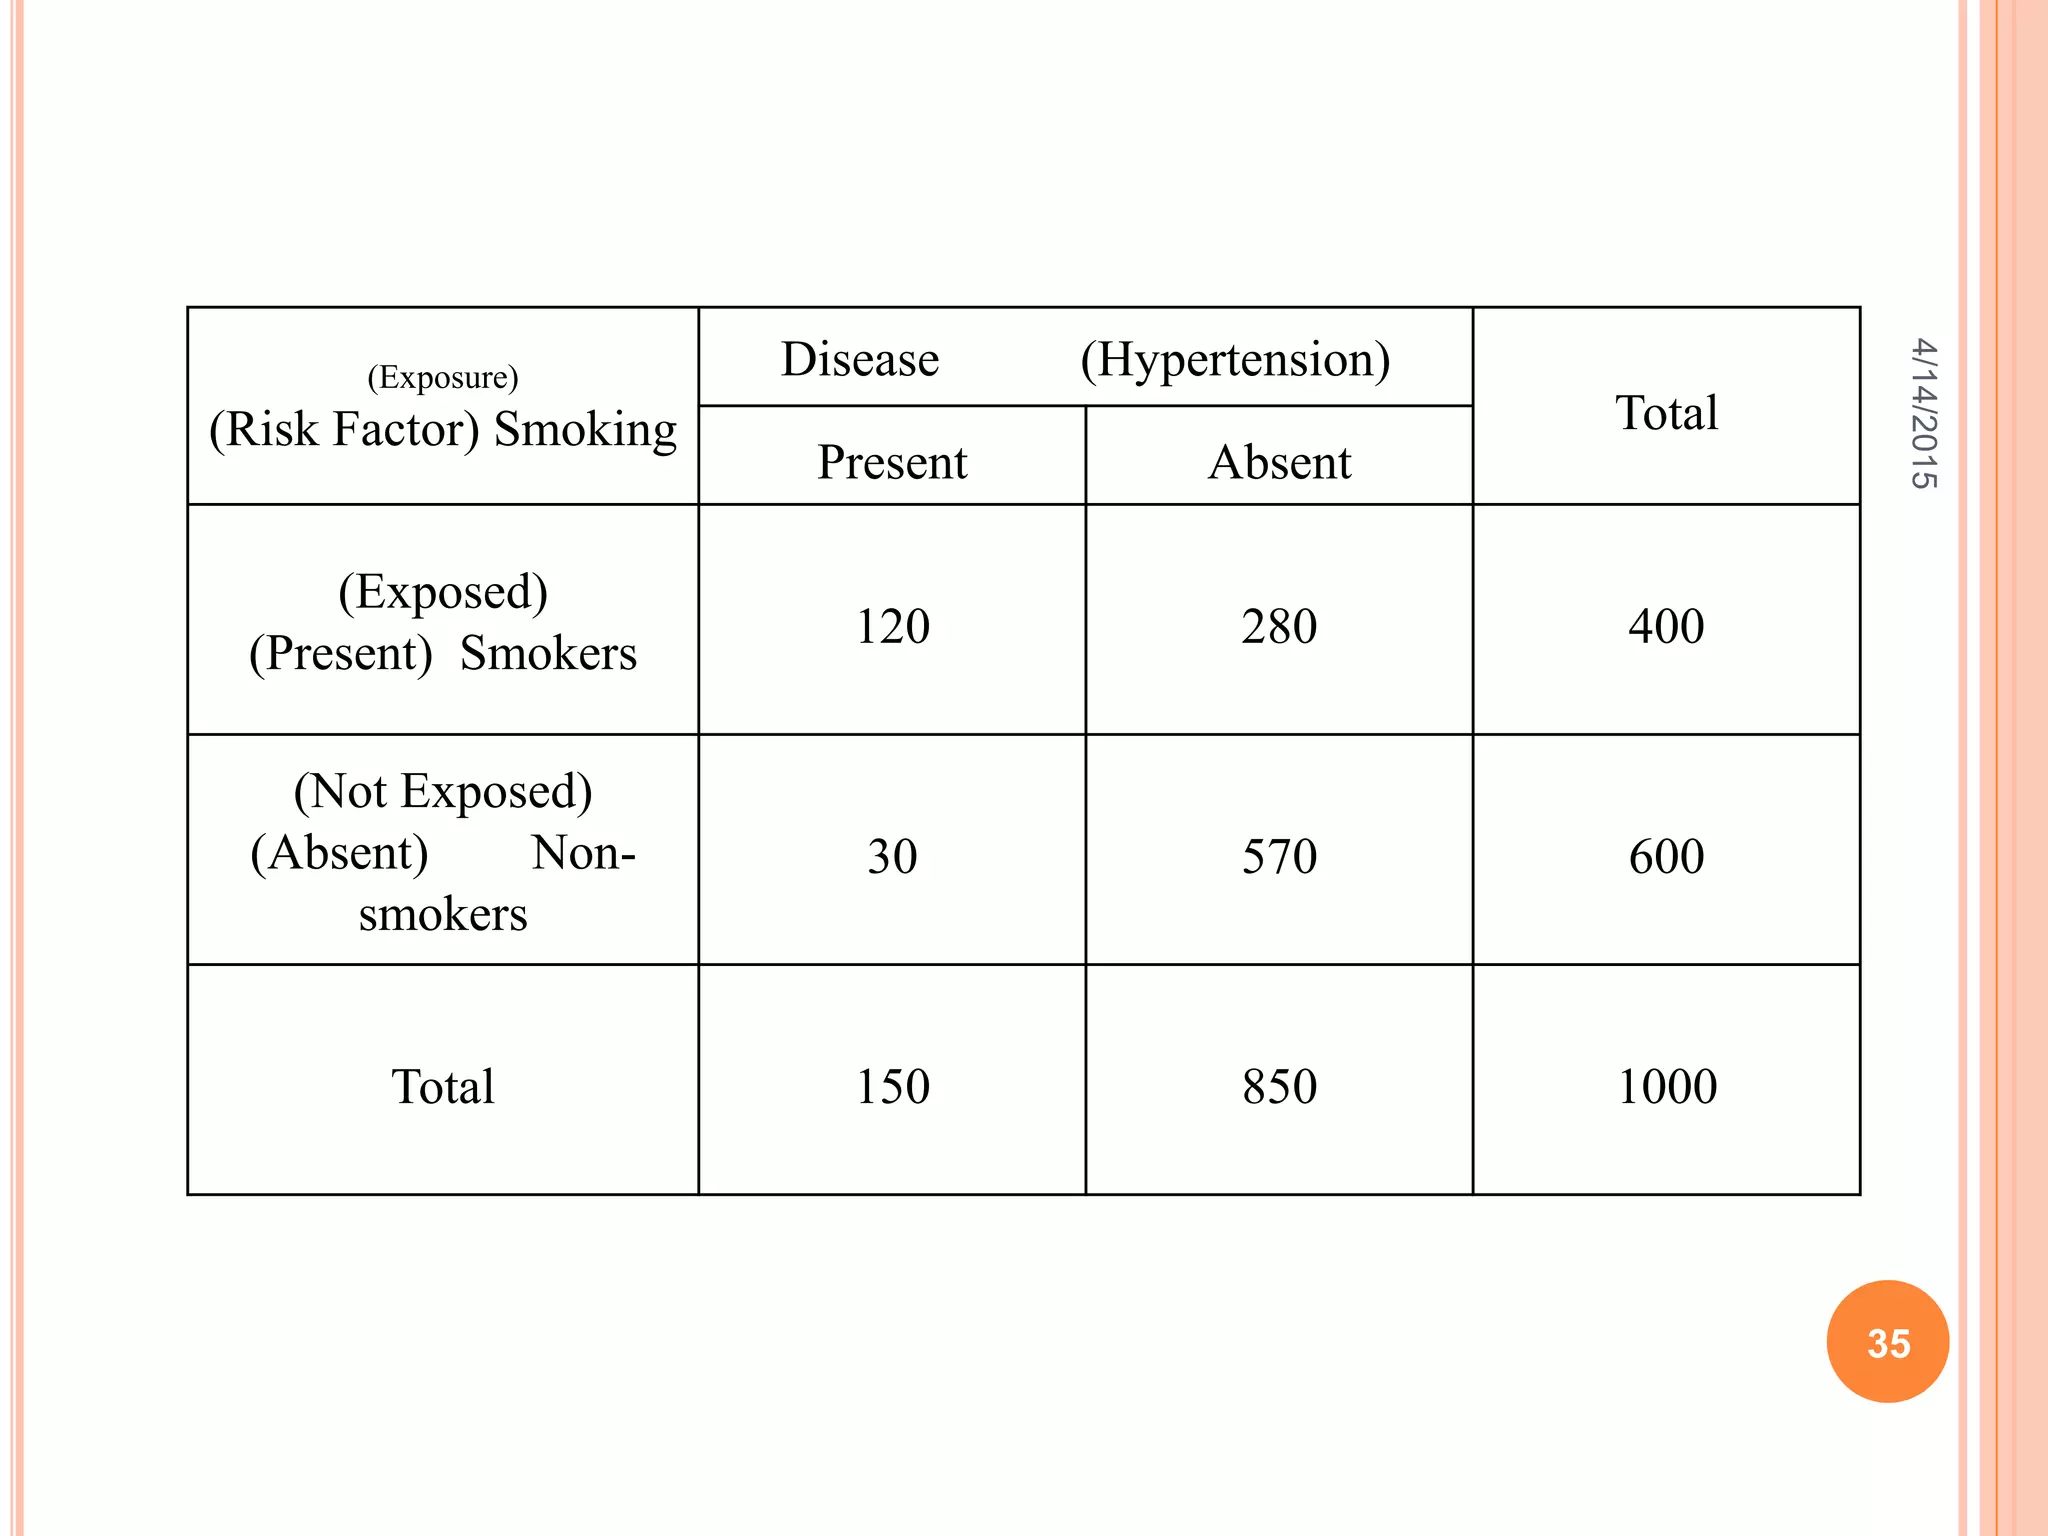
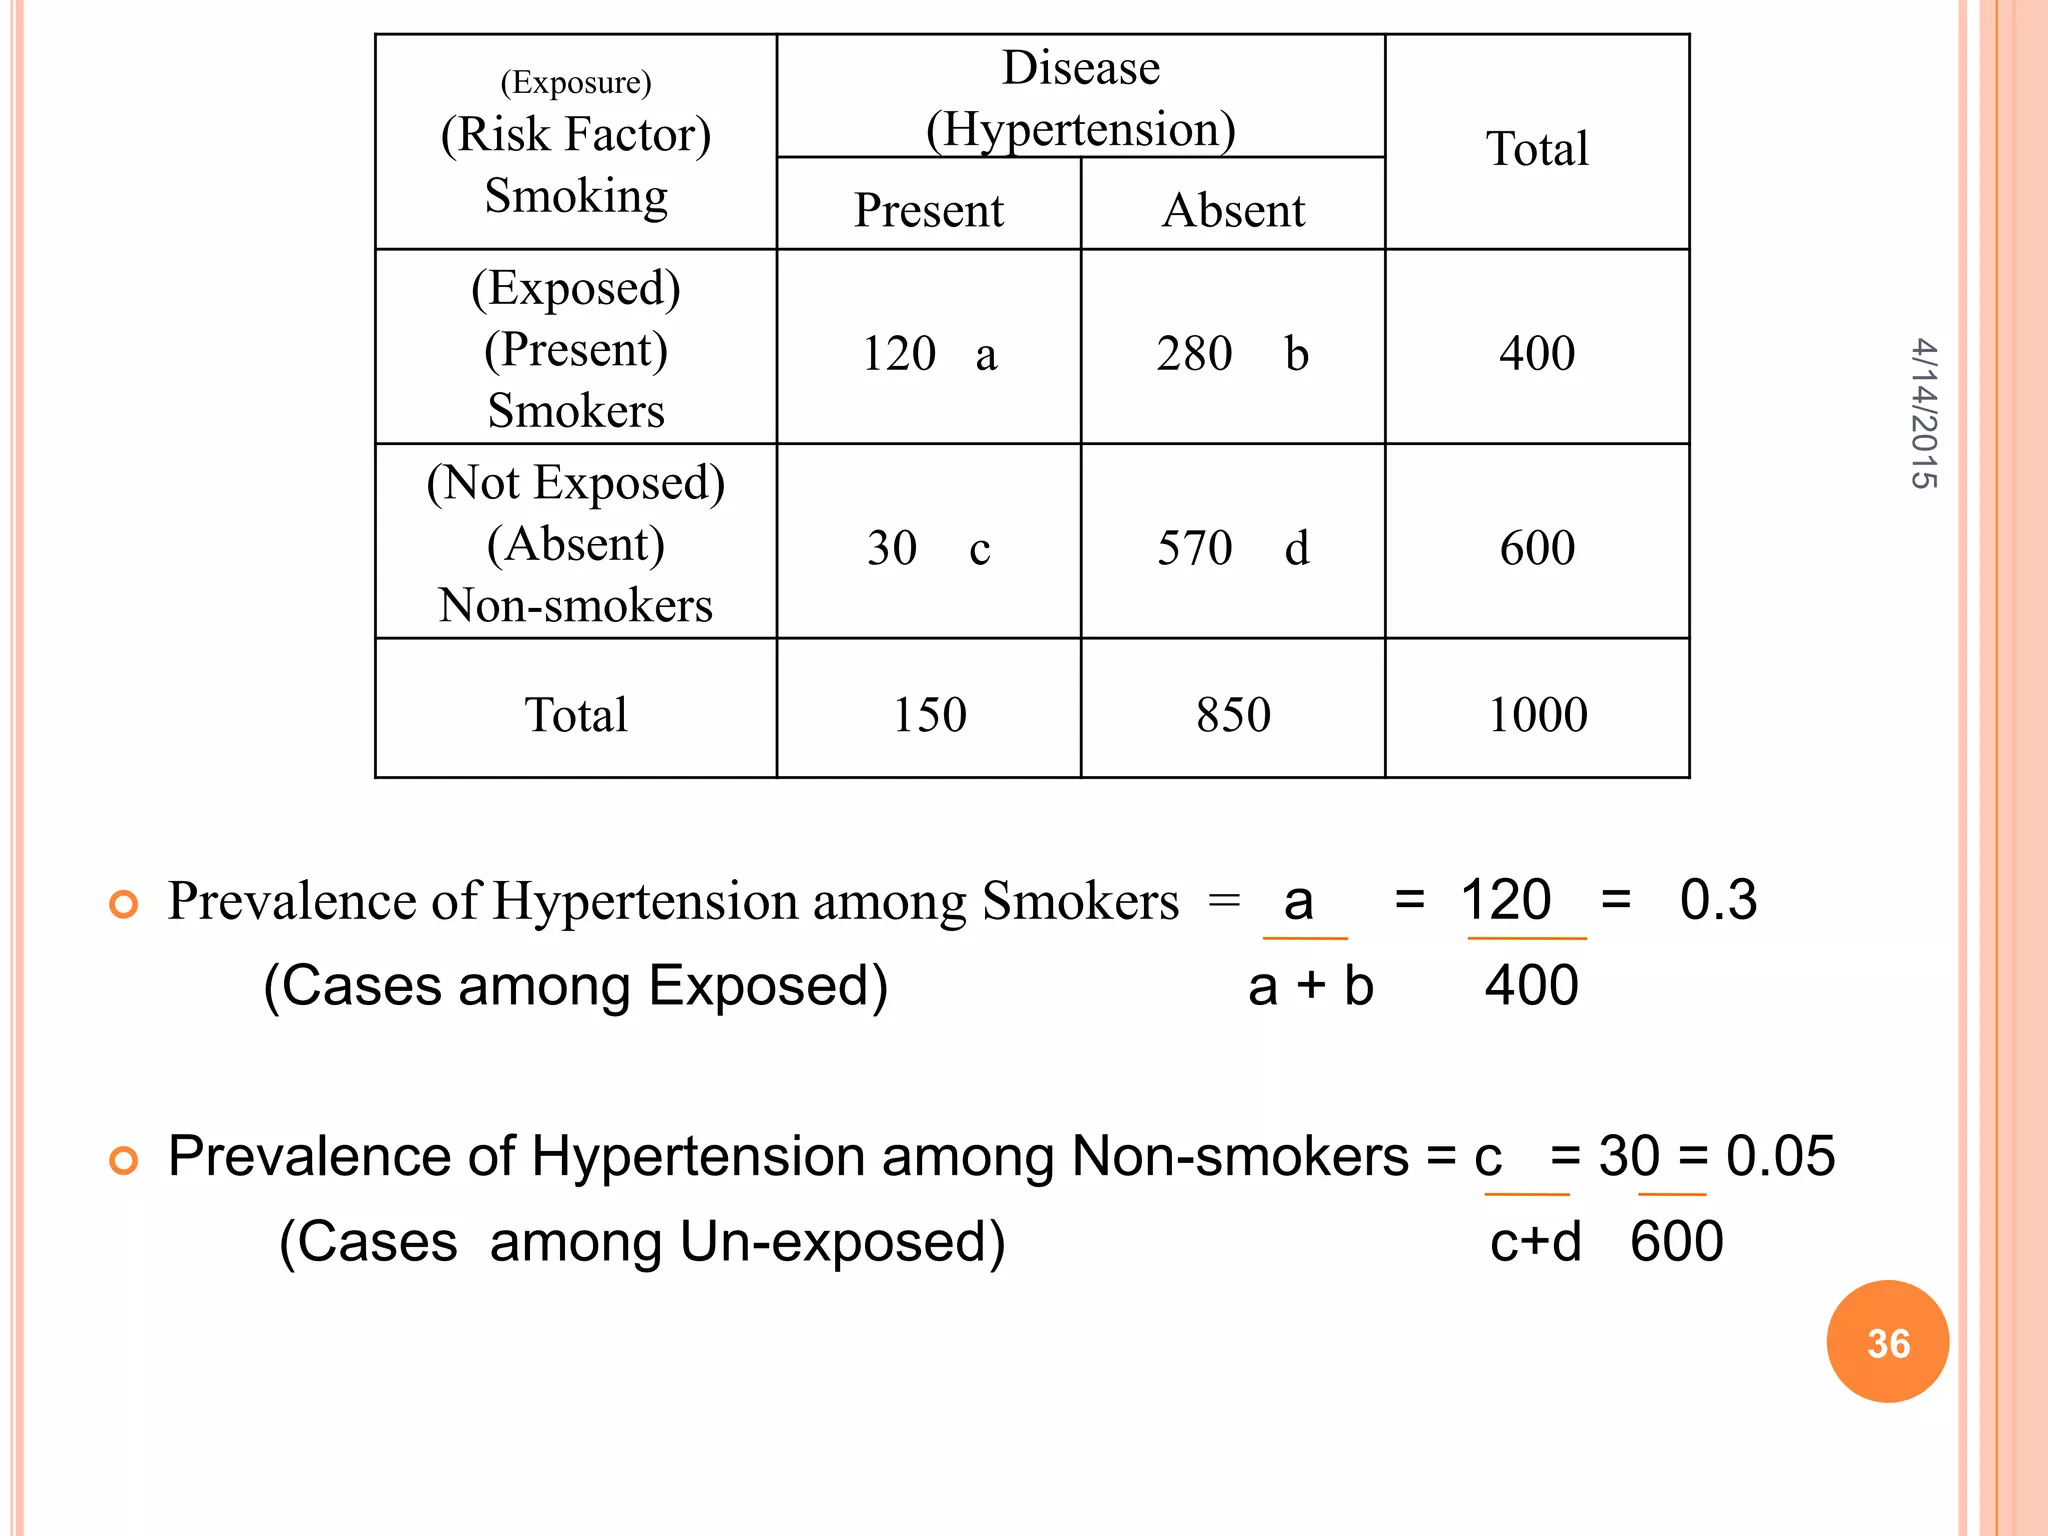
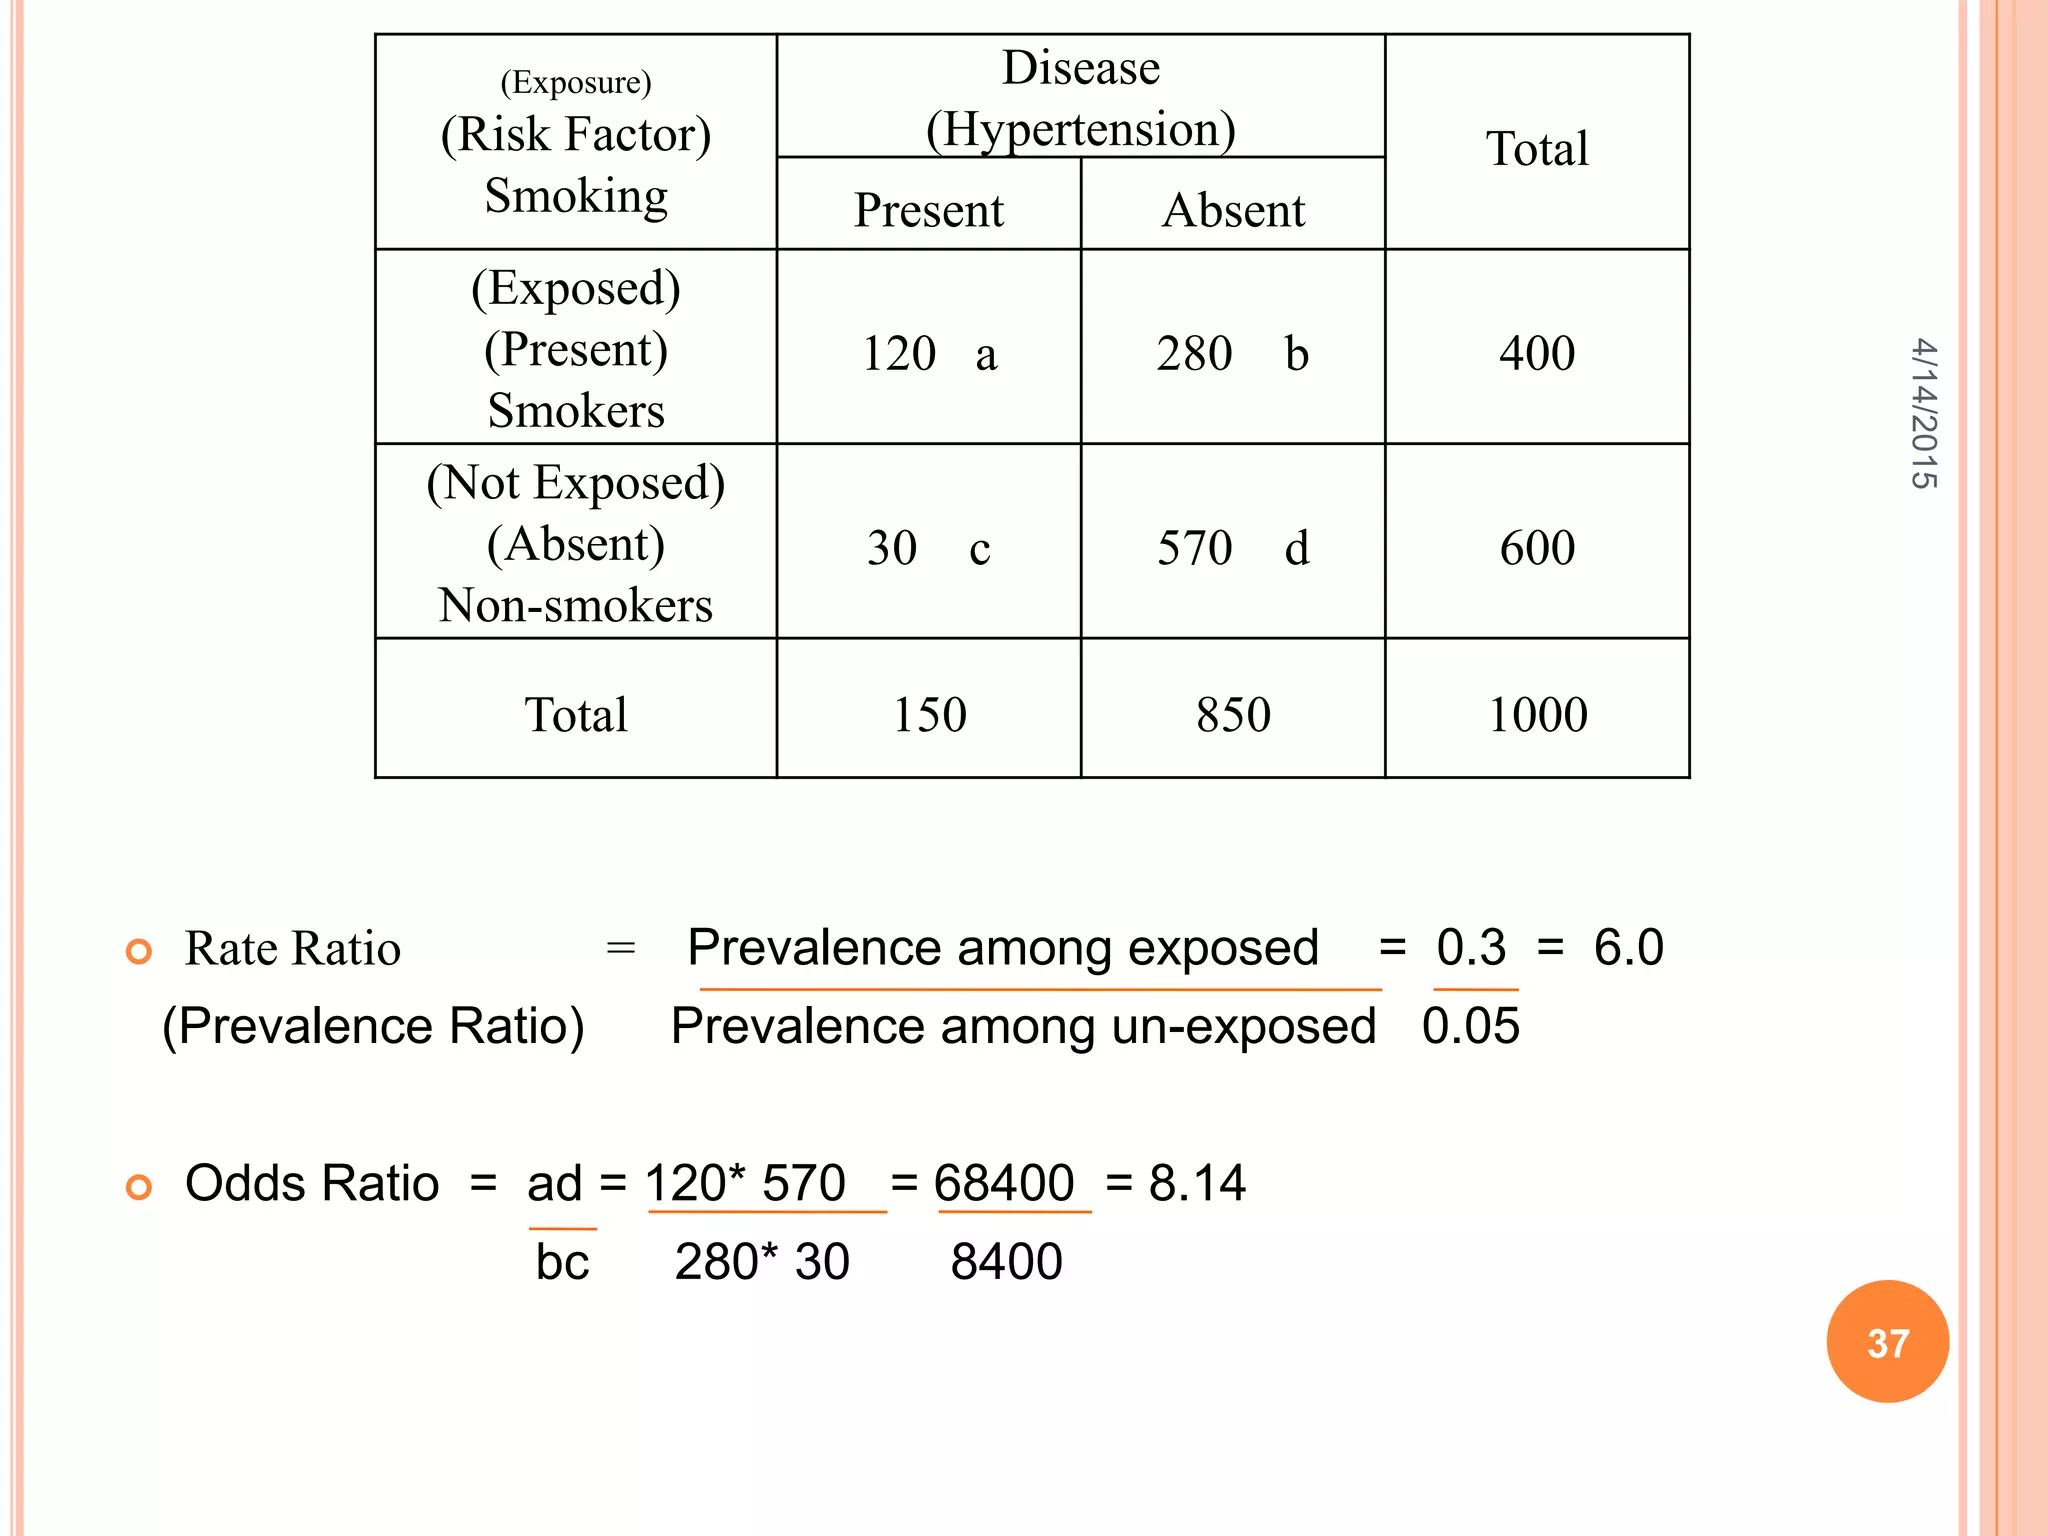
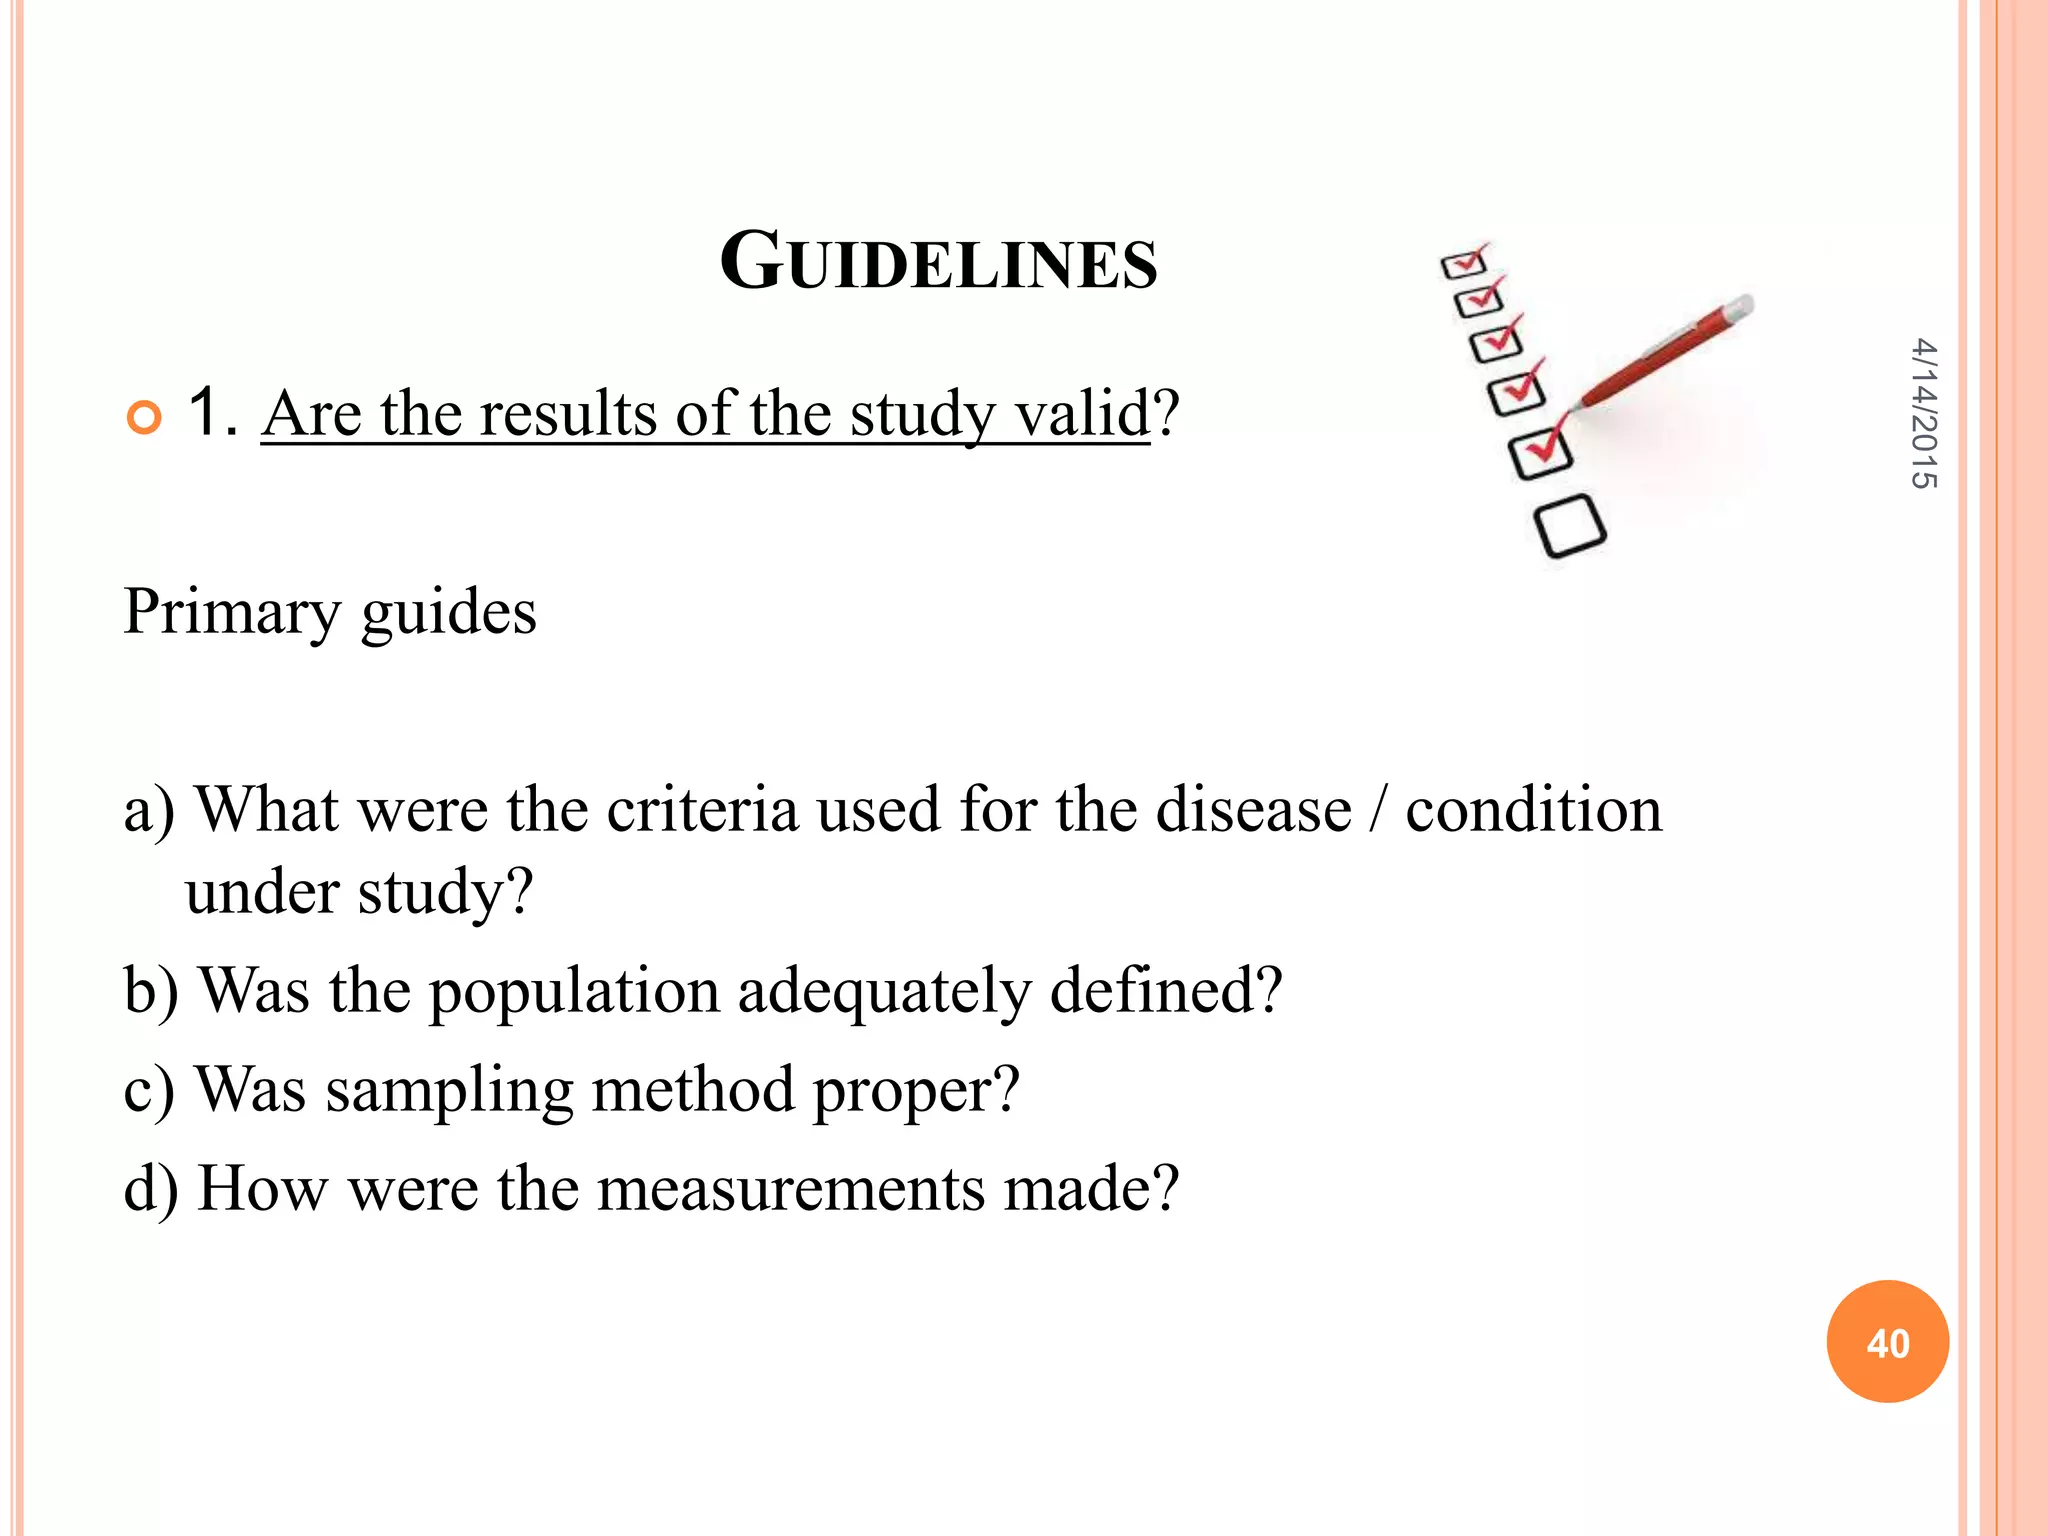
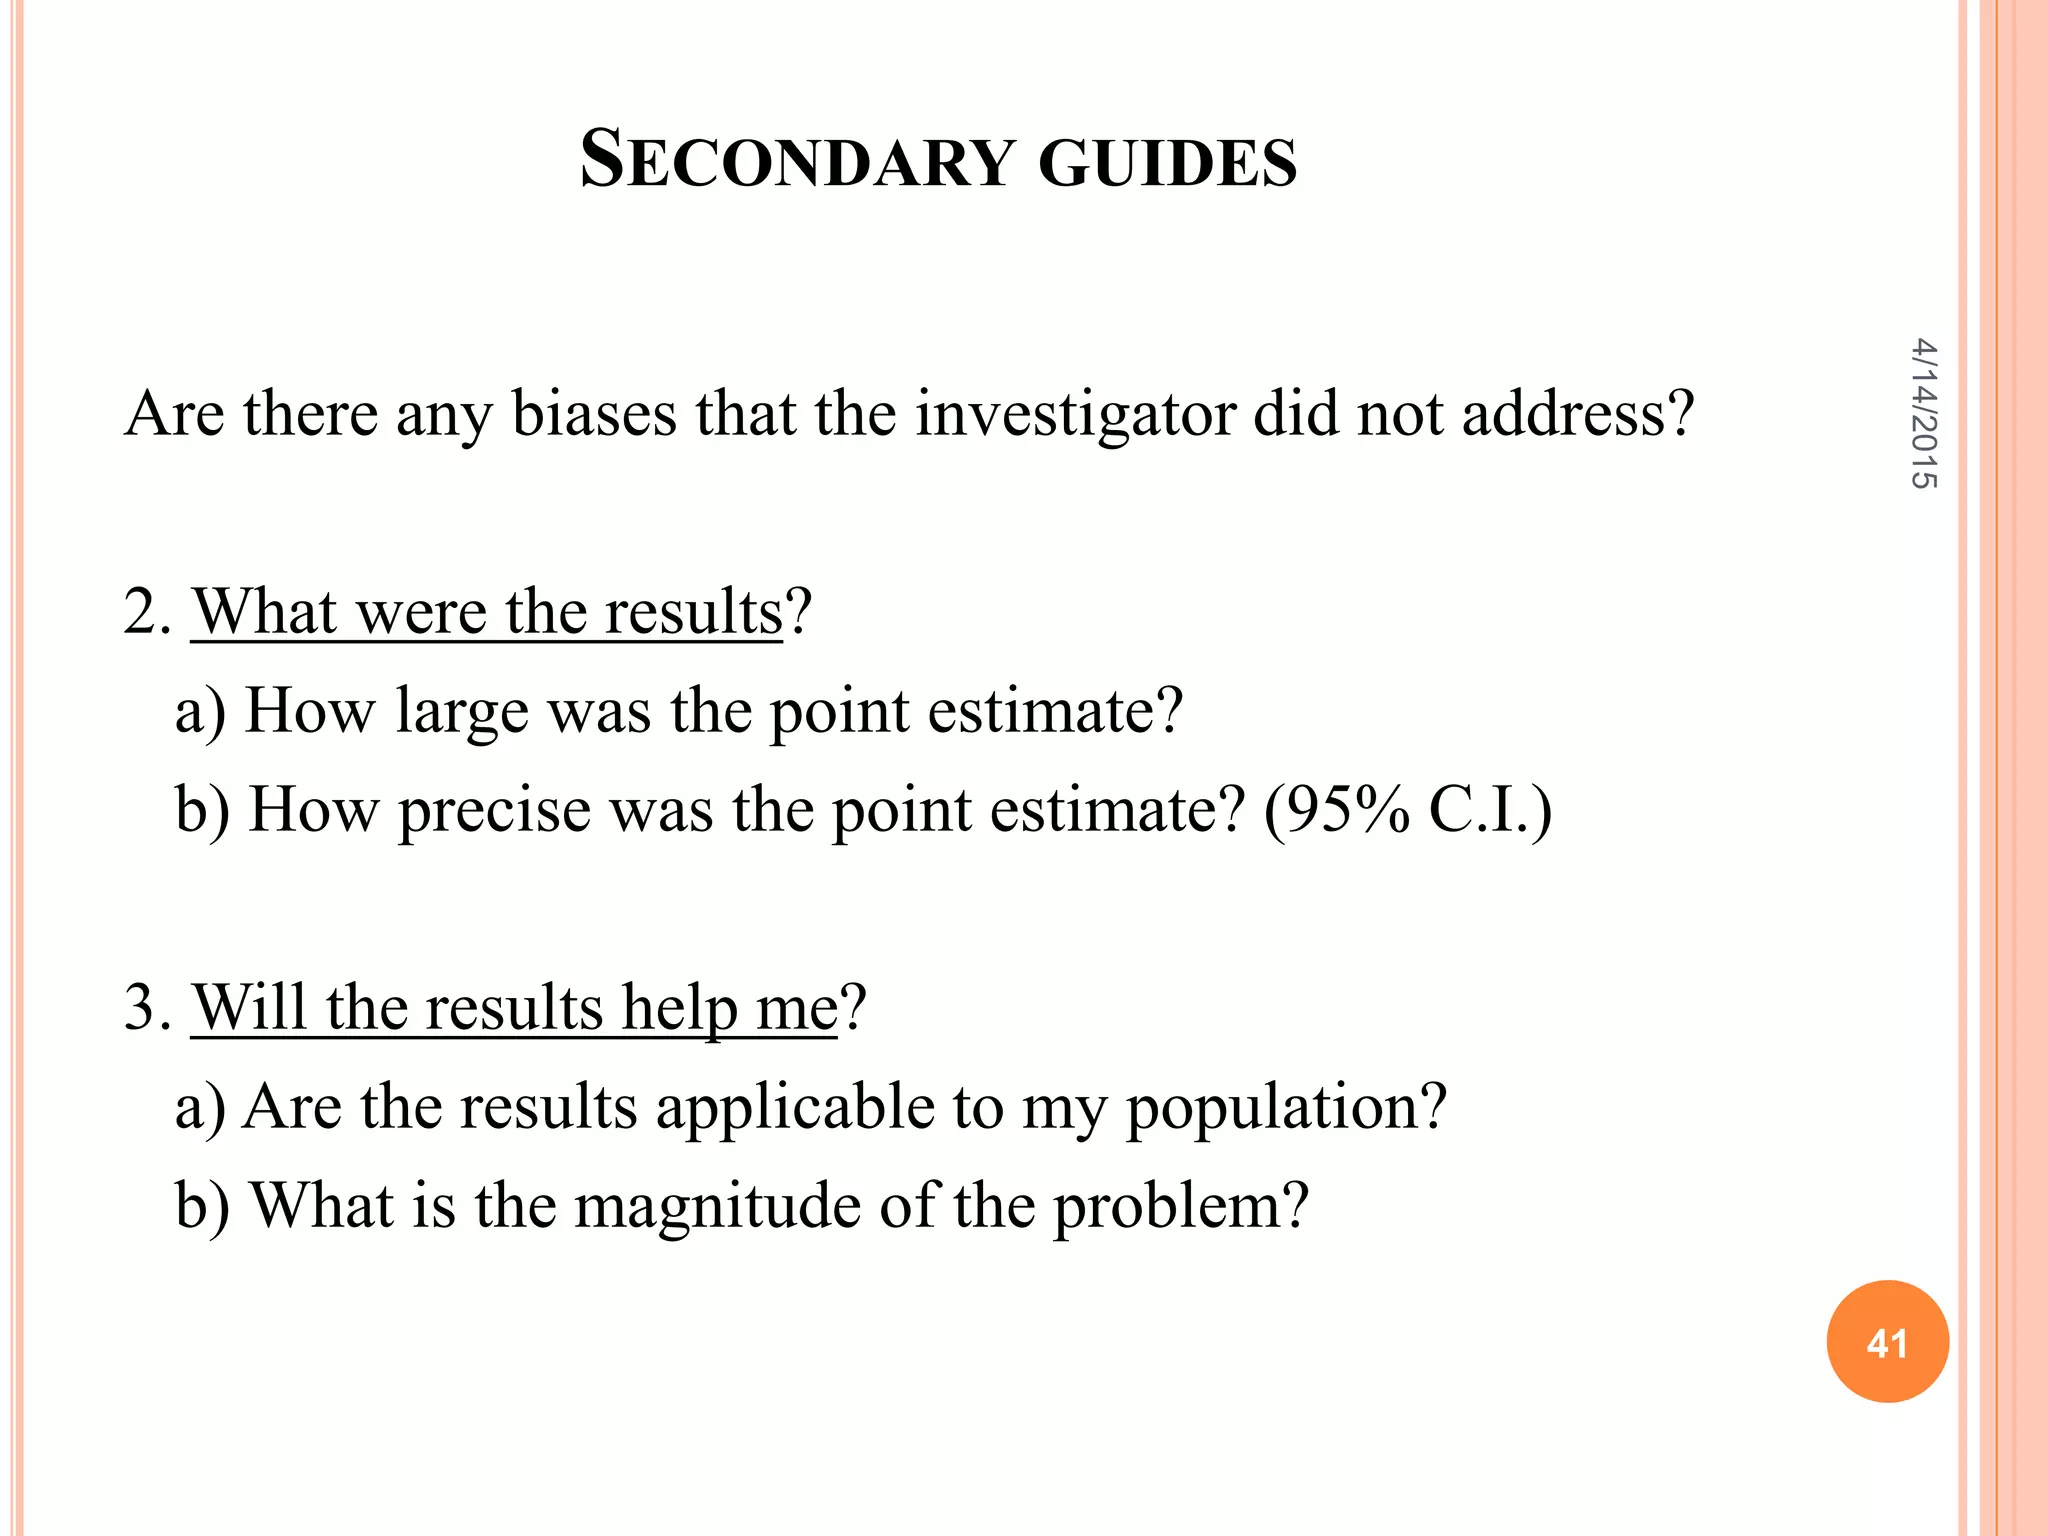


This document describes a cross-sectional study and its methodology. A cross-sectional study involves collecting data on exposure and outcome variables from a population at a single point in time. The document discusses the differences between descriptive and analytical cross-sectional studies. Descriptive studies measure prevalence, while analytical studies test associations between exposures and outcomes. The document provides examples of cross-sectional study design, biases, advantages, and guidelines for evaluating validity.


