Download to read offline


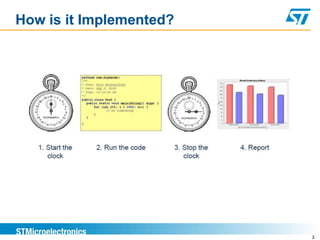

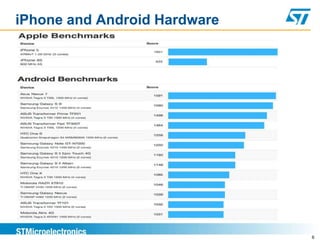
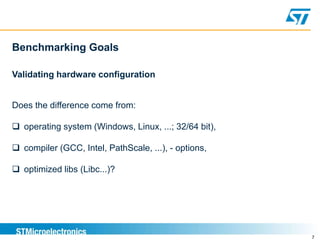
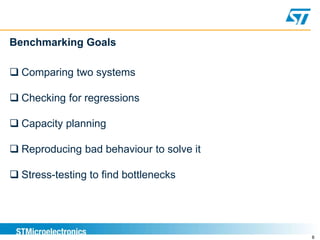
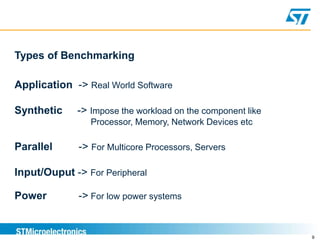
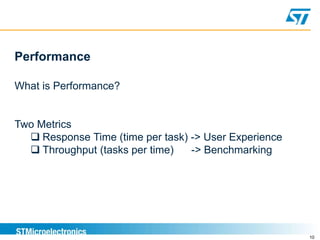


Benchmarking involves defining and measuring a system's performance using numeric metrics to compare how different hardware architectures or software implementations handle typical workloads. It is important for validating that a new system-on-chip provides equivalent or better performance than competitors. Benchmarking goals include comparing systems, checking for regressions, capacity planning, stress-testing to find bottlenecks, and reproducing issues to solve problems. Performance is measured using metrics like response time and throughput.