Downloaded 46 times

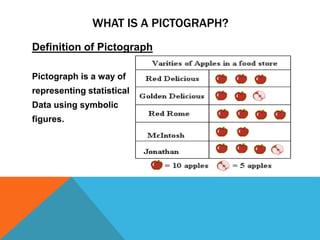
Pictographs are a way of representing statistical data using symbolic figures. Pictographs use symbols or pictures to represent quantities or convey information. Pictographs provide a visual summary of data or information through symbolic images rather than words or numbers.