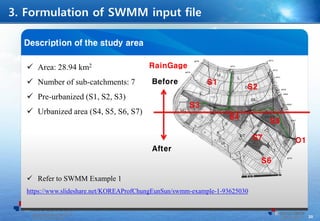
This document describes the formulation of a SWMM input file to model stormwater runoff and water quality in an urban watershed. Key steps include:
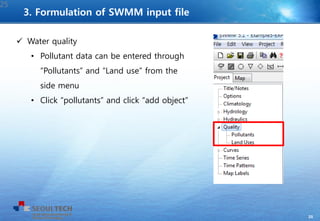
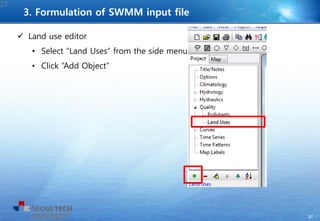
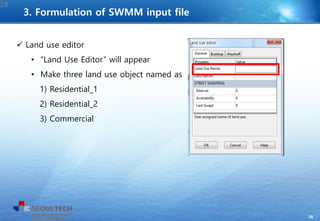
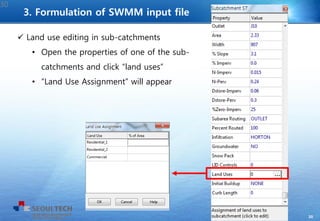
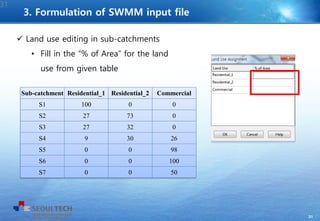
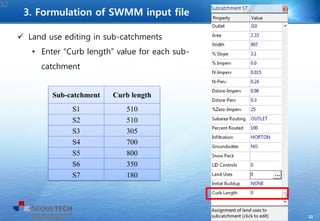
1) Defining pollutants, land uses, and assigning land use percentages to subcatchments
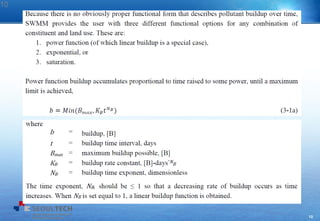
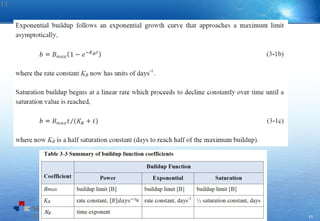
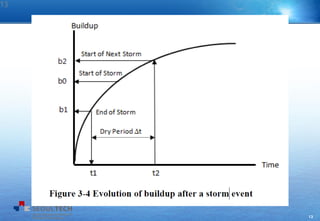
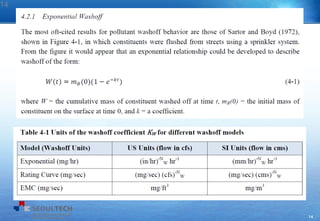
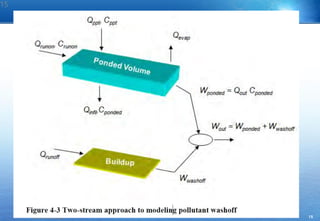
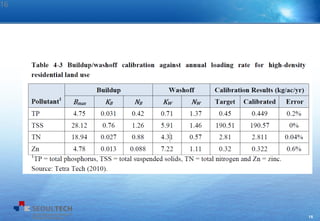
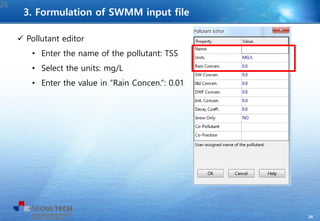
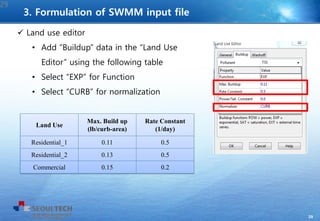
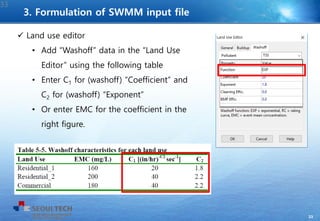
2) Specifying buildup and washoff parameters for pollutant loading
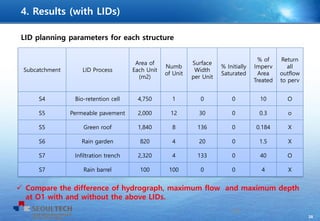
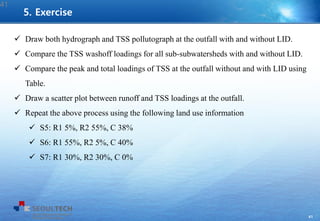
3) Adding low impact development (LID) controls to certain subcatchments
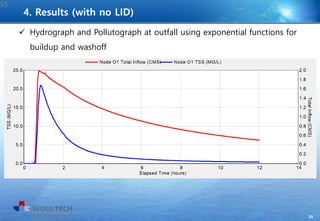
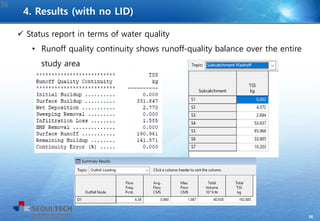
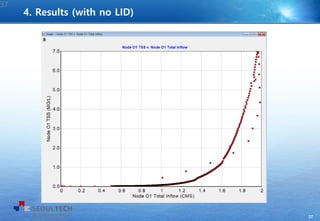
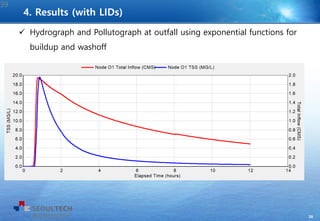
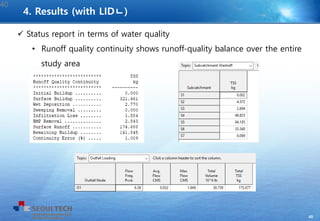
4) Comparing model results for hydrographs and pollutographs with and without LIDs to analyze their impact on peak flows and pollutant loads.