Downloaded 17 times


![Formula Notes
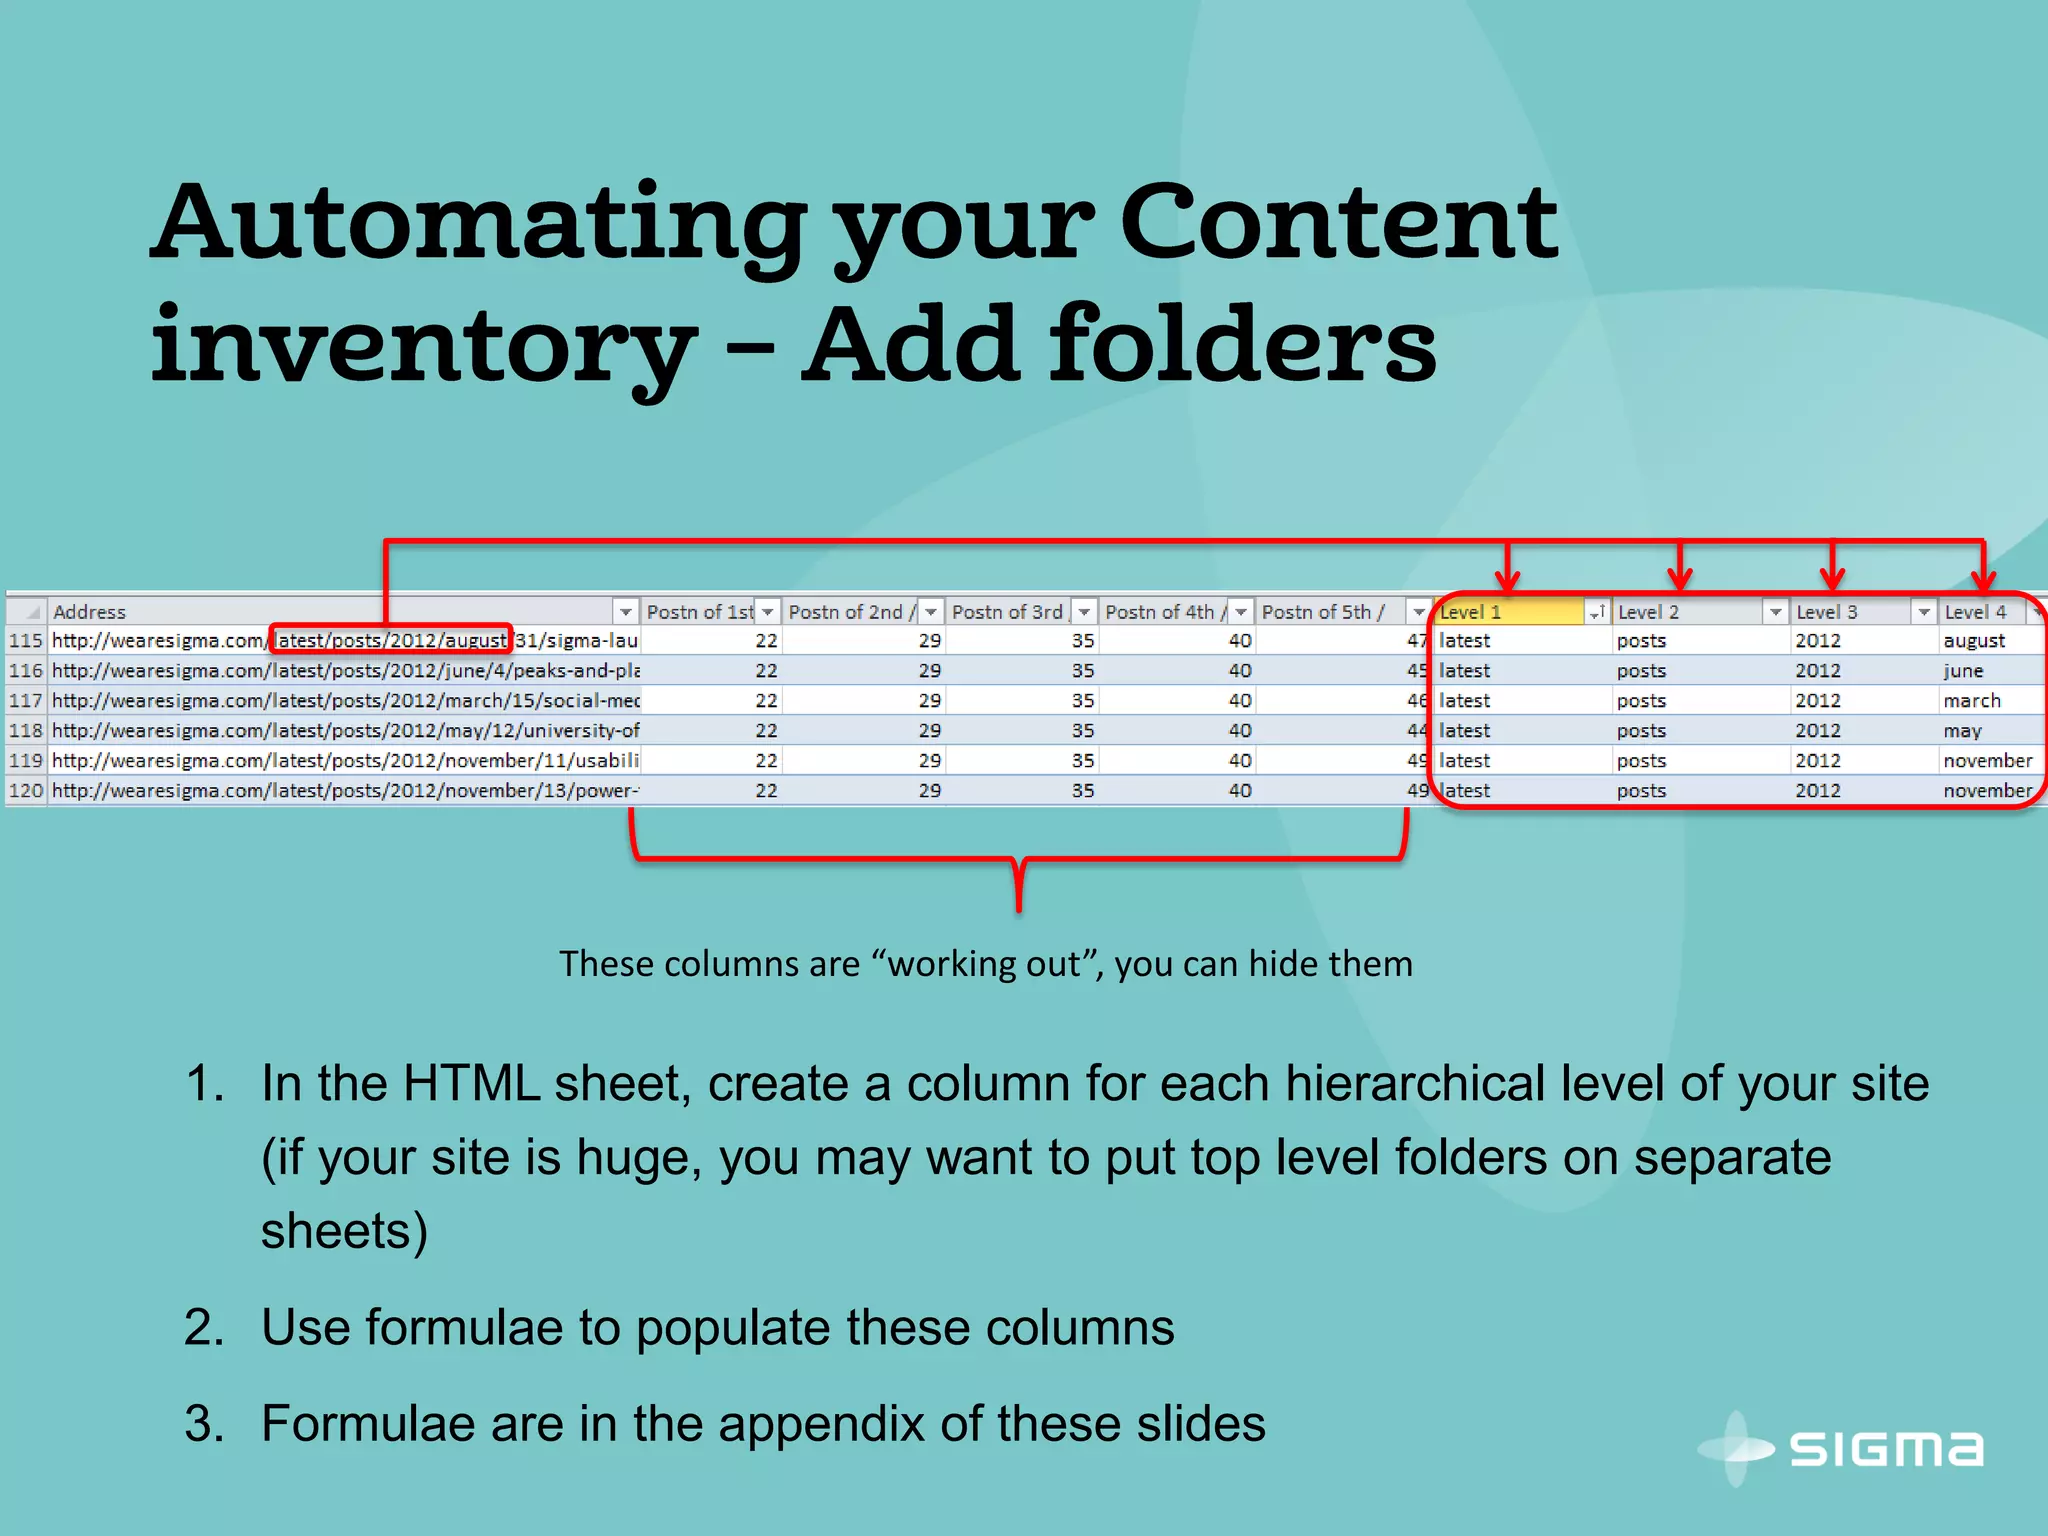
=SEARCH("/",A3,21) Returns the position of the first slash in the URL
In column B in a table column called “Postn of 1st /”
21 is the position of the last character of our shortest domain., edit for your
site
=IFERROR(SEARCH("/",[Address],([Postn of 1st /]+1)),"") Returns position of 2nd /. Returns blank if there is no 2nd slash.
In column C in a table column called “Postn of 2nd /”
=IFERROR(SEARCH("/",[Address],([Postn of 2nd /]+1)),"") Returns position of 3rd /. Returns blank if there is no 3rd slash.
In column D in a table column called “Postn of 3rd /”
Repeat for each part of your URL
=IFERROR(MID([@Address],([@[Postn of 1st /]]+1),([@[Postn
of 2nd /]]-[@[Postn of 1st /]]-1)),"!Root")
Shows directories at Level 1 of your site
Returns text between the first and second slashes (between “Postn of 1st /”
and “Postn of 2nd /”)
Returns “!Root” when there is no second slash (the “!” keeps root at the top
when sorting
=IFERROR(MID([@Address],([@[Postn of 2nd /]]+1),([@[Postn
of 3rd /]]-[@[Postn of 2nd /]]-1)),"")
Shows directories at Level 2 of your site
Returns text between the second and third slashes . Returns blank when there
is no third slash
Repeat for each part of your URL
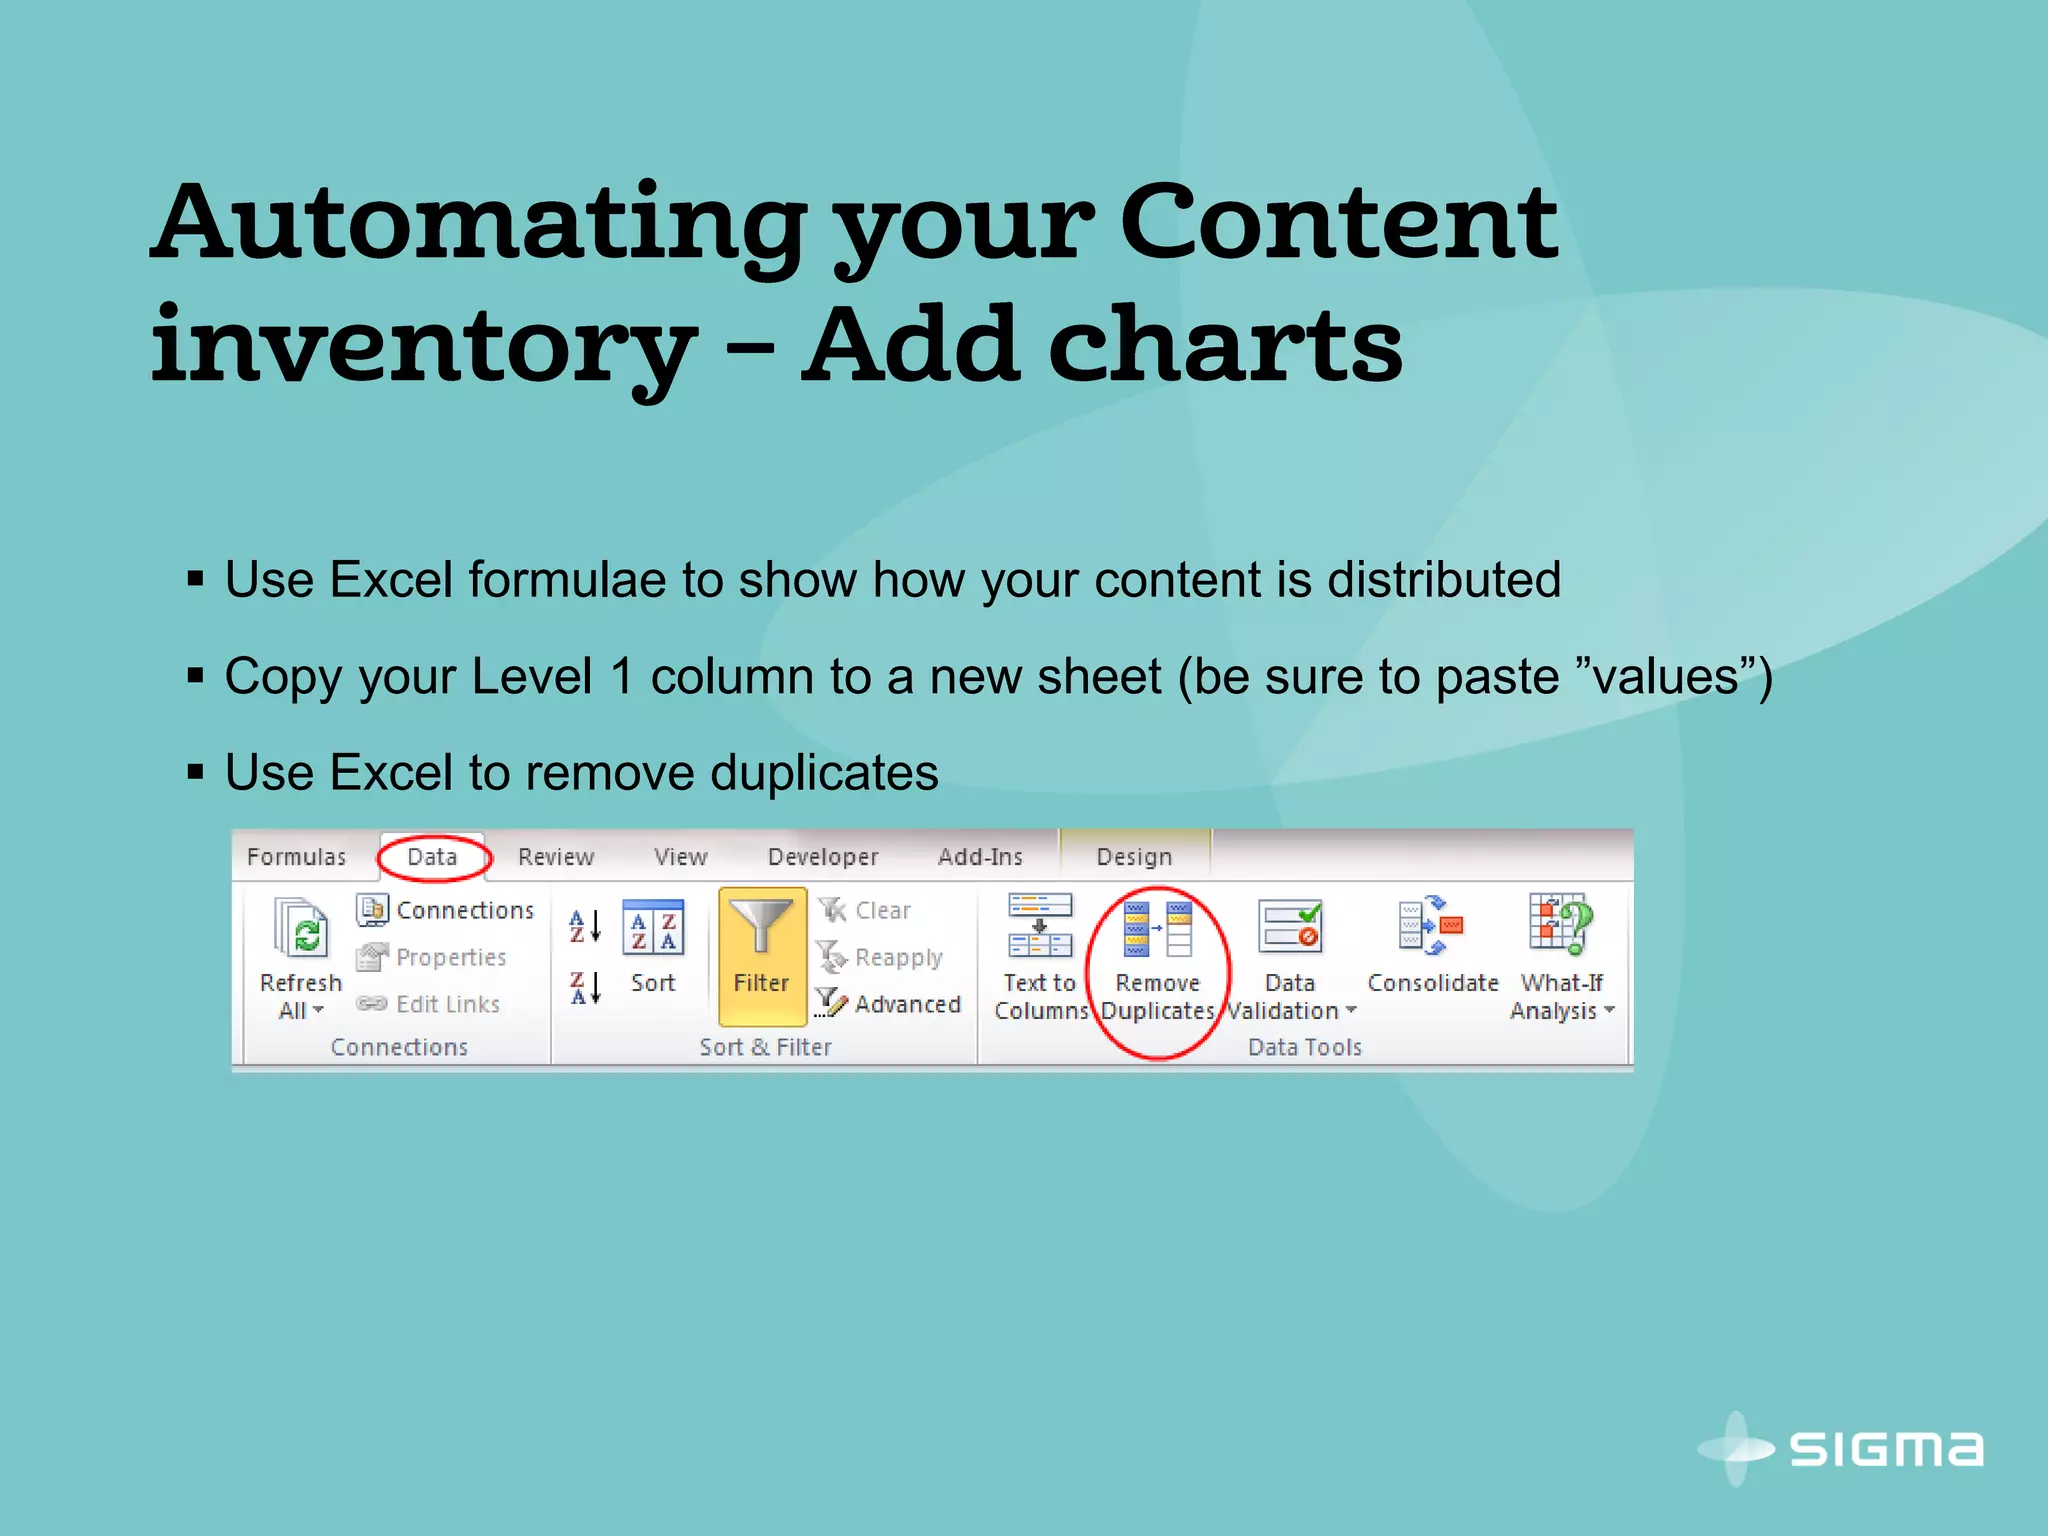
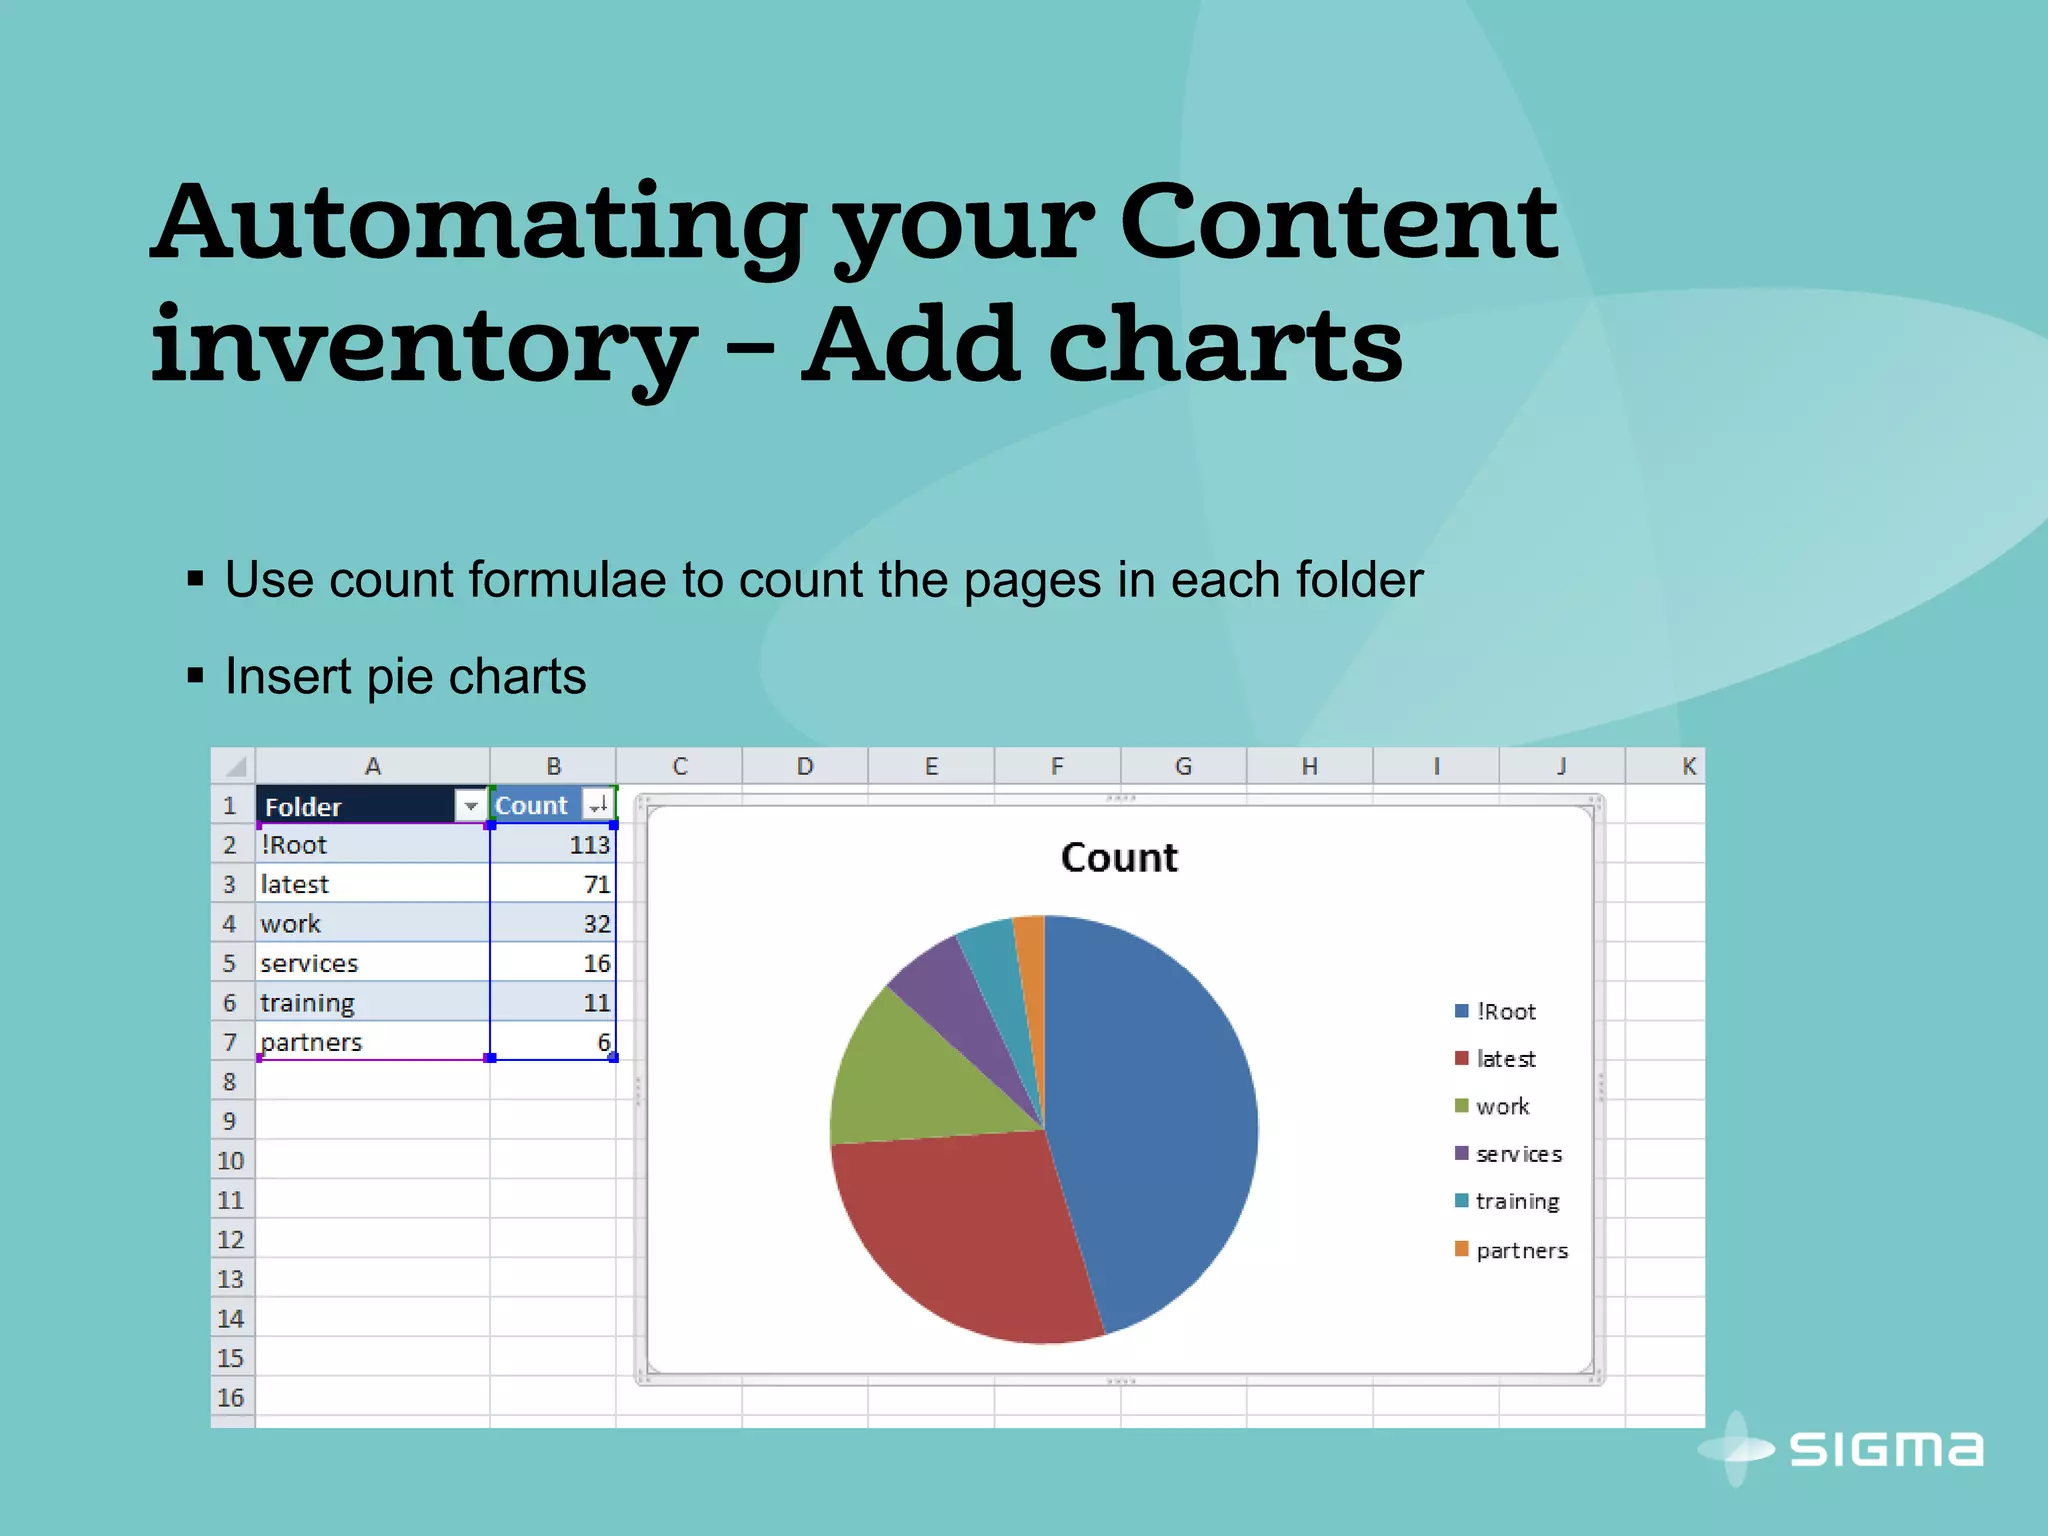
=COUNTIF(HTMLPages[Level 1],[@Folder]) Use this for pie charts showing how your content is distributed.
HTMLPages is the name of the table you insert on the HTML sheet of your
spreadsheet.
Level 1 is the level 1 column on the HTML sheet.
Folder is the first column on the sheet you are adding the chart to (see slide
17)](https://image.slidesharecdn.com/justindarleycontentaudittalkv2-140328062139-phpapp01/75/Sweeping-out-the-cobwebs-Content-auditing-for-large-websites-28-2048.jpg)

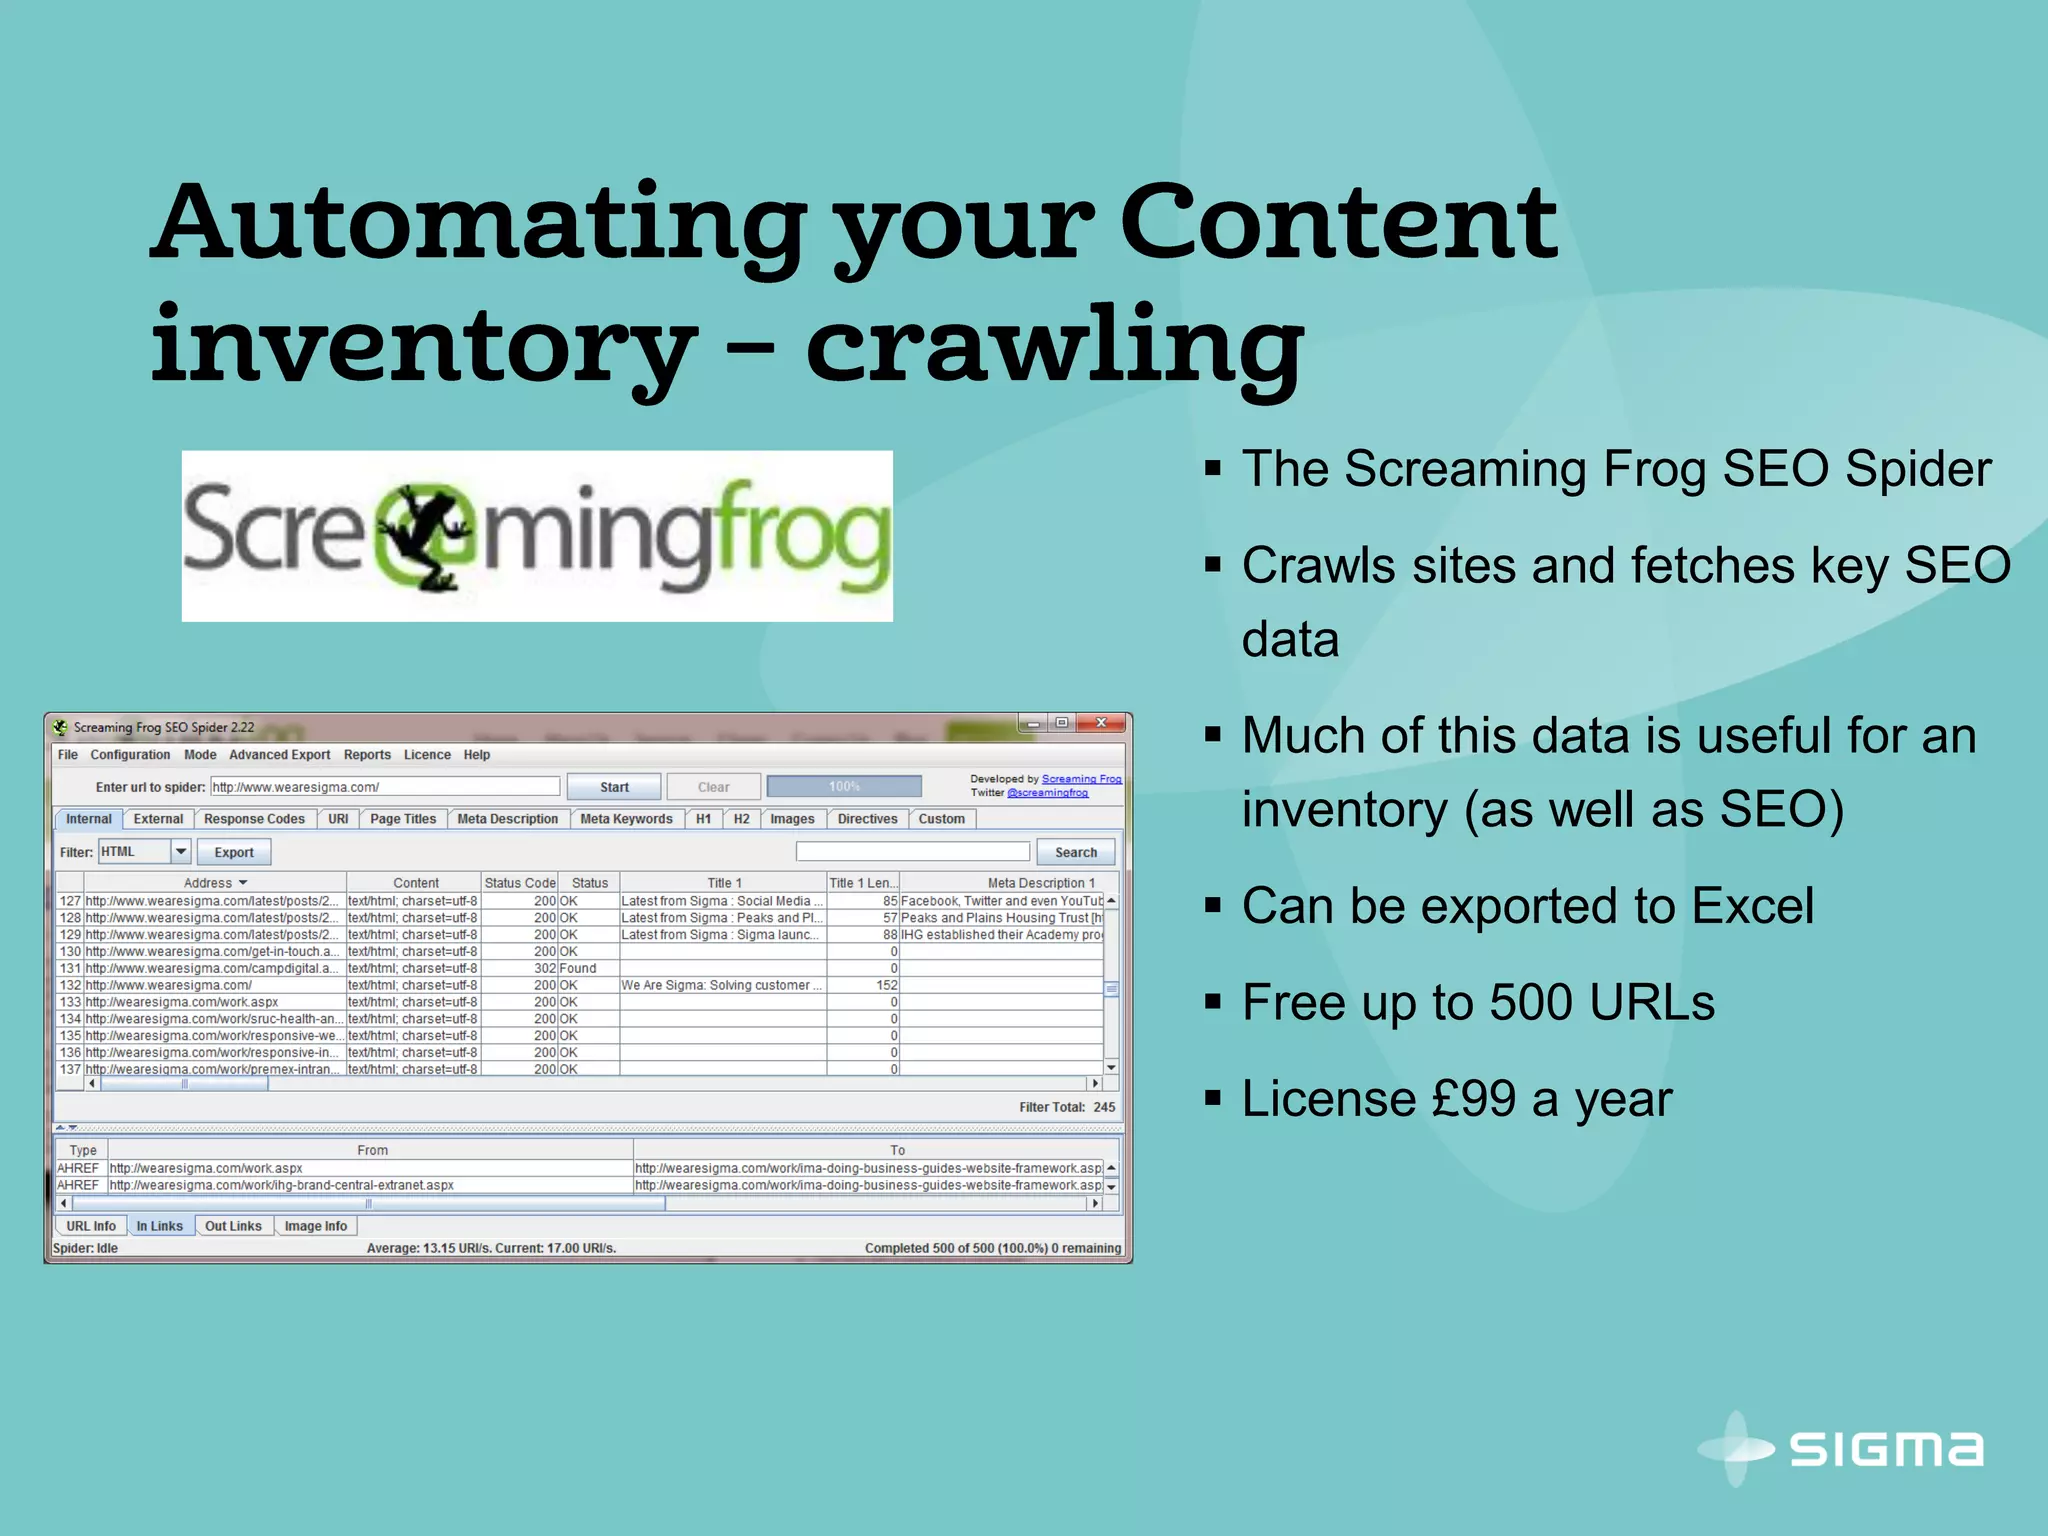
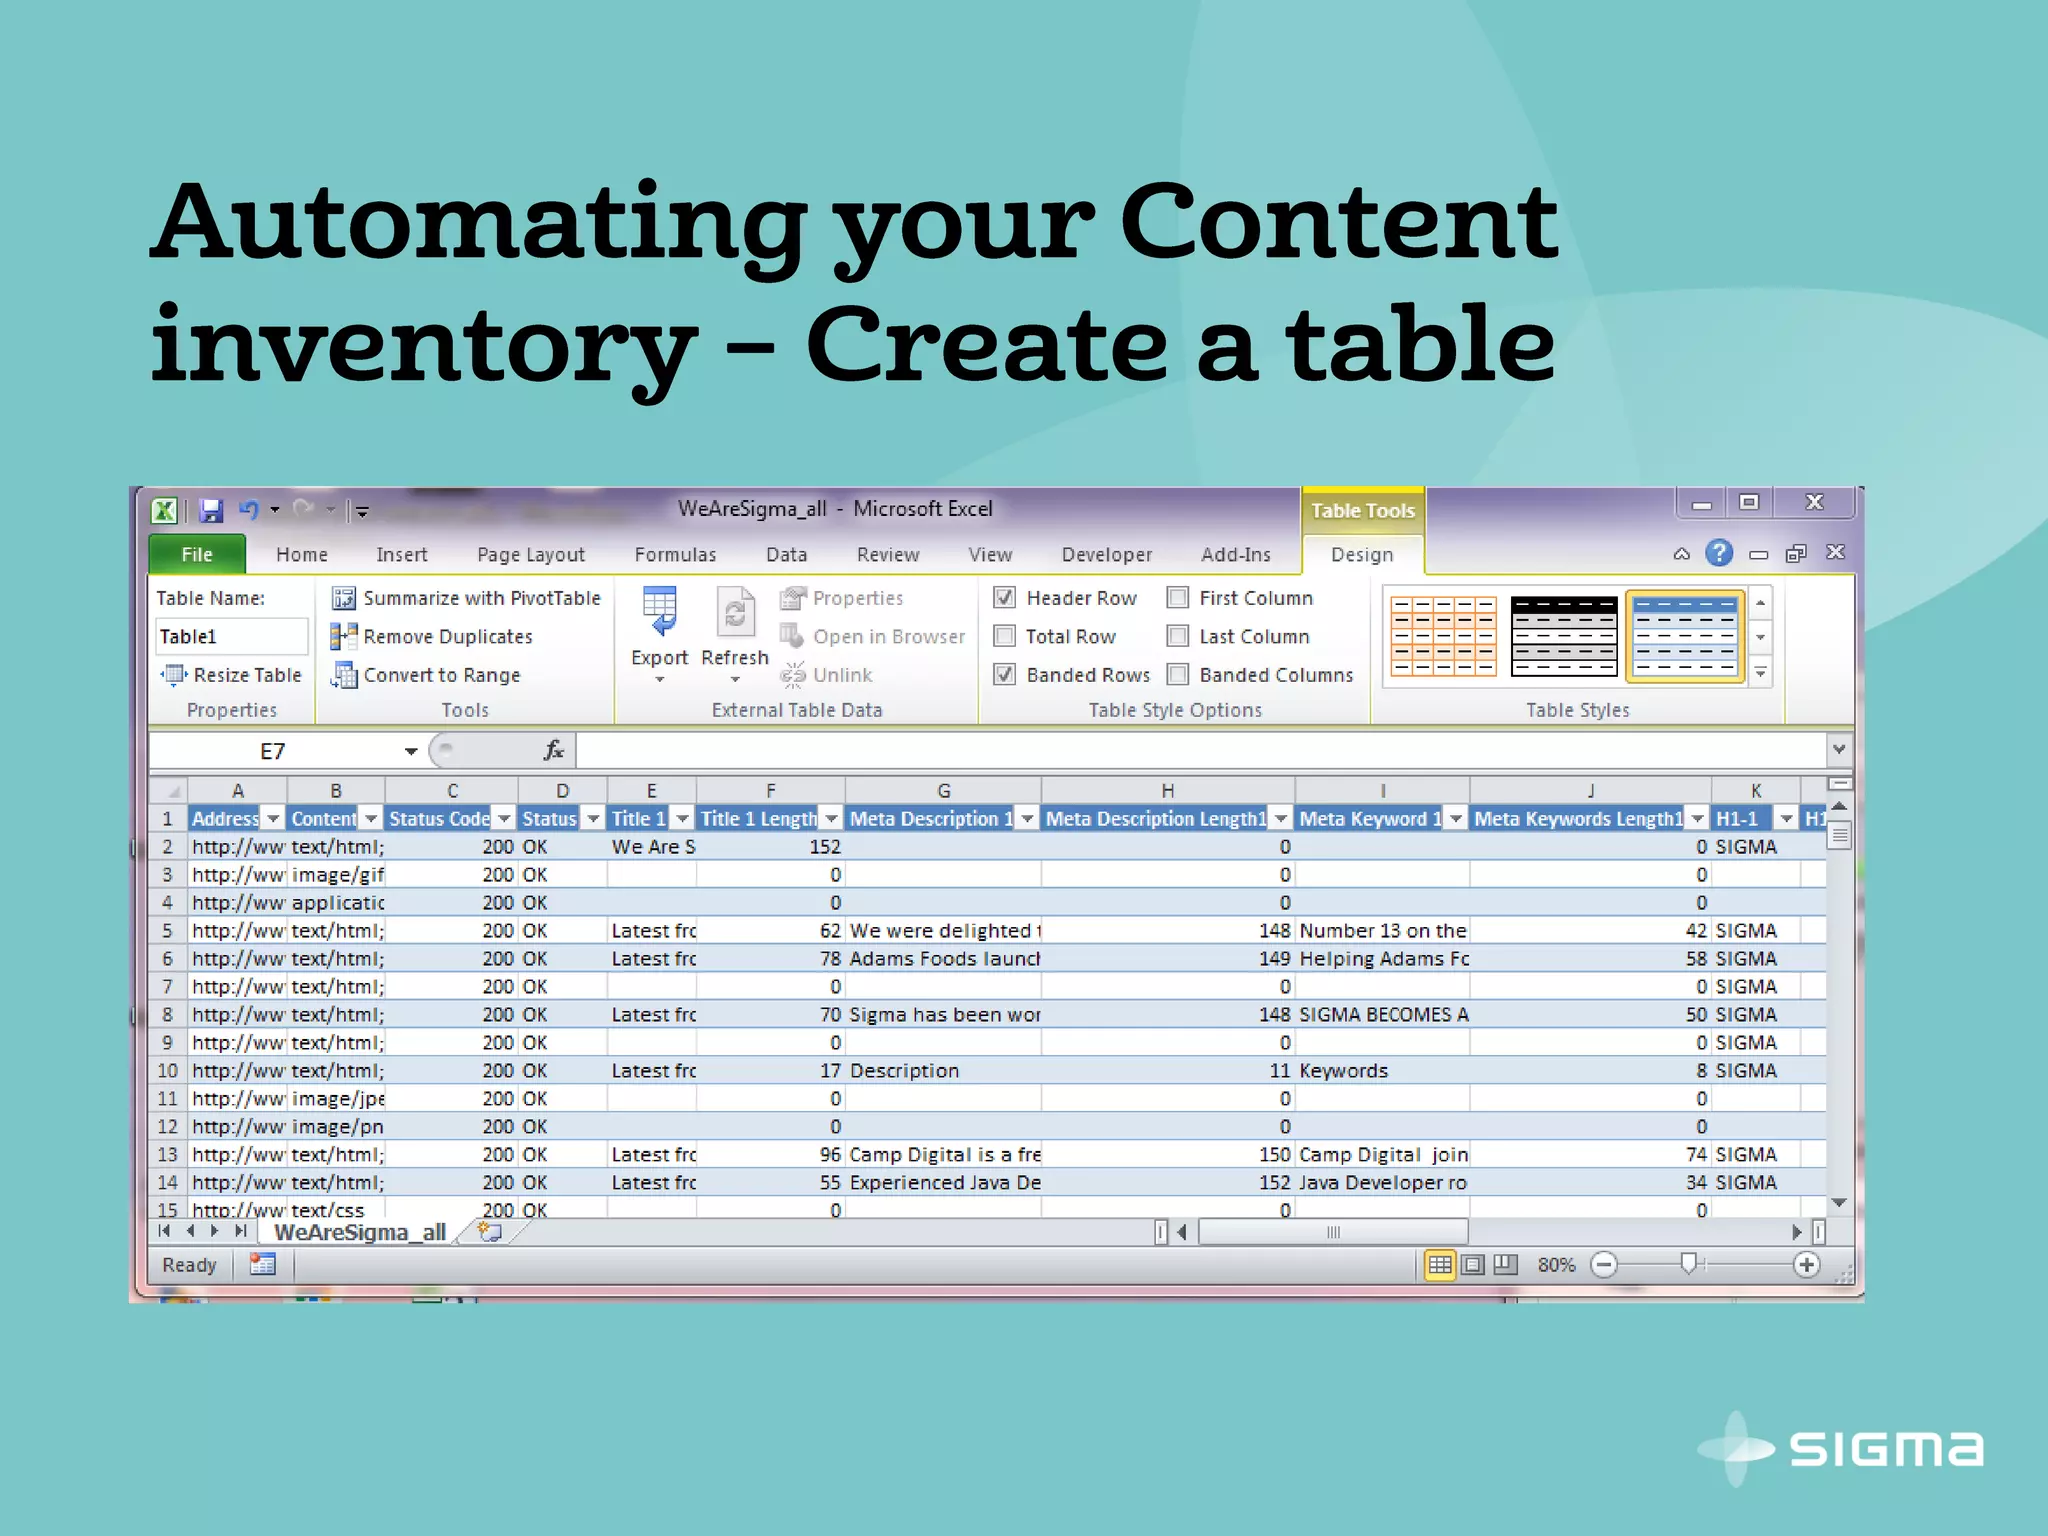
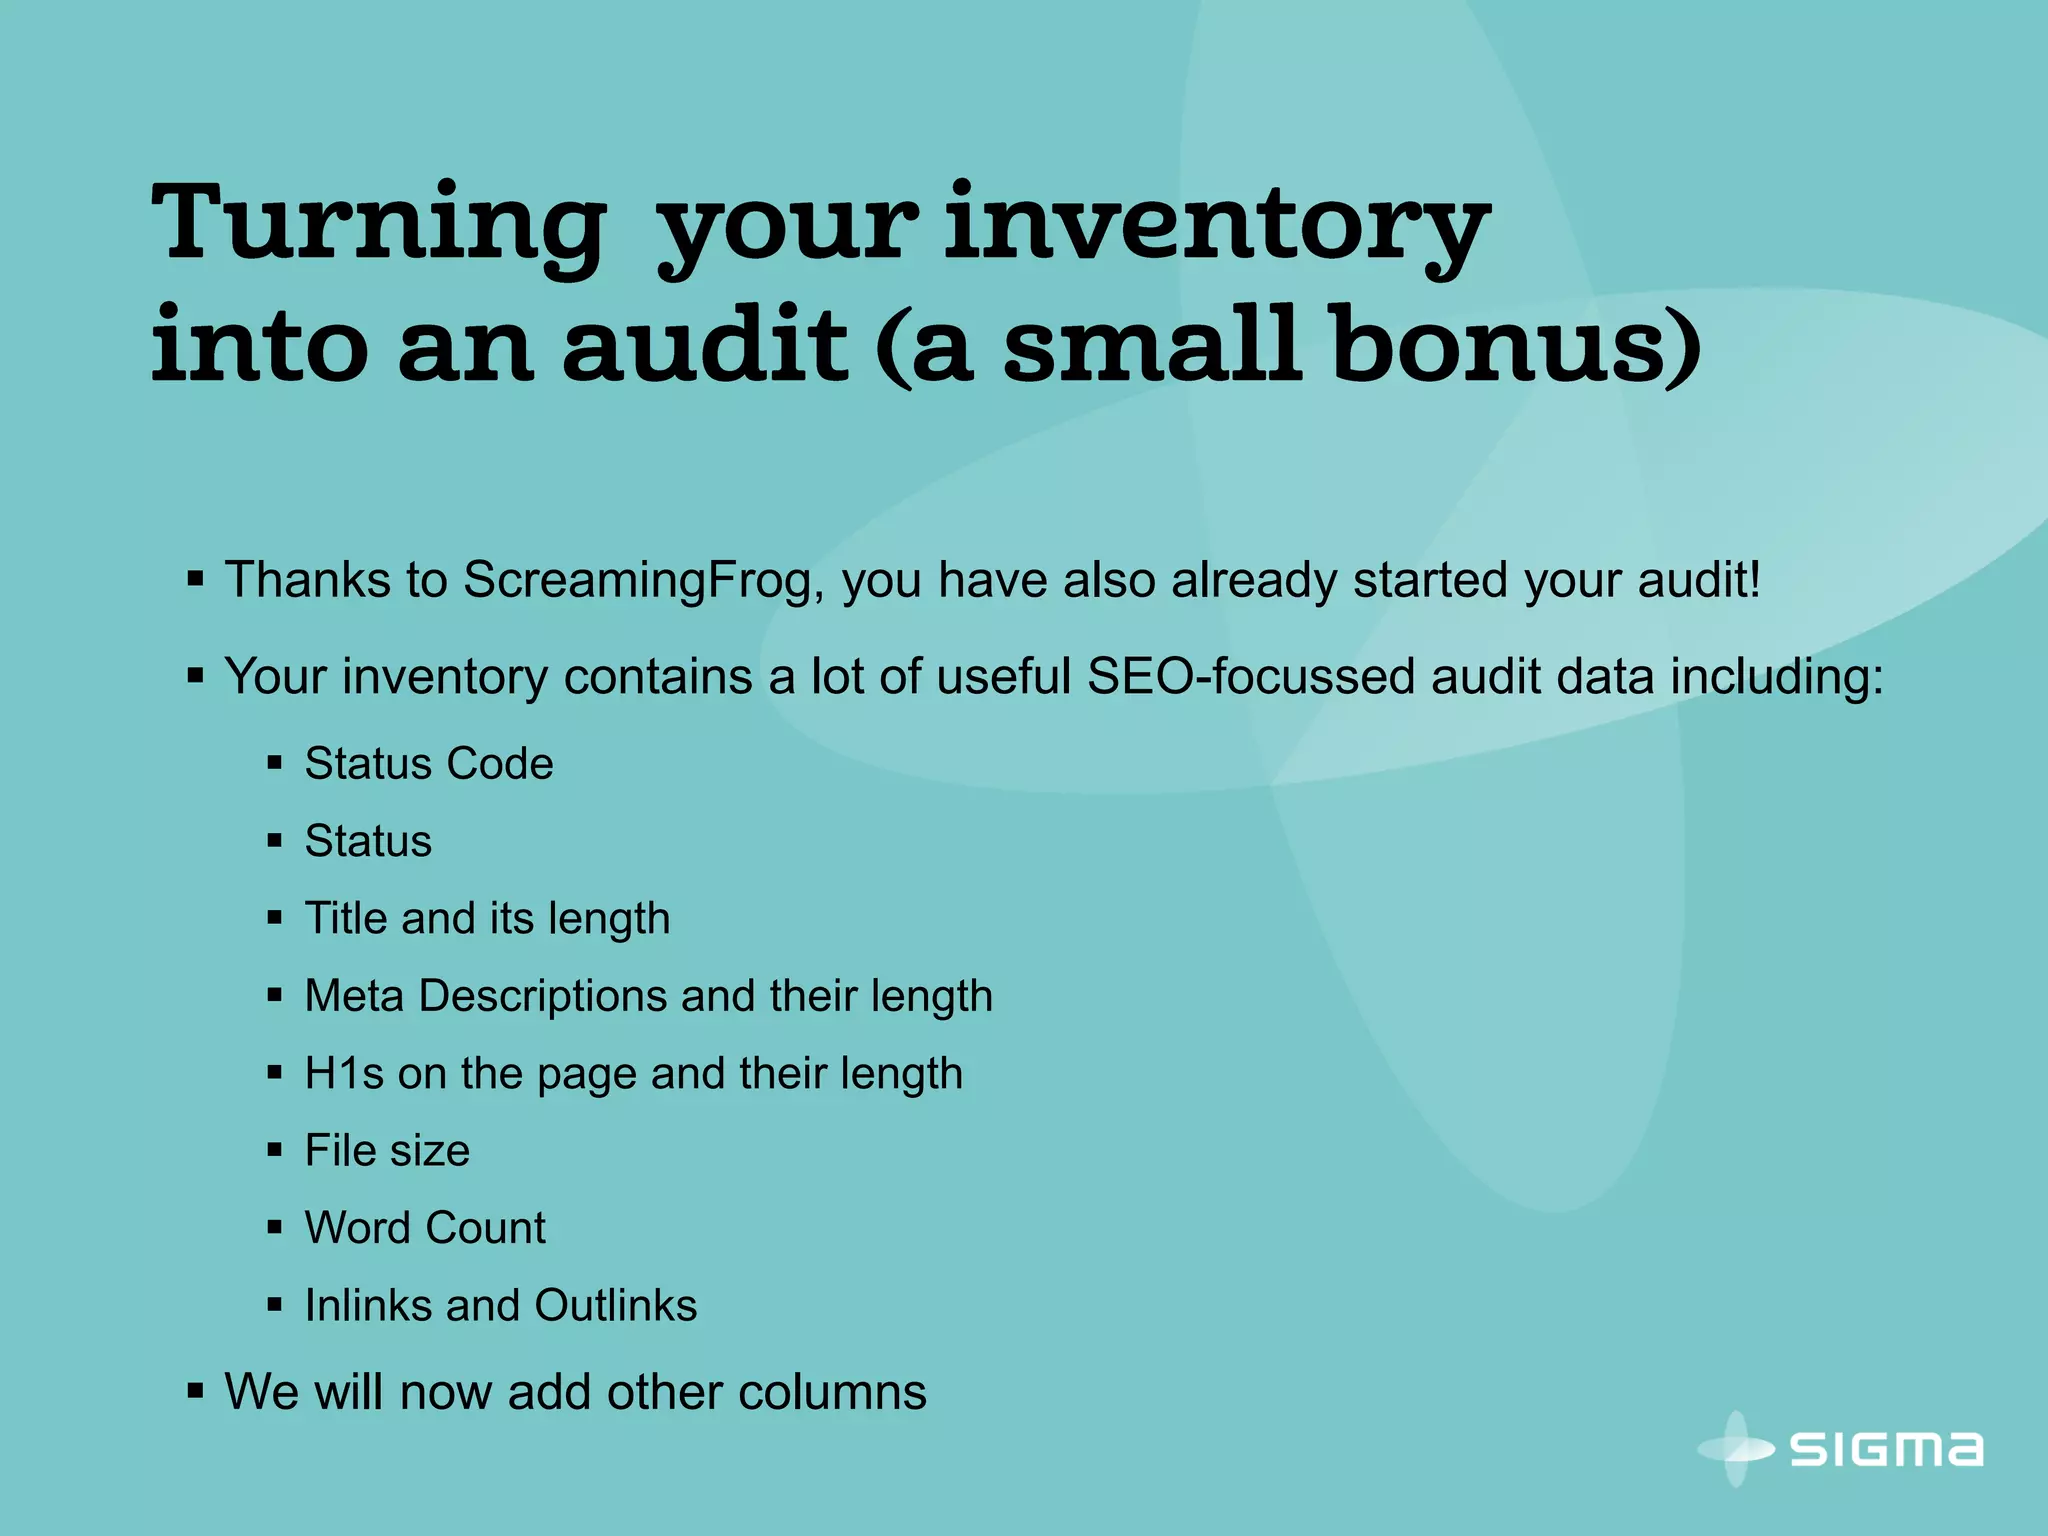
Justin, head of training and content services at Sigma, emphasizes the importance of maintaining web content through regular auditing and automation. He suggests using tools like the Screaming Frog SEO Spider for gathering SEO data and creating a content inventory in Excel. The document provides detailed guidelines for setting up and conducting an effective content audit to improve website quality and user experience.


![Website Audit [On Page and Off Page] by Carl Benedic Pantaleon](https://cdn.slidesharecdn.com/ss_thumbnails/websiteauditonpageandoffpage-181119200930-thumbnail.jpg?width=640&height=640&fit=bounds)


