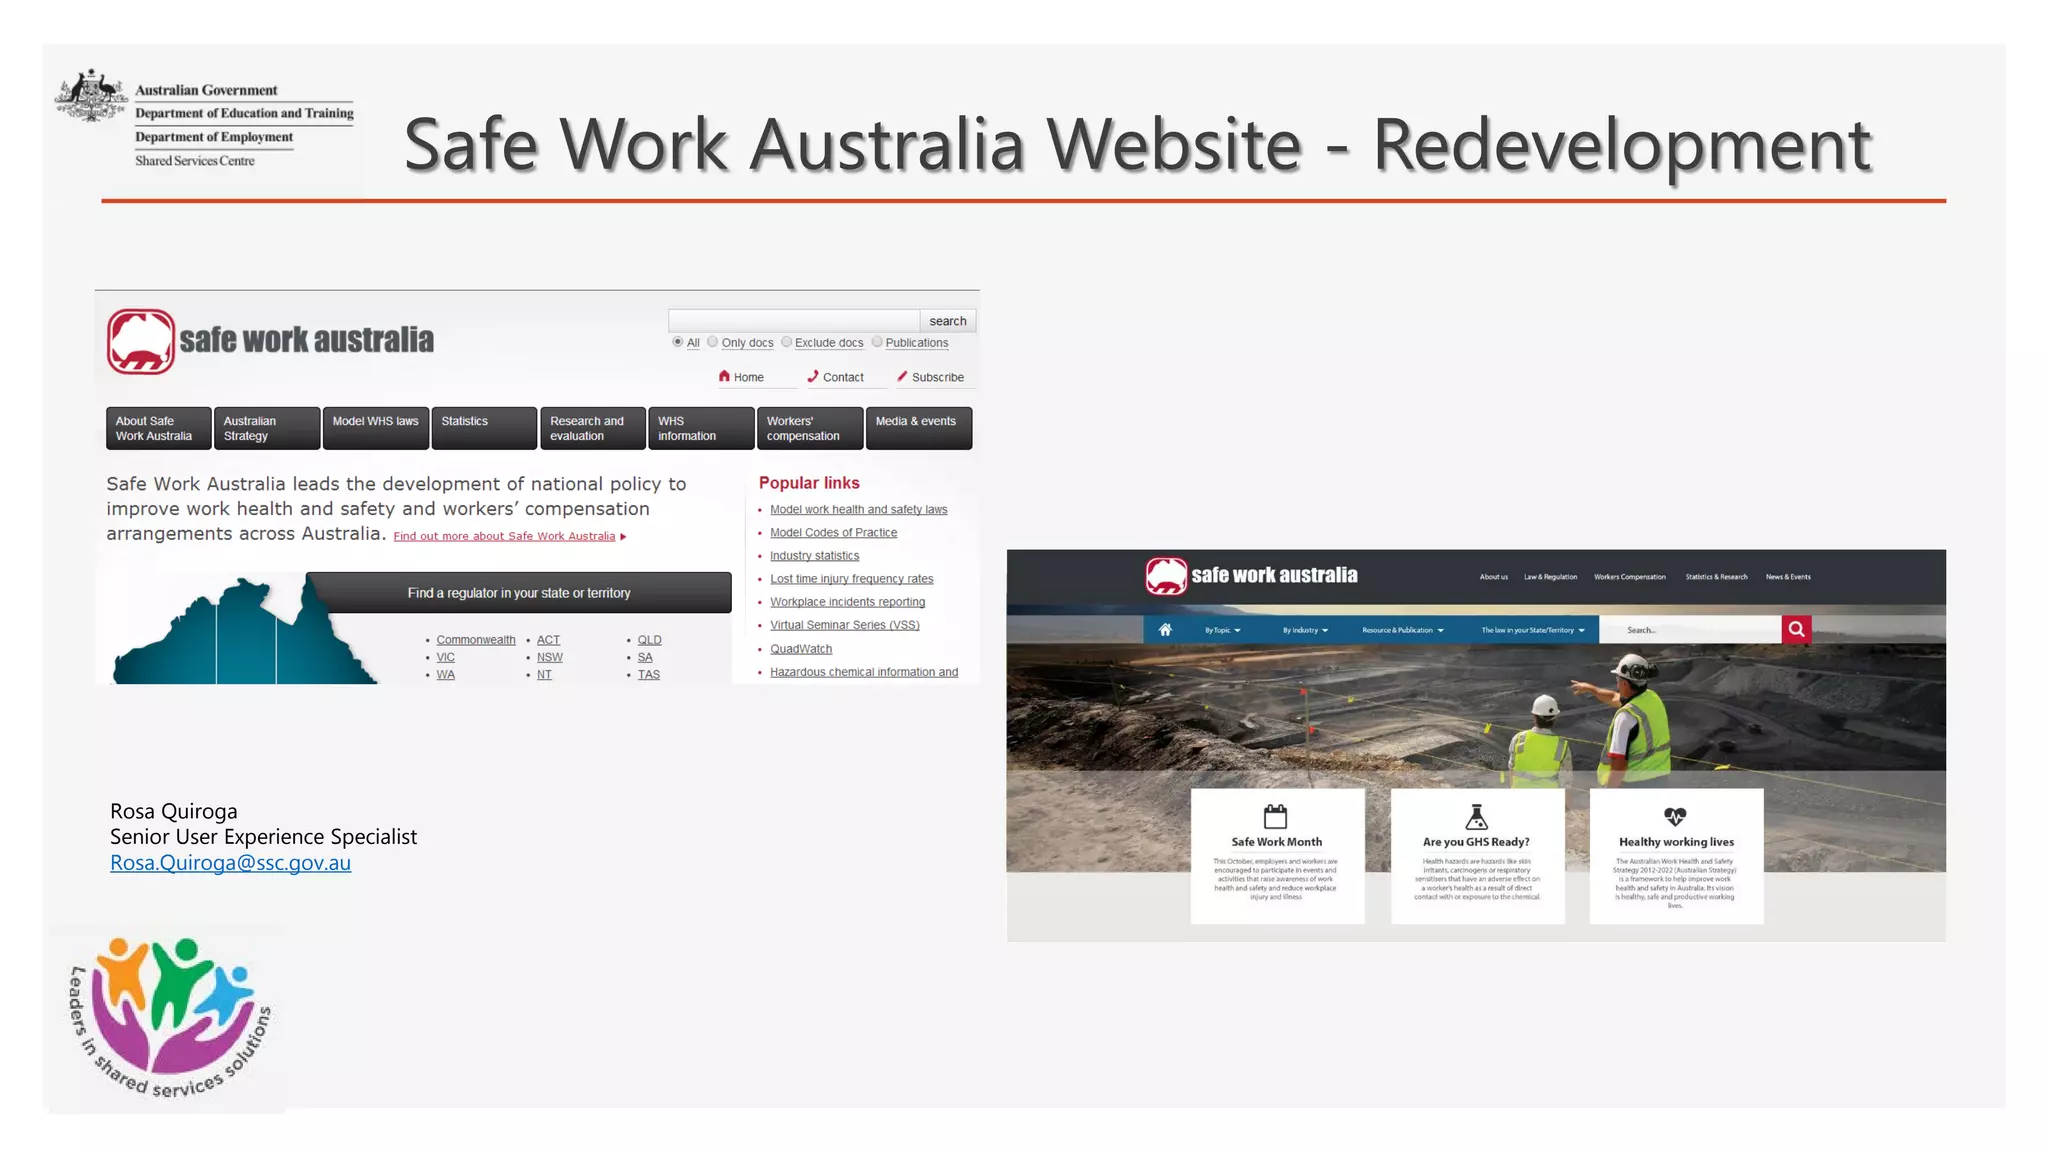
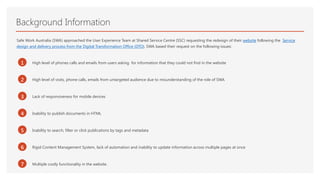
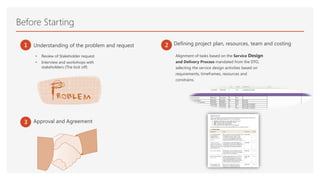
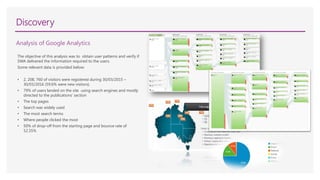
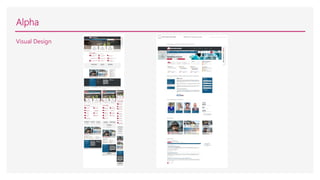
Safe Work Australia Website - Redevelopment
Rosa Quiroga
Senior User Experience Specialist
Rosa.Quiroga@ssc.gov.au
1
2
3
High level of phones calls and emails from users asking for information that they could not find in the website
Safe Work Australia (SWA) approached the User Experience Team at Shared Service Centre (SSC) requesting the redesign of their website following the Service
design and delivery process from the Digital Transformation Office (DTO). SWA based their request on the following issues:
Background Information
High level of visits, phone calls, emails from untargeted audience due to misunderstanding of the role of SWA
Lack of responsiveness for mobile devices
4 Inability to publish documents in HTML
5 Inability to search, filter or click publications by tags and metadata
6 Rigid Content Management System, lack of automation and inability to update information across multiple pages at once
7 Multiple costly functionality in the website.
Defining project plan, resources, team and costing1 2
3
Alignment of tasks based on the Service Design
and Delivery Process mandated from the DTO,
selecting the service design activities based on
requirements, timeframes, resources and
constrains.
Approval and Agreement
Understanding of the problem and request
Before Starting
• Review of Stakeholder request
• Interview and workshops with
stakeholders (The kick off)
The objective of this analysis was to obtain user patterns and verify if
SWA delivered the information required to the users.
Some relevant data is provided below:
• 2, 208, 760 of visitors were registered during 30/03/2015 –
30/03/2016 (59.6% were new visitors).
• 79% of users landed on the site using search engines and mostly
directed to the publications’ section
• The top pages
• Search was widely used
• The most search terms
• Where people clicked the most
• 50% of drop-off from the starting page and bounce rate of
52.35%
Discovery
Analysis of Google Analytics
Discovery
Comparative Analysis
1 The Goal: Identify the performance, information structure, content and
functionality of related government and non-government websites to
inform the redesign as well as better understand areas of competitive
advantage.
The Criteria:
• Presentation & Content
• Search
• Information Architecture (IA) and Navigation
• Performance
• Features & Functionality
• Accessibility
• Task ease
Rating scale of poor, average, good or excellent
2 The websites assessed:
• Comcare (Commonwealth regulator of work health and safety)
• Health and Safety Executive (U.K Government Health and Safety Department)
• Work Safe Victoria
• United States Department of Labor (Occupational Safety & Health
Administration).
3
Comparative Rating Matrix:
Identified Areas of Improvement
• Responsiveness and/or Adaptability
• IA and Navigation
• Content
• Interactive Tools (optional)
Discovery
Analysis of User Enquiries
Different business areas provided the main enquires received from the public via email, phone calls and online enquiries forms:
• Main enquires were about the latest WHS data, access to datasets, data not published in publications, lost time injury frequency rates and
benchmarking enquires required for tendering process, user did not understand the calculation formula and how to compare the results against
their industry.
• The Data and Analysis section received 30 public enquiries per fortnight.
• Same amount of enquires related to chemicals and other topics.
• Enquiries intended for work health and safety regulators, indicating confusion about SWA role and responsibilities (In a six-month period, the
Agency referred 630 phone calls and 630 emails to the jurisdiction.
Discovery
Refining of Stakeholder and user Goals based on previous research activities.
An Affinity Diagram activity was conducted in order to help to categorise business and user goals, issues and needs. This help to match business goals with user
goals
Business Goals
and
requirements
Google
Analytics
Customer
EnquiriesComparative
Analysis
Discovery
User Surveys
The testing was performed with participants that match the pre-defined user profiles. The task based scenarios
were done based on previous studies. The findings are listed below:
• Validation of older publication was questioned
• Related topics, data and information are not associated together
• Participants were unable to find high demanded topics through navigation
• Participants had difficulty to read through the content to find key information
• Search did not provided expected results
• Some participants found labelling unclear
• Model codes of practice and chemical safety information was easily found as well as regulatory information
• Participants value the quality of the publication material
• Most of the participants used Google to find information
• Participants did not read the summary description provided on search results
User Interviews and Usability Testing
This helped to collect user characteristics, role, tasks, what information and resources they look for, user satisfaction, issues that they have with the
current website. This was used to further investigated the targeted audience and pre-defined the Personas.
Discovery
Usability Testing Results
Table 1: Scenario A
Task Task completion
without difficulty
Task completion with
difficulty
Task not completed
1.1 100% - -
1.2 - 33% 67%
2 67% - 33%
3.1 33% 67% -
3.2 33% - 67%
3.3 - - 100%
3.4 67% - 33%
Table 3: Scenario C
Task Task completion
without difficulty
Task completion with
difficulty
Task not completed
1.1 67% - 33%
1.2 67% 33% -
2.1 33.33% 33.33% 33.33%
2.2 33% - 67%
2.3 67% - 33%
3.1 33% - 67%
3.2 33% - 67%
Discovery
Personas, User journeys and User Stories:
Based on the statistics analysis, customer enquiries, survey and usability testing; the Personas were defined, providing ethnographic and
demographic characteristics, roles, behavior, pathways, task, issues needs, challenges:
• WHS Advisor/Policy
• Regulator
• Academic
• Occupational Hygienist
Affinity Diagram:
Affinity Diagram
workshops, categorising
issues, areas of
Improvements and help to
identify possible solutions
Alpha
Moving to Alpha:
• The Discovery Activities were completed and artefacts produced: User Needs and Services Maps.
• Criteria 1 (Understand User Needs and Criteria 2 (Have a multidisciplinary team) met the Digital service standard mandated in the Discovery
phase.
Based on the research artefacts and
previous Card Sorting online activity, a
draft IA was defined and test it online
(Treejack) with SWA’s users
The refined IA was constructed into the
prototype and progressively refined
during the prototype interaction.
.
Information Architecture
Concept Design (Iteration 1): we
created a concept design applying the
IA and design possible solutions based
on the discovery stage. The concept
design was incorporated in an
Interactive prototype, also applying
responsive mobile framework.
.
Concept Design (Iteration 1)
Testing of the prototype concept was
conducted with targeted audience.
This was used for testing the new
concept and for changes applied in the
IA.
Usability Testing of the
Prototype
Discovery Findings
Alpha
Key Findings from the Usability Testing
(Prototype Interaction 1):
• Fewer clicks compared to the current SWA website
• High Learnability Curve
• Participants who were experienced in the health and
safety sector were able to interpret the topics section.
• Some labelling were unclear and the placement of some
topics belonged to other categories.
• Small flaws in the interaction and navigation
Prototype Interaction 2:
From the usability testing success and failures further
refinements were applied to the prototype. (Prototype
Interaction 2 )
Key Findings from the Usability Testing
(Prototype Interaction 2):
The overall tasks success rate was 83%, which represent a
dramatic improvement in comparison with the current
website, which the success rate completing the tasks during
the Usability testing performed in the discovery stage was
around 40%.
In many areas the increase in the success rate of 30% to
50% and in some cases 70%
Prototype Interaction 3:
Final Information Architecture and prototype: based on the
last usability testing small changes were applied to the IA
as well to the Prototype (interaction 3), defining then the
Minimum Viable Product.
Usability testing
Alpha
Visual Design
Alpha
HTML/CSS:
Building the HTML/CSS responsive templates based on the selected visual design concept.
Beta…
We have finalised the Alpha stage and going through the DTO assessment and ready to move to the Beta stage, where the website will be
developed following the design solution, test it in Beta before go live.
1 The new design solve the main issues, provide creative and
innovative solutions
3 Stakeholder Satisfaction with the product and results
2 User Satisfaction and optimal user Experience
5
Create engagement and collaboration between stakeholders, customers, user experience
practitioners and developers
Benefits
4 Validate User Centred Design/Agile best practices
6 Knowledge sharing , learning opportunities and leadership opportunities
Questions?

SWA-Presentation2

  • 1.
    Safe Work AustraliaWebsite - Redevelopment Rosa Quiroga Senior User Experience Specialist Rosa.Quiroga@ssc.gov.au
  • 2.
    1 2 3 High level ofphones calls and emails from users asking for information that they could not find in the website Safe Work Australia (SWA) approached the User Experience Team at Shared Service Centre (SSC) requesting the redesign of their website following the Service design and delivery process from the Digital Transformation Office (DTO). SWA based their request on the following issues: Background Information High level of visits, phone calls, emails from untargeted audience due to misunderstanding of the role of SWA Lack of responsiveness for mobile devices 4 Inability to publish documents in HTML 5 Inability to search, filter or click publications by tags and metadata 6 Rigid Content Management System, lack of automation and inability to update information across multiple pages at once 7 Multiple costly functionality in the website.
  • 3.
    Defining project plan,resources, team and costing1 2 3 Alignment of tasks based on the Service Design and Delivery Process mandated from the DTO, selecting the service design activities based on requirements, timeframes, resources and constrains. Approval and Agreement Understanding of the problem and request Before Starting • Review of Stakeholder request • Interview and workshops with stakeholders (The kick off)
  • 4.
    The objective ofthis analysis was to obtain user patterns and verify if SWA delivered the information required to the users. Some relevant data is provided below: • 2, 208, 760 of visitors were registered during 30/03/2015 – 30/03/2016 (59.6% were new visitors). • 79% of users landed on the site using search engines and mostly directed to the publications’ section • The top pages • Search was widely used • The most search terms • Where people clicked the most • 50% of drop-off from the starting page and bounce rate of 52.35% Discovery Analysis of Google Analytics
  • 5.
    Discovery Comparative Analysis 1 TheGoal: Identify the performance, information structure, content and functionality of related government and non-government websites to inform the redesign as well as better understand areas of competitive advantage. The Criteria: • Presentation & Content • Search • Information Architecture (IA) and Navigation • Performance • Features & Functionality • Accessibility • Task ease Rating scale of poor, average, good or excellent 2 The websites assessed: • Comcare (Commonwealth regulator of work health and safety) • Health and Safety Executive (U.K Government Health and Safety Department) • Work Safe Victoria • United States Department of Labor (Occupational Safety & Health Administration). 3 Comparative Rating Matrix: Identified Areas of Improvement • Responsiveness and/or Adaptability • IA and Navigation • Content • Interactive Tools (optional)
  • 6.
    Discovery Analysis of UserEnquiries Different business areas provided the main enquires received from the public via email, phone calls and online enquiries forms: • Main enquires were about the latest WHS data, access to datasets, data not published in publications, lost time injury frequency rates and benchmarking enquires required for tendering process, user did not understand the calculation formula and how to compare the results against their industry. • The Data and Analysis section received 30 public enquiries per fortnight. • Same amount of enquires related to chemicals and other topics. • Enquiries intended for work health and safety regulators, indicating confusion about SWA role and responsibilities (In a six-month period, the Agency referred 630 phone calls and 630 emails to the jurisdiction.
  • 7.
    Discovery Refining of Stakeholderand user Goals based on previous research activities. An Affinity Diagram activity was conducted in order to help to categorise business and user goals, issues and needs. This help to match business goals with user goals Business Goals and requirements Google Analytics Customer EnquiriesComparative Analysis
  • 8.
    Discovery User Surveys The testingwas performed with participants that match the pre-defined user profiles. The task based scenarios were done based on previous studies. The findings are listed below: • Validation of older publication was questioned • Related topics, data and information are not associated together • Participants were unable to find high demanded topics through navigation • Participants had difficulty to read through the content to find key information • Search did not provided expected results • Some participants found labelling unclear • Model codes of practice and chemical safety information was easily found as well as regulatory information • Participants value the quality of the publication material • Most of the participants used Google to find information • Participants did not read the summary description provided on search results User Interviews and Usability Testing This helped to collect user characteristics, role, tasks, what information and resources they look for, user satisfaction, issues that they have with the current website. This was used to further investigated the targeted audience and pre-defined the Personas.
  • 9.
    Discovery Usability Testing Results Table1: Scenario A Task Task completion without difficulty Task completion with difficulty Task not completed 1.1 100% - - 1.2 - 33% 67% 2 67% - 33% 3.1 33% 67% - 3.2 33% - 67% 3.3 - - 100% 3.4 67% - 33% Table 3: Scenario C Task Task completion without difficulty Task completion with difficulty Task not completed 1.1 67% - 33% 1.2 67% 33% - 2.1 33.33% 33.33% 33.33% 2.2 33% - 67% 2.3 67% - 33% 3.1 33% - 67% 3.2 33% - 67%
  • 10.
    Discovery Personas, User journeysand User Stories: Based on the statistics analysis, customer enquiries, survey and usability testing; the Personas were defined, providing ethnographic and demographic characteristics, roles, behavior, pathways, task, issues needs, challenges: • WHS Advisor/Policy • Regulator • Academic • Occupational Hygienist Affinity Diagram: Affinity Diagram workshops, categorising issues, areas of Improvements and help to identify possible solutions
  • 11.
    Alpha Moving to Alpha: •The Discovery Activities were completed and artefacts produced: User Needs and Services Maps. • Criteria 1 (Understand User Needs and Criteria 2 (Have a multidisciplinary team) met the Digital service standard mandated in the Discovery phase. Based on the research artefacts and previous Card Sorting online activity, a draft IA was defined and test it online (Treejack) with SWA’s users The refined IA was constructed into the prototype and progressively refined during the prototype interaction. . Information Architecture Concept Design (Iteration 1): we created a concept design applying the IA and design possible solutions based on the discovery stage. The concept design was incorporated in an Interactive prototype, also applying responsive mobile framework. . Concept Design (Iteration 1) Testing of the prototype concept was conducted with targeted audience. This was used for testing the new concept and for changes applied in the IA. Usability Testing of the Prototype Discovery Findings
  • 12.
    Alpha Key Findings fromthe Usability Testing (Prototype Interaction 1): • Fewer clicks compared to the current SWA website • High Learnability Curve • Participants who were experienced in the health and safety sector were able to interpret the topics section. • Some labelling were unclear and the placement of some topics belonged to other categories. • Small flaws in the interaction and navigation Prototype Interaction 2: From the usability testing success and failures further refinements were applied to the prototype. (Prototype Interaction 2 ) Key Findings from the Usability Testing (Prototype Interaction 2): The overall tasks success rate was 83%, which represent a dramatic improvement in comparison with the current website, which the success rate completing the tasks during the Usability testing performed in the discovery stage was around 40%. In many areas the increase in the success rate of 30% to 50% and in some cases 70% Prototype Interaction 3: Final Information Architecture and prototype: based on the last usability testing small changes were applied to the IA as well to the Prototype (interaction 3), defining then the Minimum Viable Product. Usability testing
  • 13.
  • 14.
    Alpha HTML/CSS: Building the HTML/CSSresponsive templates based on the selected visual design concept. Beta… We have finalised the Alpha stage and going through the DTO assessment and ready to move to the Beta stage, where the website will be developed following the design solution, test it in Beta before go live.
  • 15.
    1 The newdesign solve the main issues, provide creative and innovative solutions 3 Stakeholder Satisfaction with the product and results 2 User Satisfaction and optimal user Experience 5 Create engagement and collaboration between stakeholders, customers, user experience practitioners and developers Benefits 4 Validate User Centred Design/Agile best practices 6 Knowledge sharing , learning opportunities and leadership opportunities
  • 16.