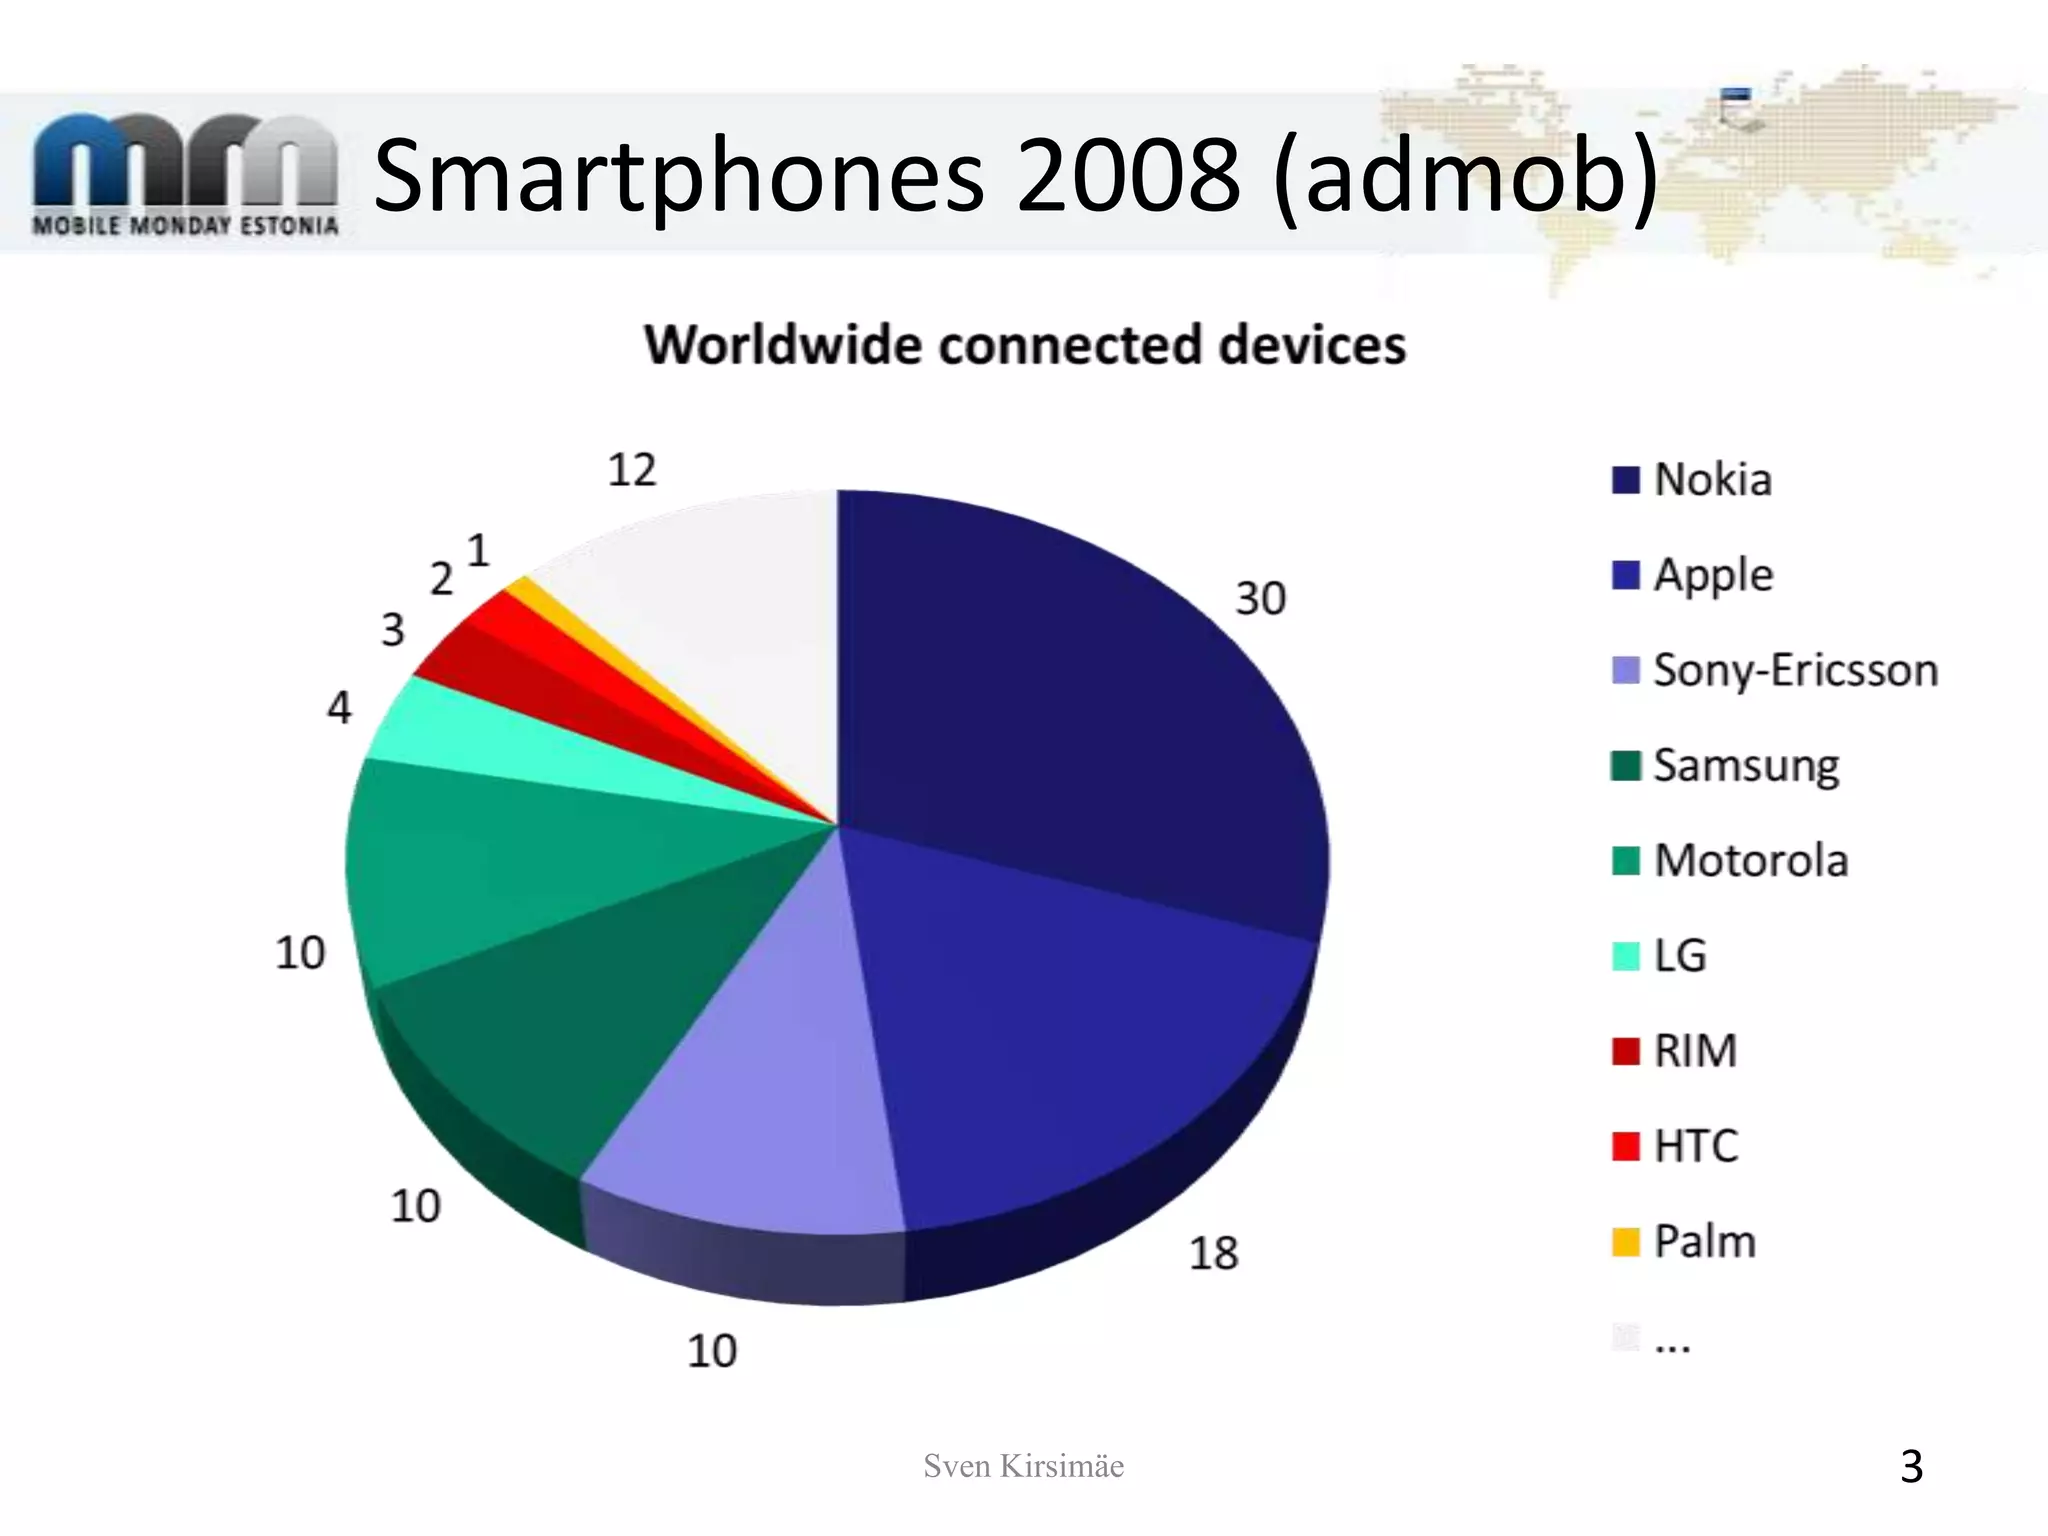
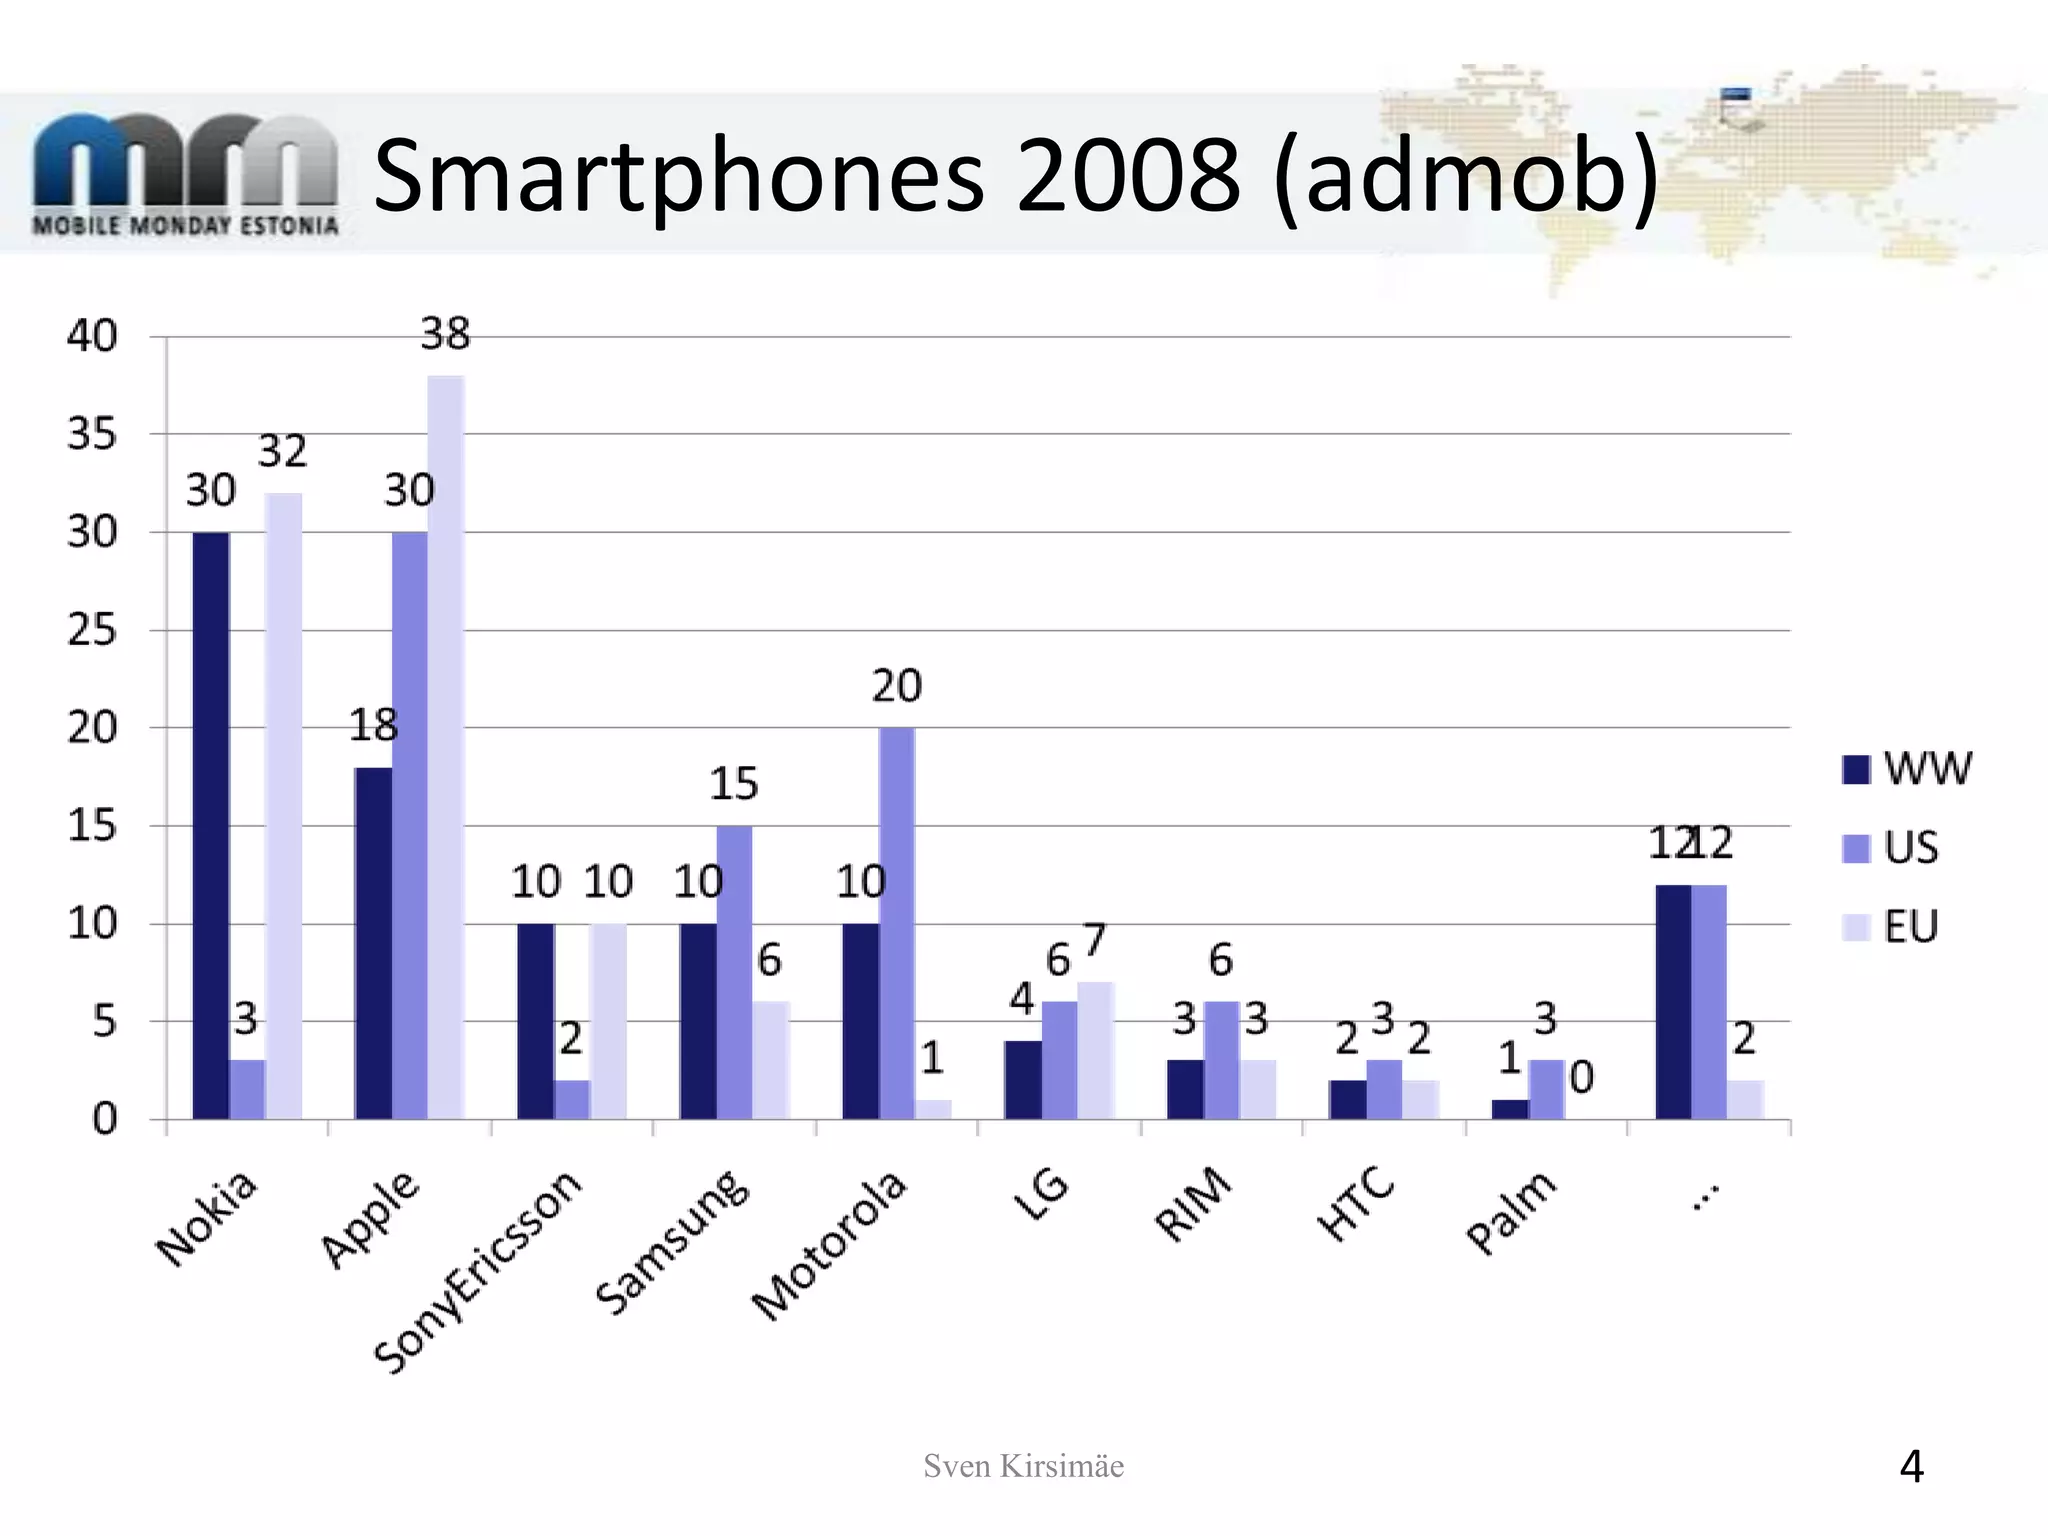
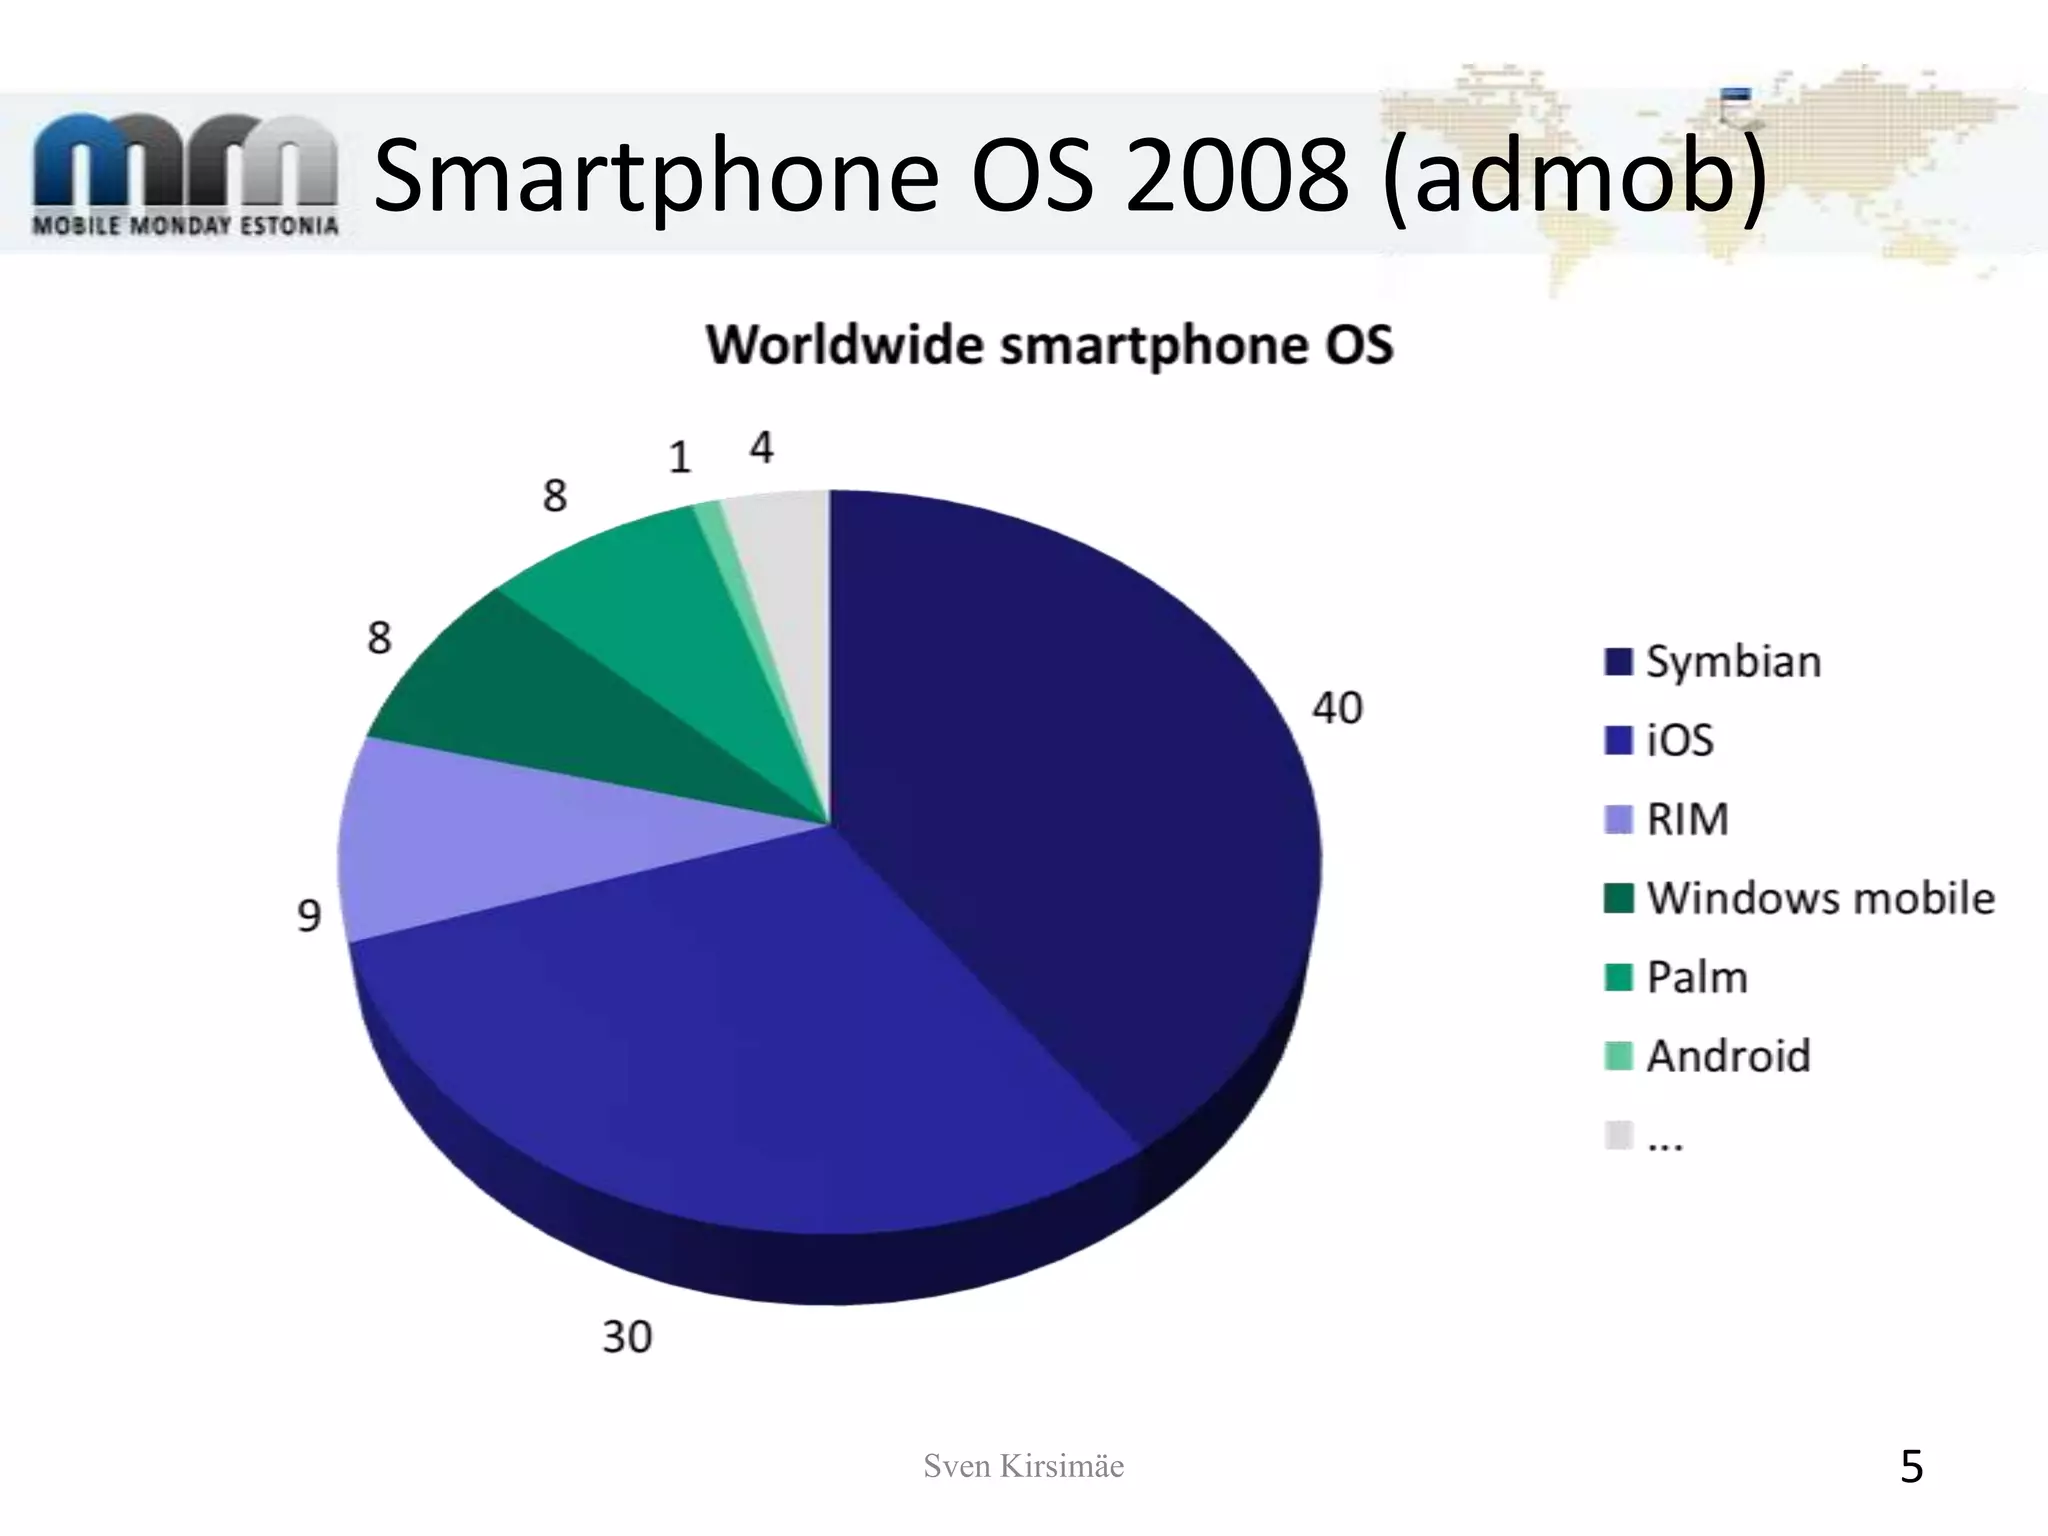
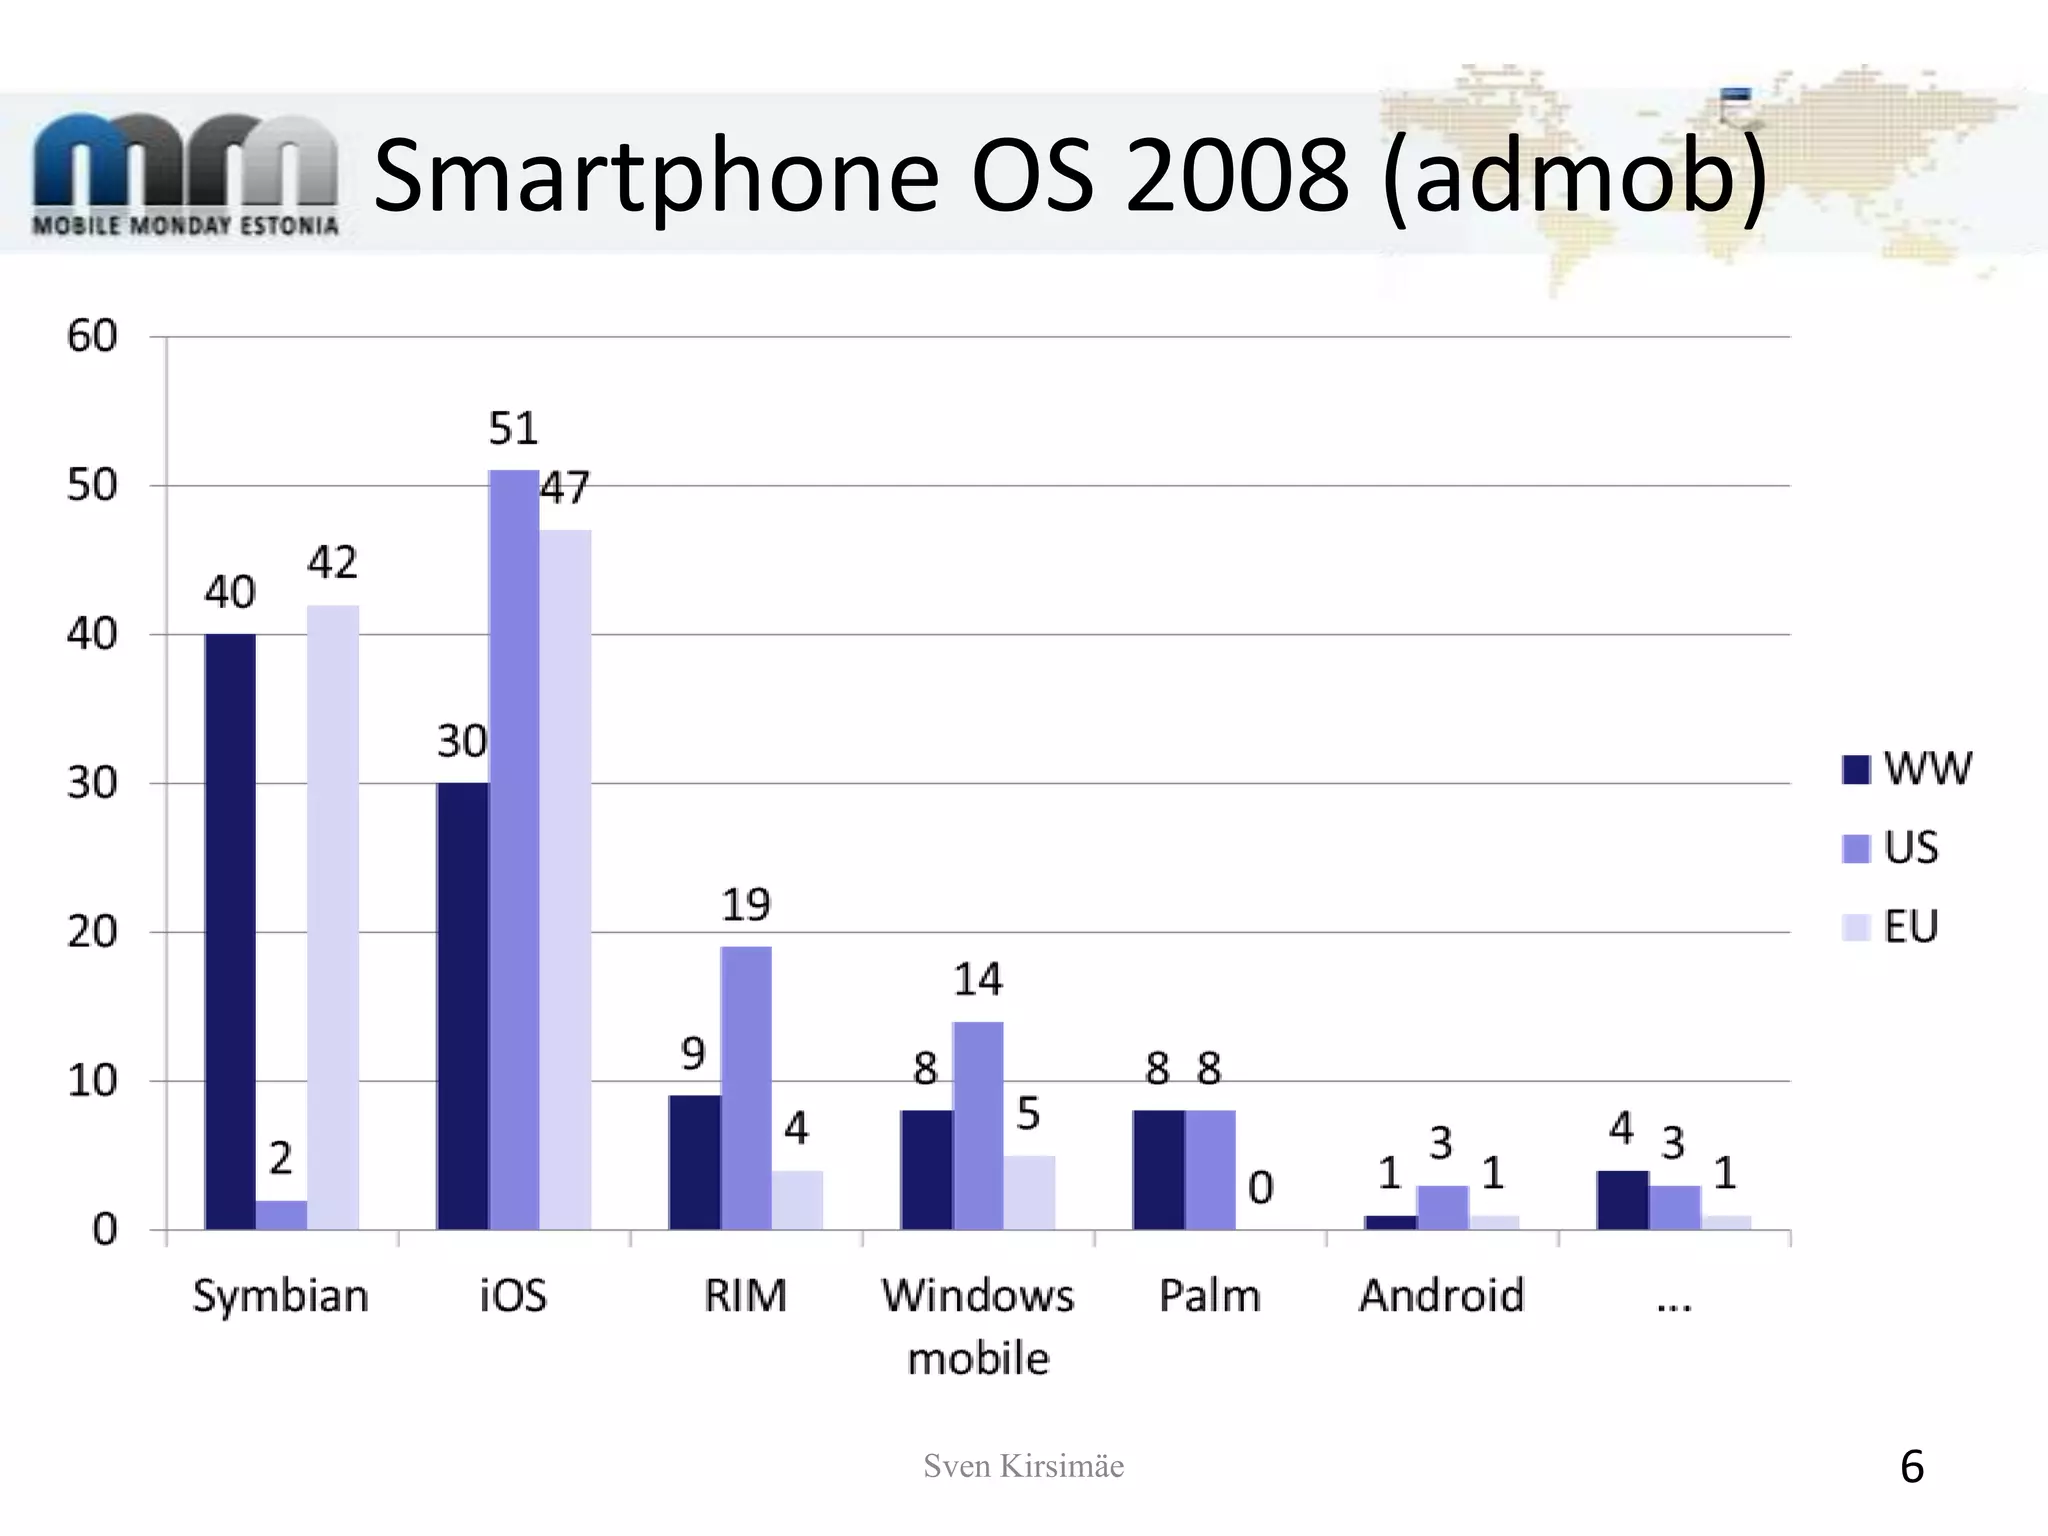
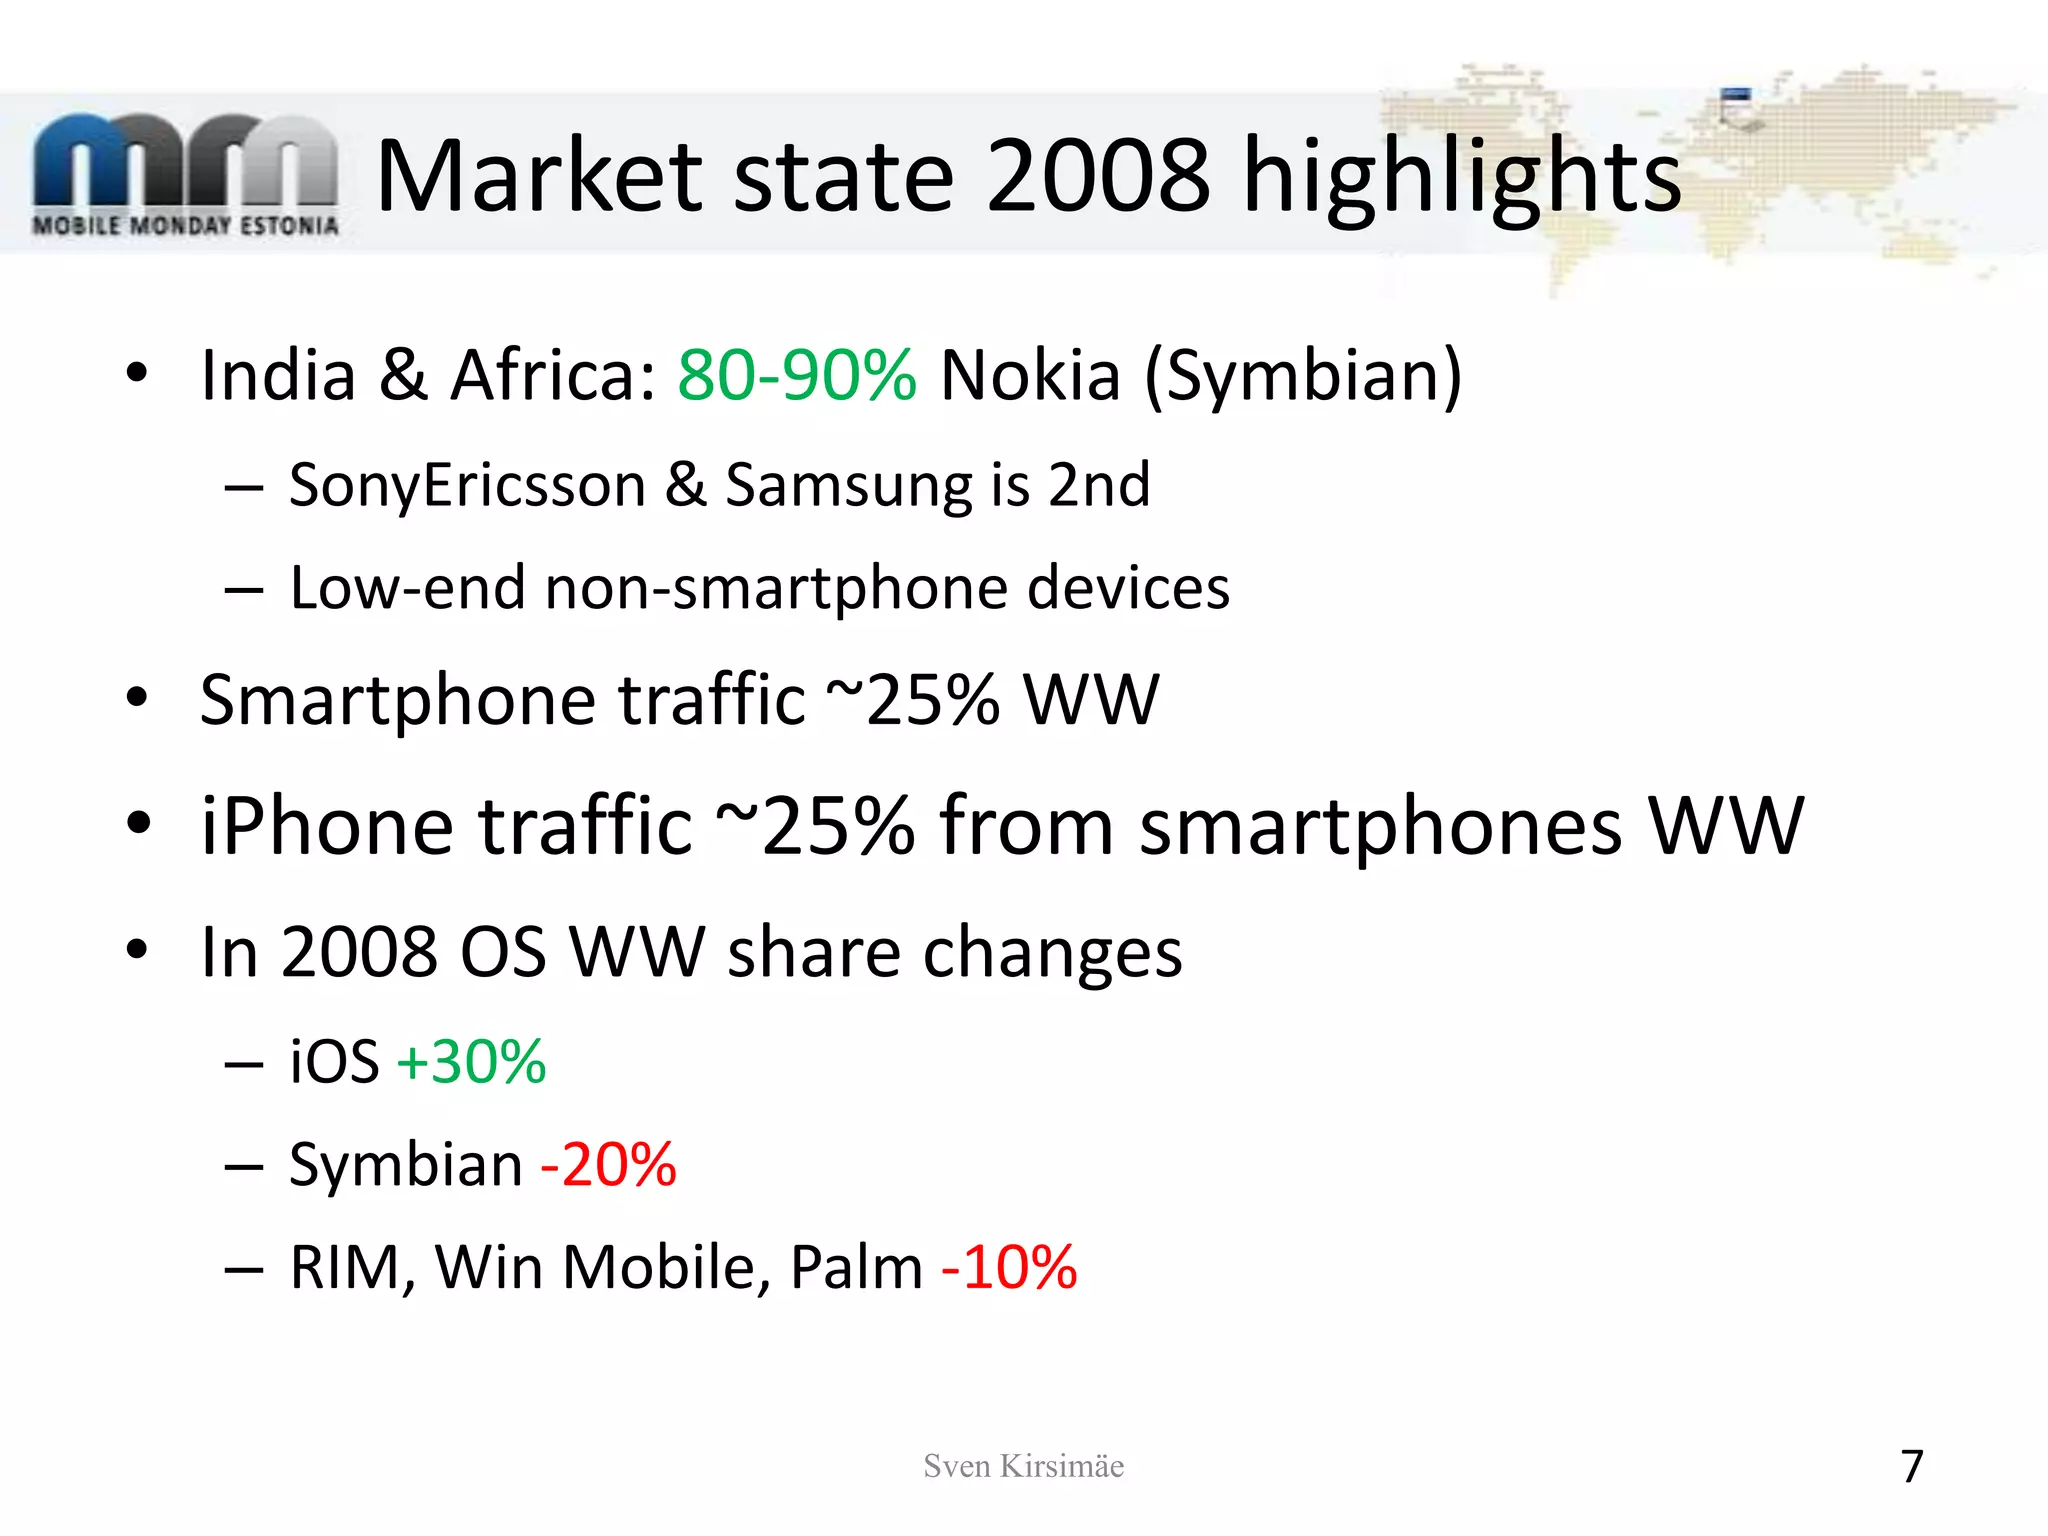
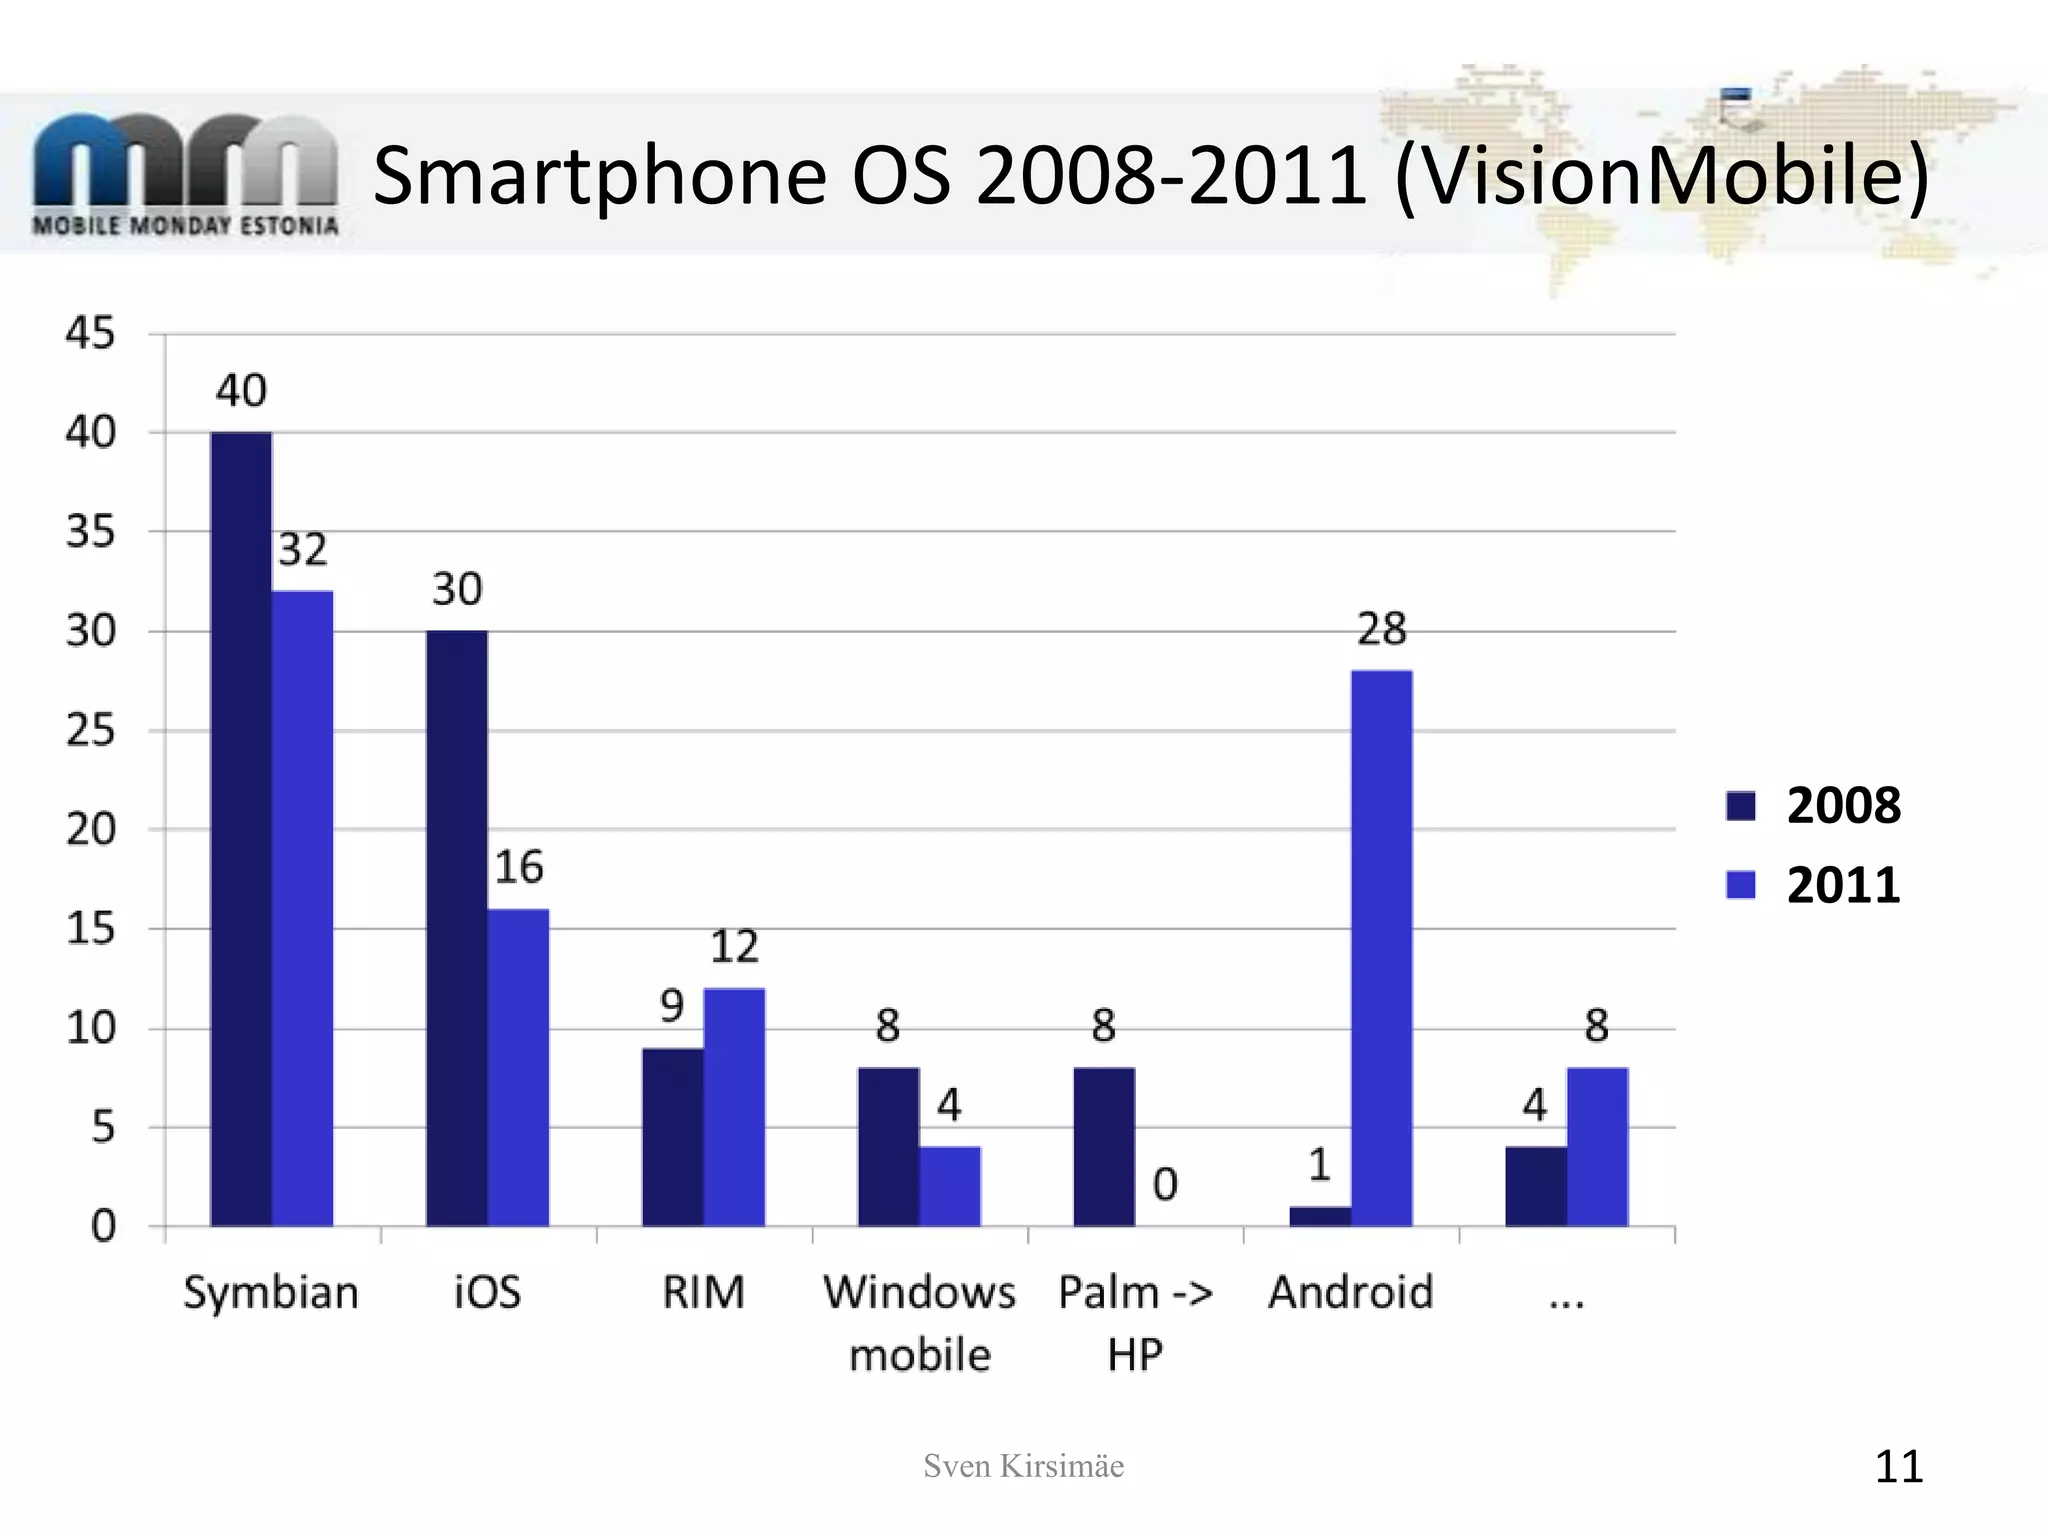
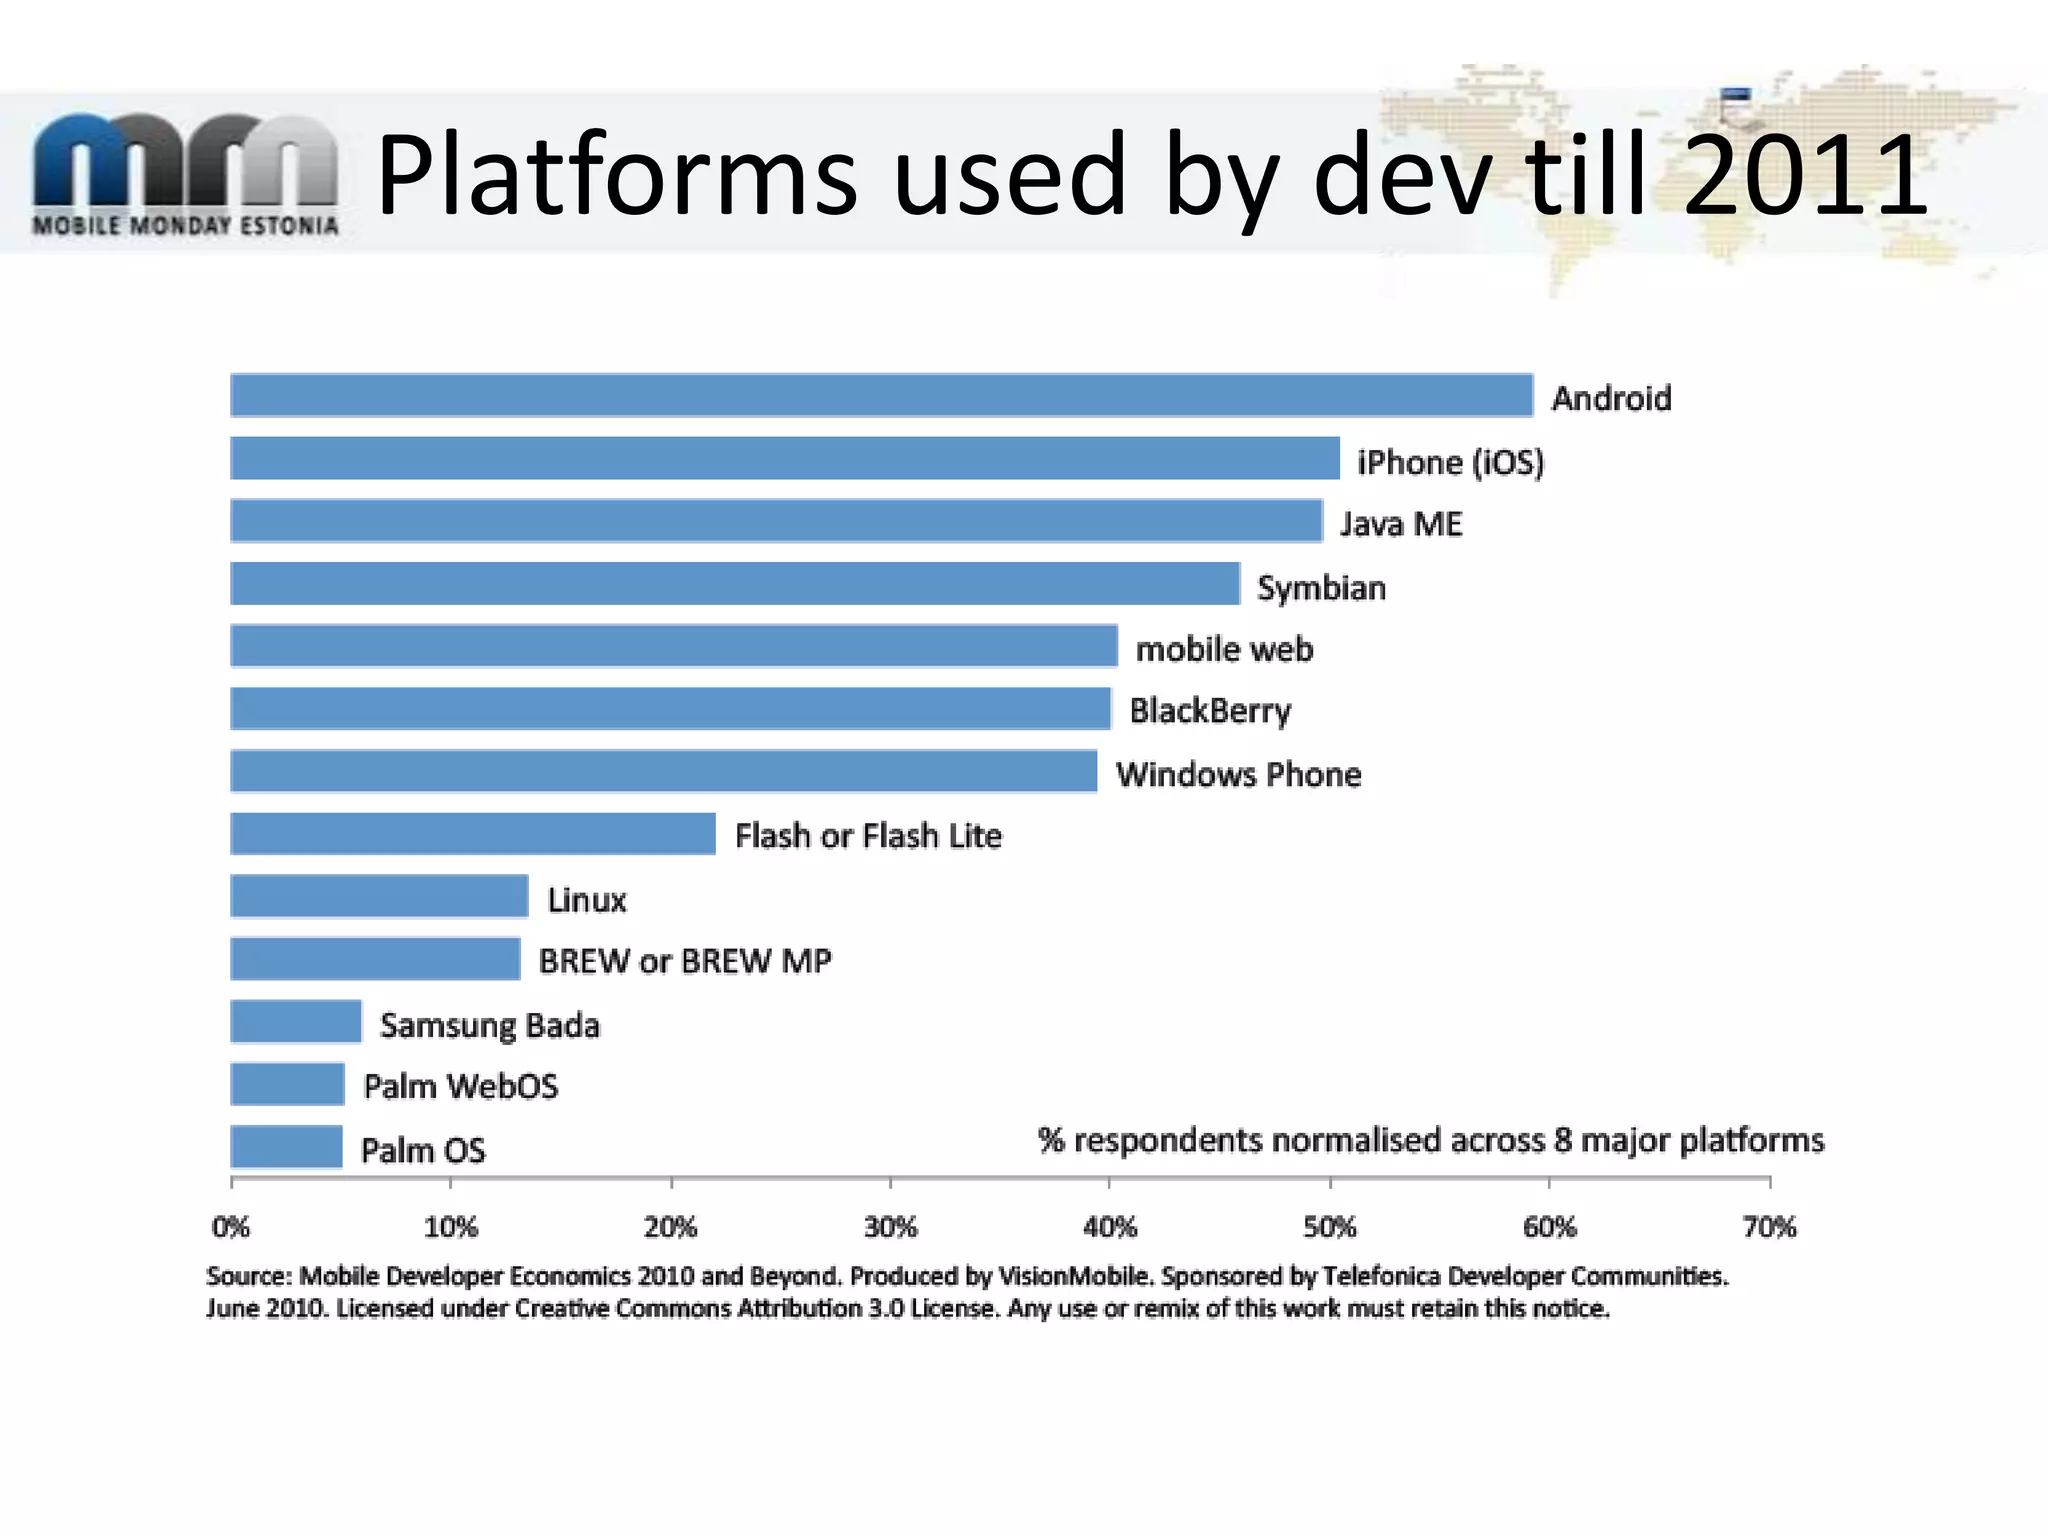
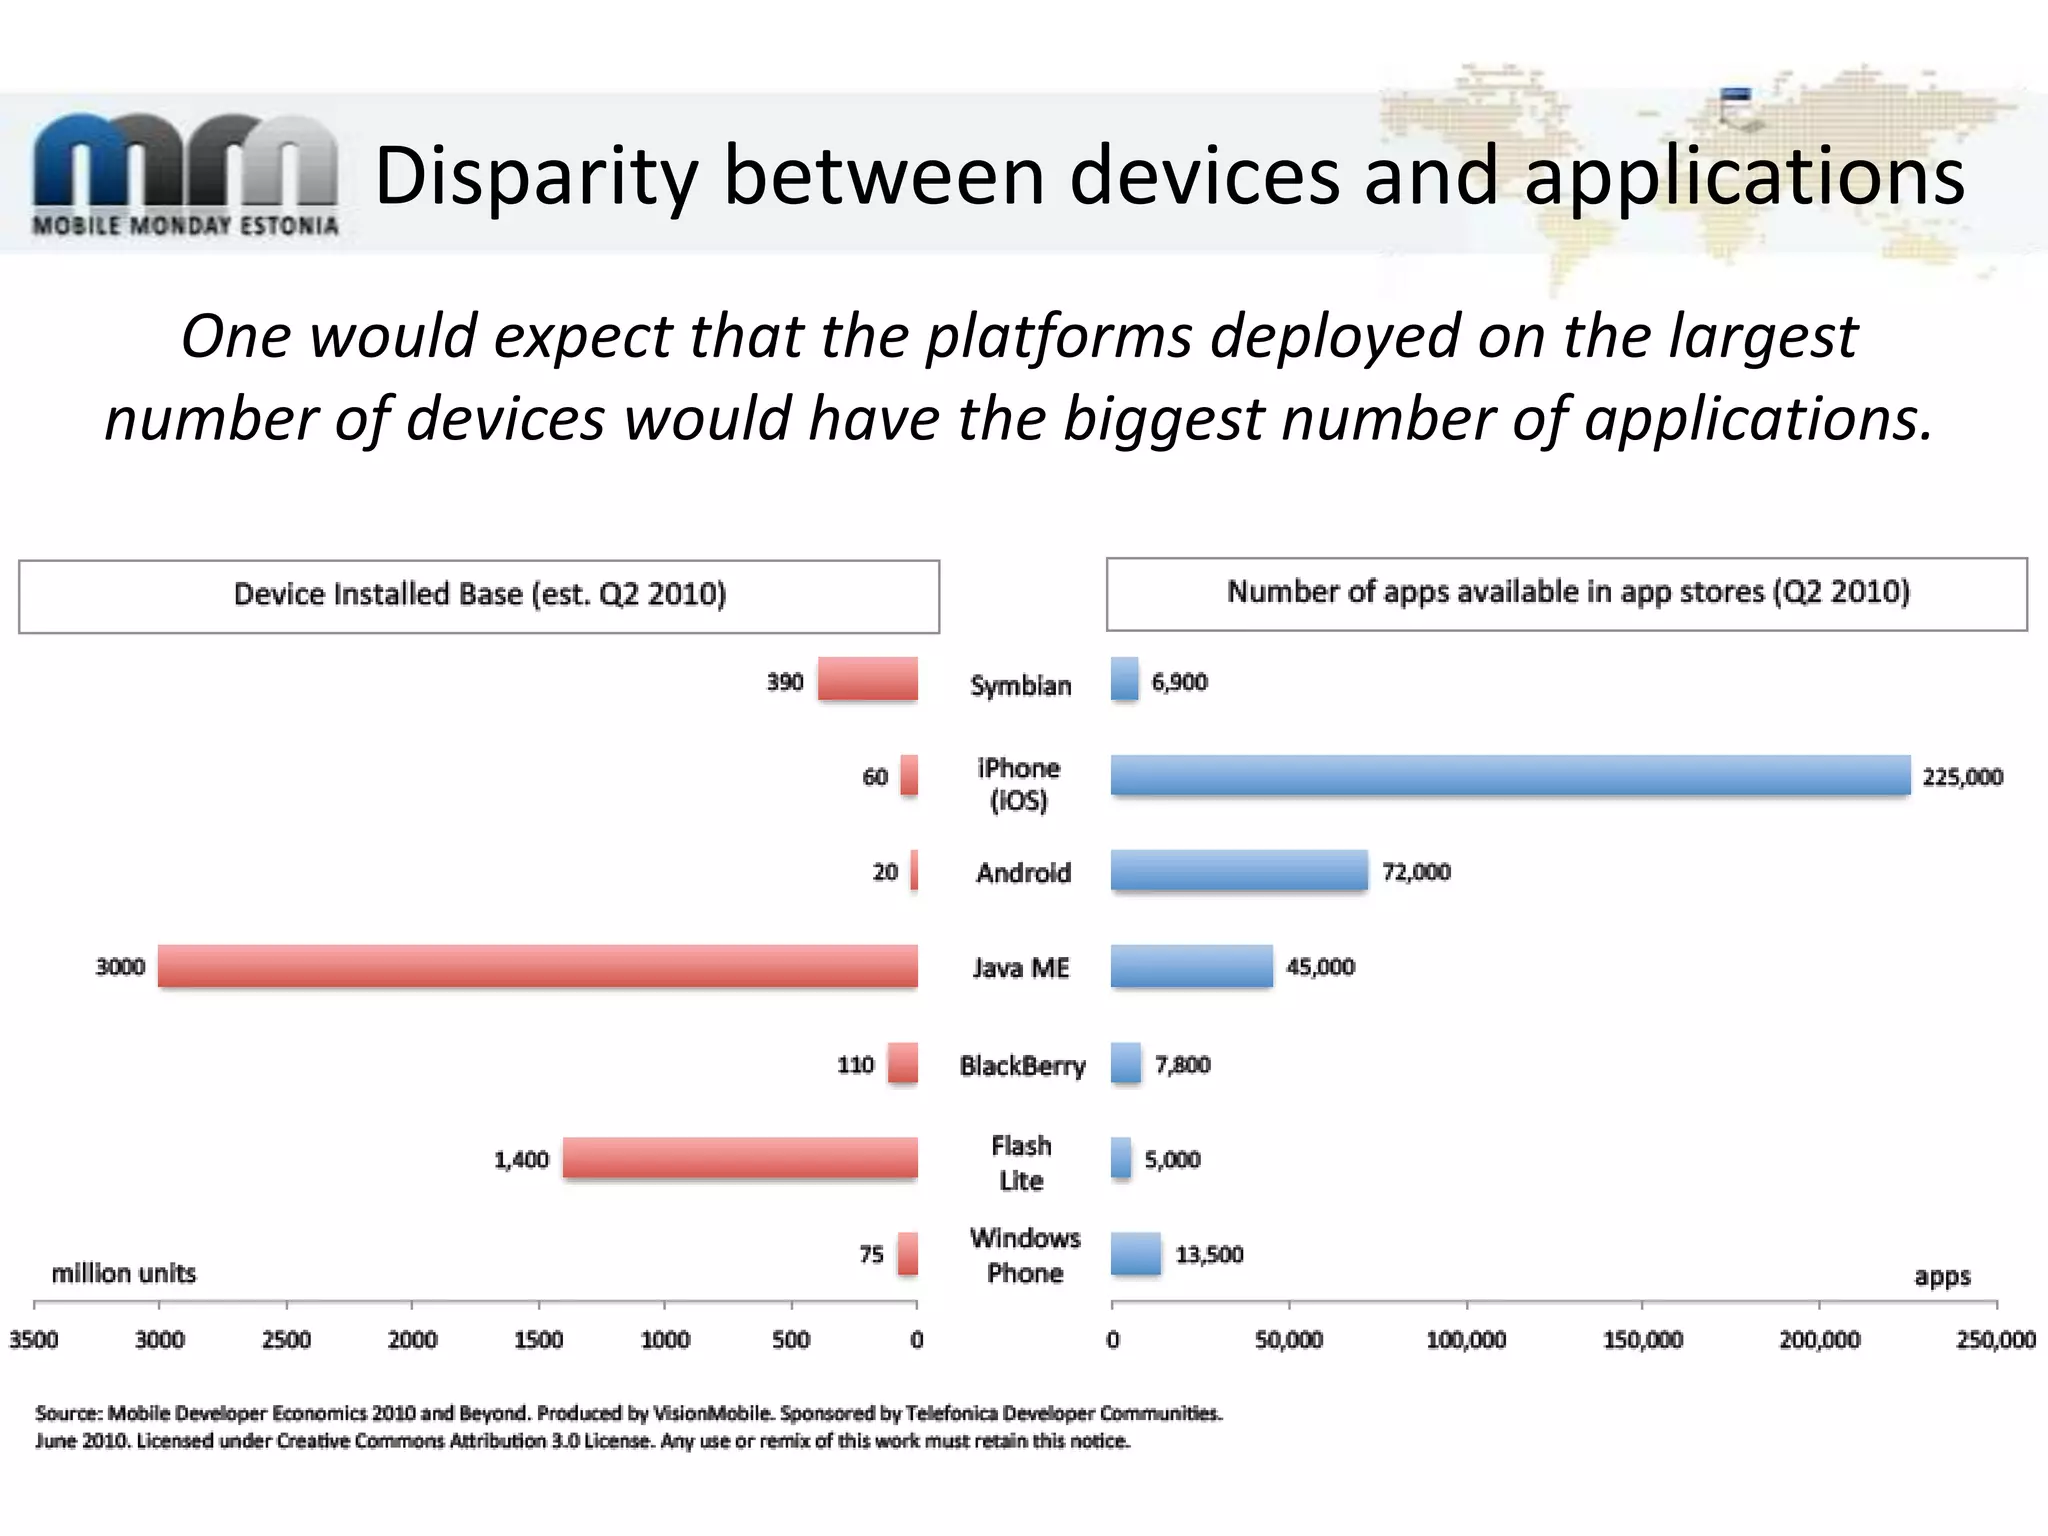
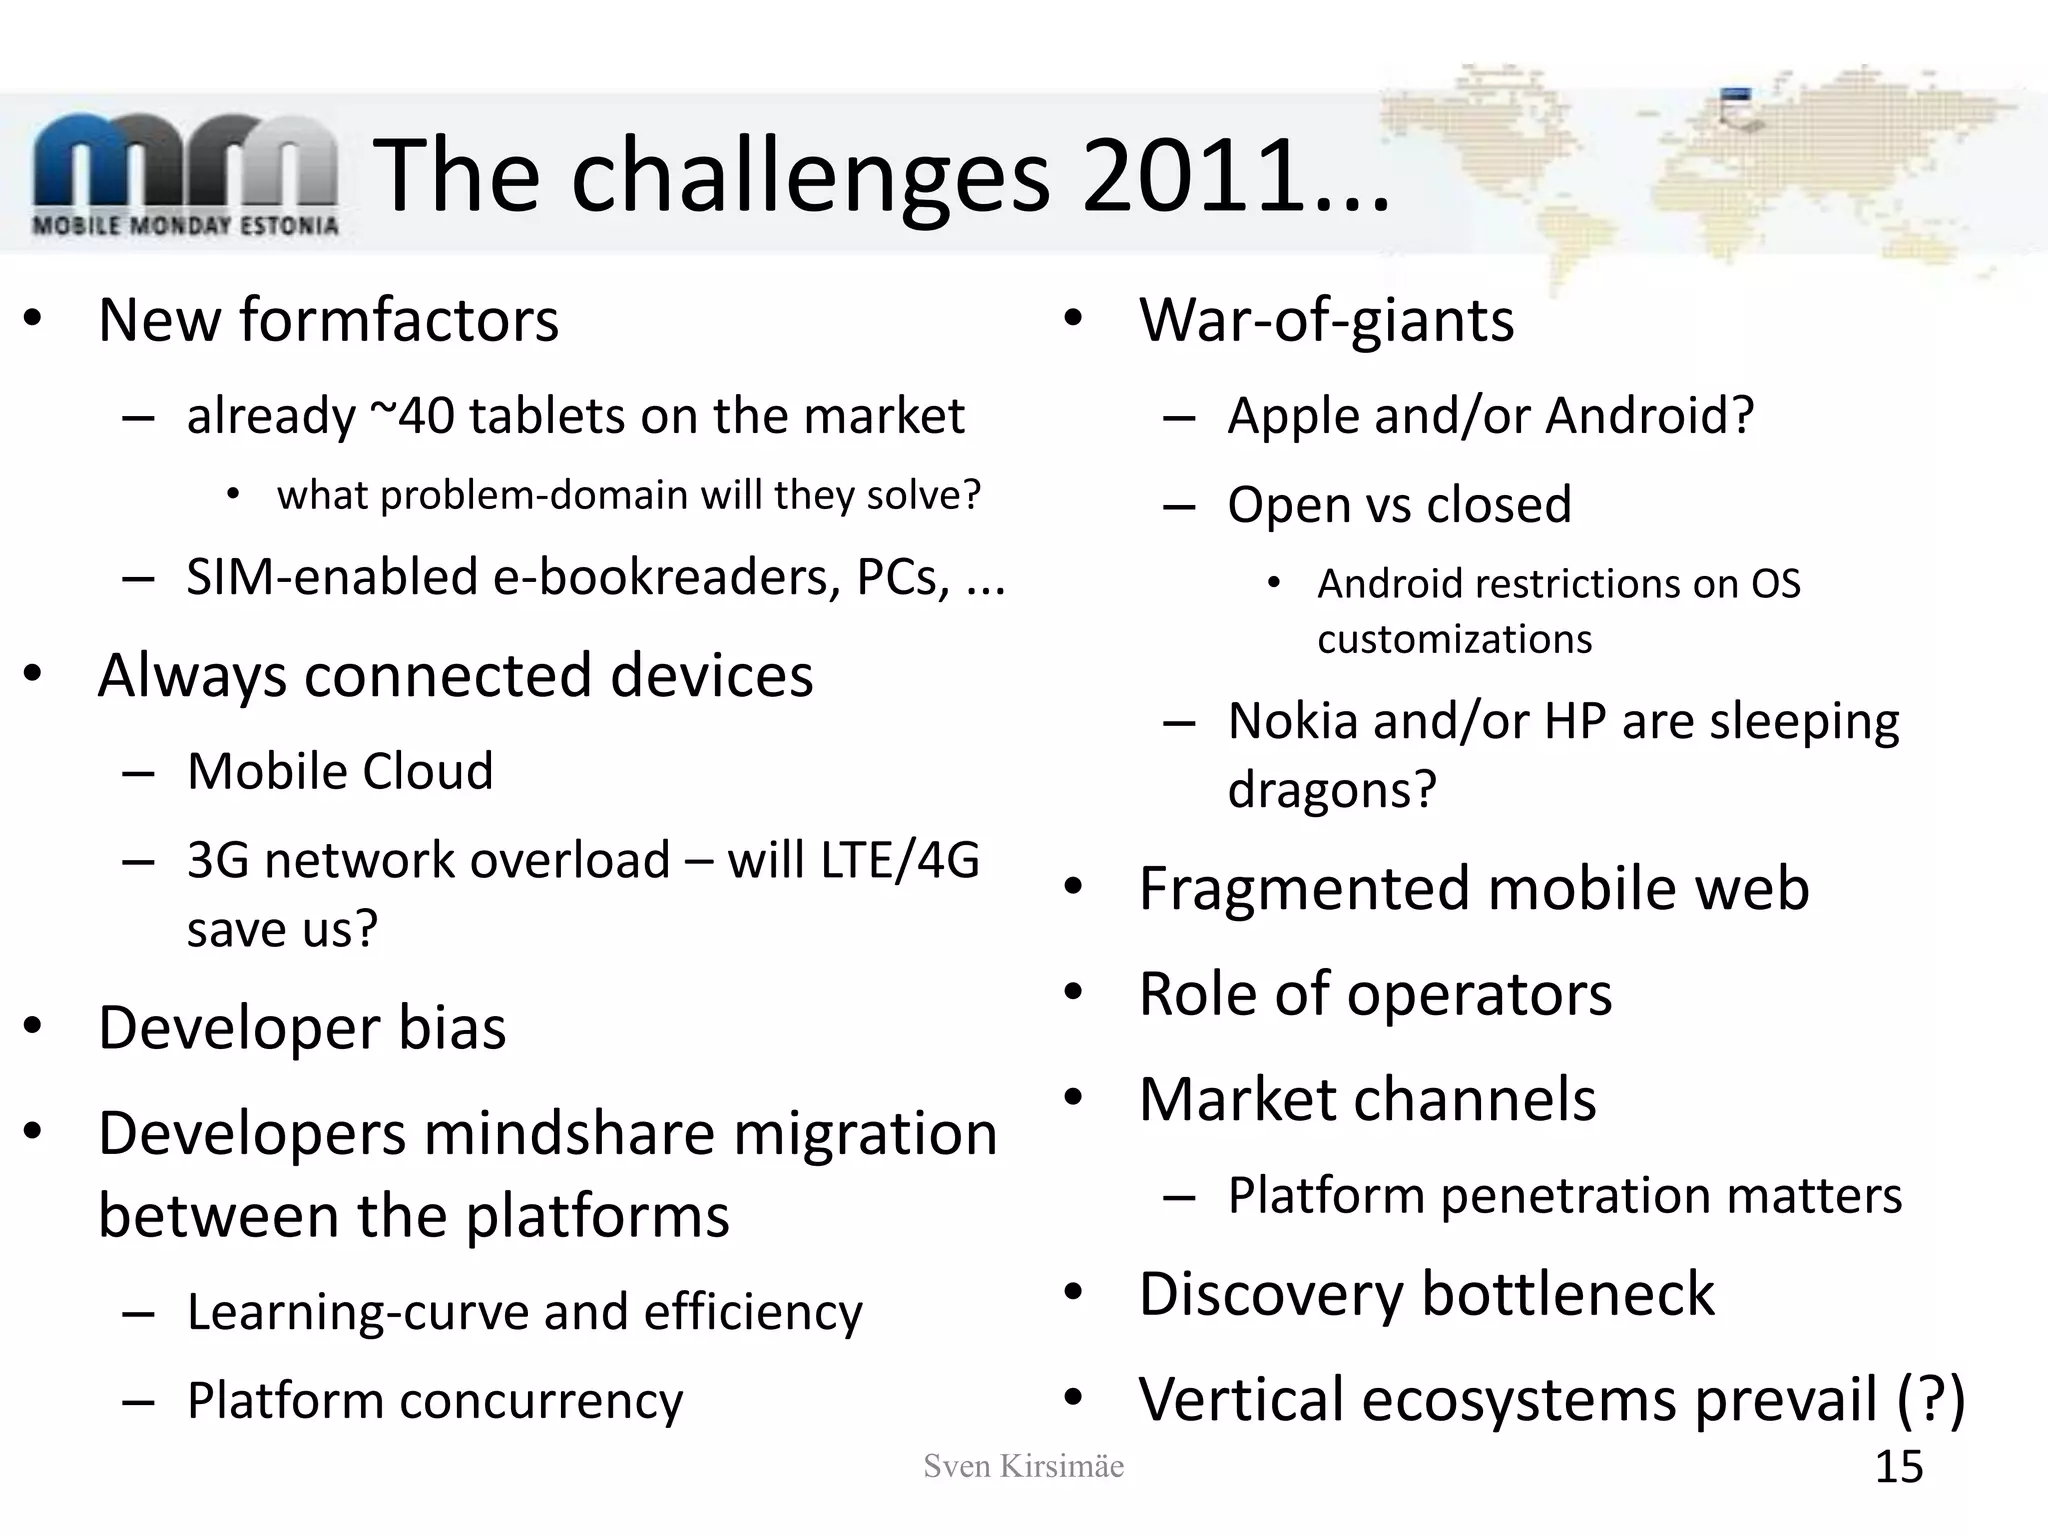
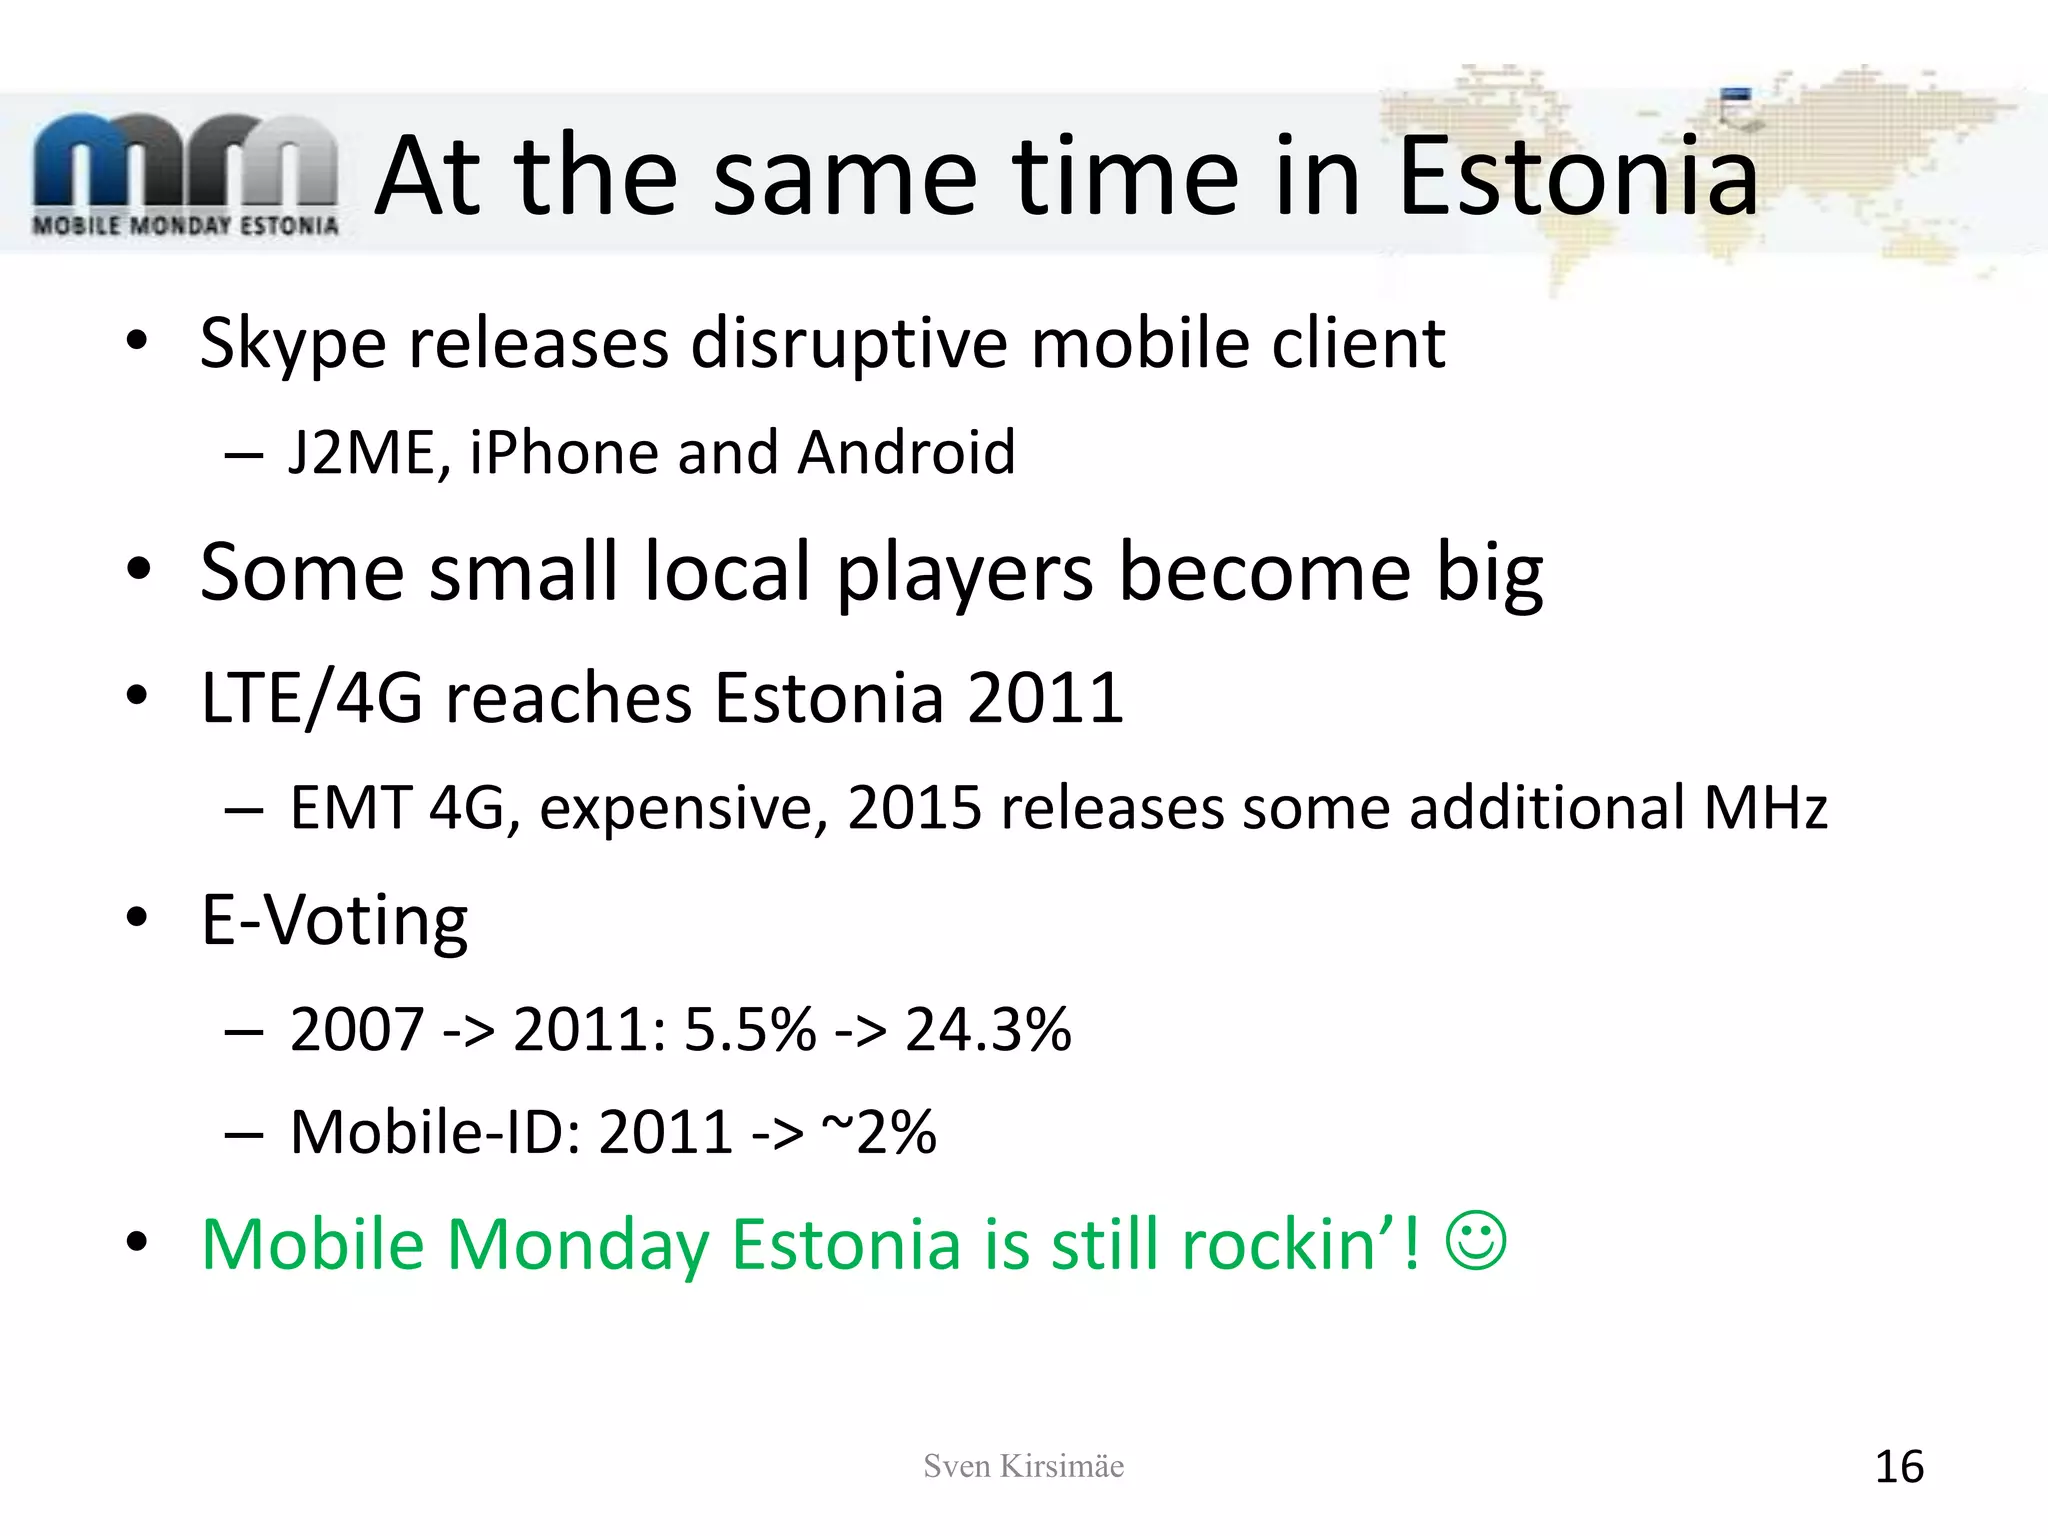
Mobile Software Development2008 to 2011Sven Kirsimäesven@momoestonia.com
The Renaissance period2005-2009The final acts
Smartphones 2008 (admob)Sven Kirsimäe3
Smartphones 2008 (admob)Sven Kirsimäe4
Smartphone OS 2008 (admob)Sven Kirsimäe5
Smartphone OS 2008 (admob)Sven Kirsimäe6
Market state 2008 highlightsIndia & Africa: 80-90% Nokia (Symbian)SonyEricsson & Samsung is 2ndLow-end non-smartphone devicesSmartphone traffic ~25% WWiPhone traffic ~25% from smartphones WWIn 2008 OS WW share changesiOS +30%Symbian -20%RIM, Win Mobile, Palm -10%Sven Kirsimäe7
The challenges 2008...Heavy fragmentation and learning-curve still presentJ2ME, SymbianiOSseems to be pushing hardThe best app distribution-model seen so farWill it hold?Others?Android platform is looking promisinghow will it play out?Apps, apps, apps, web is dead?Distribution channelsOperators: USOEMs emerging: Nokia OVI, Apple, RIMPrivate: GetJar, HandagoOperators opening up?traffic vs. serviceValue in mobile SW development is bubbling upOpen-sourcing OSesAndroidSymbianSven Kirsimäe8
The Industrial Revolution era2010-1014The first act
Smartphones 2008-2011 (VisionMobile)20082011Sven Kirsimäe10
Smartphone OS 2008-2011 (VisionMobile)20082011Sven Kirsimäe11
Looking back at 2010 (US/EU5)Rich media usage:US 47% of subscribers: +8%/yEU5 37% of subscribers: +7%/yMain reasons3G penetrationUnlimited dataplans~1/3 US; ~10% EU5Smartphone adoption of full web browsing devices~50% US (+46%); ~61% EU5 (+28%)80% feature-phones shipped in 2010!Attractive for J2ME/S40 (?)Sven Kirsimäe12
Platforms used by dev till 2011
Disparitybetween devices and applicationsOne would expect that the platforms deployed on thelargestnumber of devices would have the biggest number of applications.
The challenges 2011...New formfactorsalready ~40 tablets on the marketwhat problem-domain will they solve?SIM-enabled e-bookreaders, PCs, ...Always connected devicesMobile Cloud3G network overload – will LTE/4G save us?Developer biasDevelopers mindshare migration between the platformsLearning-curve and efficiencyPlatformconcurrencyWar-of-giantsApple and/or Android?Open vsclosed Android restrictions on OS customizationsNokia and/or HParesleeping dragons?Fragmented mobile webRole of operatorsMarket channelsPlatform penetration mattersDiscovery bottleneckVertical ecosystems prevail (?)Sven Kirsimäe15
At the same time in EstoniaSkype releases disruptive mobile clientJ2ME, iPhone and AndroidSome small local players become bigLTE/4G reaches Estonia 2011EMT 4G, expensive, 2015 releases some additional MHzE-Voting2007 -> 2011: 5.5% -> 24.3%Mobile-ID: 2011 -> ~2%Mobile Monday Estonia is still rockin’! Sven Kirsimäe16
Thank You!Sven Kirsimäesven@kirsimae.com

Mobile Software Development - 2008 to 2011 @ MoMo Tallinn 11.04.11

  • 1.
    Mobile Software Development2008to 2011Sven Kirsimäesven@momoestonia.com
  • 2.
  • 3.
  • 4.
  • 5.
    Smartphone OS 2008(admob)Sven Kirsimäe5
  • 6.
    Smartphone OS 2008(admob)Sven Kirsimäe6
  • 7.
    Market state 2008highlightsIndia & Africa: 80-90% Nokia (Symbian)SonyEricsson & Samsung is 2ndLow-end non-smartphone devicesSmartphone traffic ~25% WWiPhone traffic ~25% from smartphones WWIn 2008 OS WW share changesiOS +30%Symbian -20%RIM, Win Mobile, Palm -10%Sven Kirsimäe7
  • 8.
    The challenges 2008...Heavyfragmentation and learning-curve still presentJ2ME, SymbianiOSseems to be pushing hardThe best app distribution-model seen so farWill it hold?Others?Android platform is looking promisinghow will it play out?Apps, apps, apps, web is dead?Distribution channelsOperators: USOEMs emerging: Nokia OVI, Apple, RIMPrivate: GetJar, HandagoOperators opening up?traffic vs. serviceValue in mobile SW development is bubbling upOpen-sourcing OSesAndroidSymbianSven Kirsimäe8
  • 9.
    The Industrial Revolutionera2010-1014The first act
  • 10.
  • 11.
    Smartphone OS 2008-2011(VisionMobile)20082011Sven Kirsimäe11
  • 12.
    Looking back at2010 (US/EU5)Rich media usage:US 47% of subscribers: +8%/yEU5 37% of subscribers: +7%/yMain reasons3G penetrationUnlimited dataplans~1/3 US; ~10% EU5Smartphone adoption of full web browsing devices~50% US (+46%); ~61% EU5 (+28%)80% feature-phones shipped in 2010!Attractive for J2ME/S40 (?)Sven Kirsimäe12
  • 13.
    Platforms used bydev till 2011
  • 14.
    Disparitybetween devices andapplicationsOne would expect that the platforms deployed on thelargestnumber of devices would have the biggest number of applications.
  • 15.
    The challenges 2011...Newformfactorsalready ~40 tablets on the marketwhat problem-domain will they solve?SIM-enabled e-bookreaders, PCs, ...Always connected devicesMobile Cloud3G network overload – will LTE/4G save us?Developer biasDevelopers mindshare migration between the platformsLearning-curve and efficiencyPlatformconcurrencyWar-of-giantsApple and/or Android?Open vsclosed Android restrictions on OS customizationsNokia and/or HParesleeping dragons?Fragmented mobile webRole of operatorsMarket channelsPlatform penetration mattersDiscovery bottleneckVertical ecosystems prevail (?)Sven Kirsimäe15
  • 16.
    At the sametime in EstoniaSkype releases disruptive mobile clientJ2ME, iPhone and AndroidSome small local players become bigLTE/4G reaches Estonia 2011EMT 4G, expensive, 2015 releases some additional MHzE-Voting2007 -> 2011: 5.5% -> 24.3%Mobile-ID: 2011 -> ~2%Mobile Monday Estonia is still rockin’! Sven Kirsimäe16
  • 17.

Editor's Notes

  • #3 The Dark Ages (2000-2004) – APIs from phones, monetization by operators.The Renaissance period (2005-2009) – smartphones, appstores (API is not enough), iconic product experience, opensource displacementThe Industrial Revolution era (2010-2014) – verticalization of top companies continue, consolidation of mobile OS big players, RTOS will become a legacy and replaced by lightweight versions of OS providers, new diverse set of formfactors emerge, developers can now act more independently from operators.
  • #4 Screen sizes:Small – 20%Medium – 20%Large – 25%X-Large – 30%Supports Polyphonic Ringtones 75.5%Supports Streaming Video 64.1%Able to Download Video Clips 78.0%Supports WAP Push Messages 70.8%
  • #8 India/AfricaScreen sizes:Small – 40%; Medium – 20%; Large – 32%; X-Large – 6%Supports Polyphonic Ringtones 85%Supports Streaming Video 68%Able to Download Video Clips 80%Supports WAP Push Messages 90%Ref: mobile_metrics_feb_09.pdf
  • #9 India/AfricaScreen sizes:Small – 40%; Medium – 20%; Large – 32%; X-Large – 6%Supports Polyphonic Ringtones 85%Supports Streaming Video 68%Able to Download Video Clips 80%Supports WAP Push Messages 90%Ref: mobile_metrics_feb_09.pdf
  • #10 The Dark Ages (2000-2004) – APIs from phones, monetization by operators.The Renaissance period (2005-2009) – smartphones, appstores (API is not enough), iconic product experience, opensource displacementThe Industrial Revolution era (2010-2014) – verticalization of top companies continue, consolidation of mobile OS big players, RTOS will become a legacy and replaced by lightweight versions of OS providers, new diverse set of formfactors emerge, developers can now act more independently from operators.
  • #13 Rich media - web, apps, download content, mobile InternetUS media subscirbers higher – better 3G coverage + flat dataplans + bigger country :P to support all thisEU5= UK, France, Germany, Italy and Spain
  • #15 JavaME 3000 – Success defined in 2005iPhone 225000 – Success defined in 2010One of the major disparities is between the device installed base and the number ofapps per platform. One would expect that the platforms deployed on the largestnumber of devices would have the biggest number of applications. This couldn’t befurther away from the truth. For example, Java ME is available on around threebillion handsets, but the platform can boast less than half of the apps available for themuch younger Android, shipped in only 20 million devices as of the end of the secondhalf of 2010. Similarly, the Symbian operating system is deployed in around 390million handsets (end of first half of 2010), and claims over 6,000 apps, while Apple’siOS has achieved 30x more apps over just 60M units.
  • #16 Developer bias. - across all eight major mobile platforms we surveyed, respondents felt that the best aspect of their platform was the large market penetration, even if the actual market penetration was relatively small.Learning curve and efficiency. The learning curve varies greatly across mobile platforms. Counted in multipliersMarket channels - Operator portals and ondevice preloading through OEM or operator deals is the primary channel to market for fewer than five percent of mobile developers surveyed. Our findings show that developers resort to either ‘native’ app stores, or to direct download via their own websitesDiscovery bottleneck. - lack of effective marketing channels to increase application exposure and discovery. Moreover, half of respondents are willing to pay for premium app store placement.Role of operators. Mobile developers view network operators as bit-pipes. Nearly 80 percent of respondents think that the role of network operators shouldbe to deliver data access anywhere/anytime, while only 53 percent considered their role to be delivering voice calls.Mobile web fragmentation:~60 different versions; ~12 vendors
  • #17 - E-hääletushttp://www.vvk.ee/index.php?id=106104G– vastuvõtjad kallid