SlideShare a Scribd company logo
Data Source

Chart

Axis
Background
Label
Path
Station

Map
New York’s map
Subway line
Station(position)

Projection,data

Scale,Axis,line

Attribute
Class,id,etc..
subway line
New York city

subway_inequality_live
(excel from google doc)

topojson

drawChart([json]);

tabletop
<script type="text/javascript" src="tabletop.js"></script>
<script src="topojson.v0.min.js"></script>
var sourceData;
window.onload = function() { init() };
var url = 'https://docs.google.com/spreadsheet/pub?
key=0ApL2ZVhpOmONdFdTUWhxV252elNORVNqT0g5Y0NzV1E&outp
ut=html';
function init() {
Tabletop.init( { key: url,
callback: show,
simpleSheet: true } );
}
function show(data) {
sourceData = data;
drawChart();
D3.geo.mercator()
d3.geo.path().projection

data(map
data).enter().append(“pat
h”).attr(“d”,path)

New York city map
Subway line
create map
var projection = d3.geo.mercator()
.center([-73.955, 40.678) .translate([w/2, h/2])
.scale([34000]);
var path = d3.geo.path()
.projection(projection);
var g = svg.append("g")
.attr("class", "borough_lines");
create map

var w = 400;
var h = 400;
var svg = d3.select("#map")
.append("svg")
.attr("width", w)
.attr("height", h);
create map

g.selectAll("path.borough_map")
.data(topojson.object(nyc_boroughs[0],
nyc_boroughs[0].objects.new_york_city_boroughs).geometries)
.enter()
.append("path")
.attr("d", path)
.attr("class", "borough_map");
create map
var g1 = svg.append("g")
.attr("class", "map_lines");

g1.selectAll("path.map_line")
.data(topojson.object(subway_lines[0],
subway_lines[0].objects.subways).geometries)
.enter()
.append("path")
.attr("d", path)
.attr("class", function(d){ return "map_line l_" +
d.properties.route_id })
.style("fill", "white")
.style("fill-opacity", 0)
.style("opacity", .5)
.style("stroke-width", 3)
.style("stroke-linecap", "round");
create map

svg.selectAll("circle.map_circle")
.data(sourceData)
.enter()
.append("circle")
.attr("cx", function(d){//transform position
return projection([d.long, d.lat])[0];
})
.attr("cy", function(d){
return projection([d.long, d.lat])[1];
})
.attr("r", 4)
.attr("id", function(d){ return "t_" + d.county + "_" + d.tract })
.attr("opacity", 0);
point marker : t_61_24302 hidden
line

D3.svg.line().x().y().interpolate()

Axis
d3.scale.linear()
d3.svg.axis().scale();
Bla.call(↑)

Data

container

Label

Format,tick
118px

20px

500px

900px
30px
var containerSize = {
width : 900,
height : 400
},

create chart

margins = {top : 20,right : 20,bottom : 30,left : 118},
chartSize = {
width : containerSize.width - margins.left - margins.right - 20,
height : containerSize.height - margins.top - margins.bottom
};
var chart = d3.select("#graphic")
.append("svg")
.attr("width", containerSize.width)
.attr("height", containerSize.height)
.append("g")
.attr("transform", "translate(" + margins.left + "," + margins.top +
")")
.attr("id","chart");
X position,50px
Y position,0px

100px
Data: [{x:5},{y:0}]

What is scale?

var test_scale = d3.scale.linear()
.range([0,100)
.domain([0, 10]);
test_scale(5)? Get 50px
Test_scale(0)? Get 0 px

X: test_scale
Make the scale
var stop_scale = d3.scale.linear()
.range([0,chartSize.width])
.domain([1, 49]);
X: stop_scale
Y: incomeScale

var incomeScale = d3.scale.linear() //data range
.range([chartSize.height, 0])
.domain([0,230000]); //income axis, max230000
Make the axis
convert
function formatNum(d){
return d.toString().replace(/(?=(?!b)(?:d{3})+(?!d))/g,
',')
}

10000 to 10,000

var stop_axis = d3.svg.axis()
.scale(stop_scale);
var incomeAxis = d3.svg.axis()
.scale(incomeScale)
.orient("left")
.tickValues([0, 50000, 100000, 150000, 200000])//tick
.tickSize(-chartSize.width, 0)
.tickPadding(20)
.tickFormat(function(d) { return "$" + formatNum(d); });
//format number
create line

g.selectAll("circle")
.data(sourceData)
.enter()
.append("circle");
window ['lineBox'] = g //dispose
var line2011Path = d3.svg.line()
.x(function(d){return stop_scale(d.position)})
.y(function(d){return incomeScale(d.income2011)})
.interpolate("cardinal");
d3.select("#chart")
.append("g")
.attr("id", "areaBox");

Make the chart

chart.append("g")
.attr("class", "y axis")
.call(incomeAxis);

d3.select(".y.axis")
.append("text")
.attr("text-anchor","middle")
.text("median household
income")
.attr("transform", "rotate
(270, 0, 0)")
.attr("x", -180)
.attr("y", -110);

var g = d3.select("#chart")
.append("g")
.attr("id","line_path_2011";
g.append("path");
Whole data
Trigger by Button
brushed data
By “id”

map

chart
Hide all line
ShowLine (id)

Hide all points
Matching path
Transition path (id)
Show related points (brushed data)
Class: line l_1

<div class="line l_1">1</div>
<div class="line l_2">2</div>
<div class="line l_3">3</div>
<div class="line l_4">4</div>
<div class="line l_5">5</div>
<div class="line l_6">6</div>
<div class="line l_7">7</div>
....
..
<div class="line l_J">J</div>
<div class="line l_Z">Z</div>
<div class="line l_G">G</div>
<div class="line l_L">L</div>
<div class="line
l_SIR">SIR</div>

Create button
use css to color
the line
.l_123, .l_1, .l_2, .l_3
{ background-color: #FF3535; stroke: #FF3535;}
.l_456, .l_4, .l_5, .l_6
{ background-color: #019733; stroke: #019733;}
.l_7 { background-color: #CC02C8; stroke: #CC02C8;}
.l_ace, .l_A, .l_C, .l_E
{ background-color: #0F6797; stroke: #0F6797;}
.l_bdfm, .l_B, .l_D, .l_F, .l_M { background-color: #FF9800; stroke: #FF9800;}
.l_nqr, .l_N, .l_Q, .l_R
{ background-color: #ffe400; stroke: #ffe400;}
.l_SIR
{ background-color: #164480; stroke: #164480;}
.l_jz, .l_J, .l_Z
{ background-color: #986701; stroke: #986701;}
.l_L, .l_l
{ background-color: #999999; stroke: #999999;}
.l_G, .l_g
{ background-color: #9BCF00; stroke: #9BCF00;}
Make the transition

function drawLine(filteredData,
id){

d3.selectAll(".line")
.on(“click”, brushData)
function brushData(){
id = d3.select(this).text();
filteredData =
sourceData.filter(function(d){return d.line
=== id});
drawLine(filteredData, id);

…
Draw chart line(l_+id)
…
Draw subway (l_+id)
…
Show circles(filteredData)
}
function drawLine(filteredData,
id){
Draw chart line(l_+id)
Draw subway (l_+id)
Show circles(filteredData)
}

Show circles(filteredData)

d3.selectAll("circle")
.transition()
.duration(500)
.attr("r", 0);//minimize all circle
window['lineBox'].selectAll("circle")
.data(filteredData)
.transition()
.duration(1000)
.attr("r", 4)
.attr("class", function(d) {return "t_" + d.county + "_" + d.tract })
.attr("cx", function(d) {return stop_scale(d.position)})
.attr("cy", function(d) {return incomeScale(d.income2011)});
function drawLine(filteredData,
id){
Draw chart line(l_+id)
Draw subway (l_+id)
Show circles(filteredData)
}

Draw chart line(l_+id)

d3.select("#line_path_2011 path")
.attr("class", "graph_line l_" + id
.transition()
.duration(1000)
.attr("d", line2011Path(filteredData)

var line2011Path = d3.svg.line()
.x(function(d){return stop_scale(d.position)})
.y(function(d){return incomeScale(d.income2011)})
.interpolate("cardinal");
function drawLine(filteredData,
id){
Draw chart line(l_+id)
Draw subway (l_+id)
Show circles(filteredData)
}

Draw subway (l_+id)

//hideall
d3.selectAll(".map_line")
.transition()
.duration(500)
.style("opacity", 0);
//show
d3.selectAll(".map_line.l_" + id)
.transition()
.duration(500)
.style("opacity", 1);

d3.selectAll(".line")
.classed("selected", false);
d3.select(".line.l_" + id)
.classed("selected", true);
Create info box

<div id="tooltip" class="">
<div class="line l_F ">F</div>
<div id="stop-name">
<span id="name">East Broadway</span>
</div>
<div class="label-wrap">
<div class="label-number" id="income2011">$86,806</div>
<div class="label">2011 median household income in census tract
<span id="census">001401</span></div>
</div>
</div>
Define point activity

//hover overs/interactions
d3.selectAll("circle")
.on("mouseover", function(d) {
//Show tooltip(mouse position)
//Bigger the point on chart
//Insert content
//Show the point on map
})
.on("mouseout", function() {
//hide tooltip
//Smaller the point
});
d3.select(this)
.transition()
Bigger the point on chart
.attr("r", 8);
d3.select("#tooltip")
.style("left", (d3.event.pageX) + 20 + "px")
.style("top", (d3.event.pageY) - 30 + "px").transition()
Show tooltip
.style("opacity", 1);
d3.select('#stop-name #name')
.text(d.stopname)
d3.select('#tooltip .line')
.text(id)
.attr("class", "line l_" + id, true)
Fill the content
d3.select('#income2011')
.text("$" + formatNum(d.income2011));
d3.select('#census')
.text(d.tractlookup);
d3.select("circle#" + this.className.animVal)
.transition()
.duration(500)
.attr("opacity", 1)
.attr("r", 5);

Show point on map
//Hide the tooltip
d3.select("#tooltip")
.transition()
.style("opacity", 0);
d3.select(this)
.transition()
.attr("r", 4);
d3.selectAll("#map circle")
.transition()
.duration(500)
.attr("opacity", 0);

Hide tooltip

Smaller point on chart

Hide point on map
Start:where we can draw the next county

Cut the county

County:id

Span: how many points
Whole data
Memo:[]

Match the line “id”
Filtered data
Reduce data

County change?
yes
Push new county
data(start,span,county
)

no
Span++
Filter data

Boroughs =
filteredData.reduce(
function (memo, stop, i) {
var len = memo.length;
if (len == 0 || (memo[len - 1].county != stop.county)) {
memo.push({
county : stop.county,
start : i + 1,
span : 1
});
} else {
memo[len - 1].span++;
}
[{"county":"47","start":1,"span":19},
return memo;
{"county":"61","start":20,"span":15}]
},
[])
Draw county

var gCounties = d3.select("#areaBox")
.selectAll('g.borough')
.data(boroughs).enter()
.append('g')
.attr('class', 'borough')
.attr('transform', function (d)
return 'translate(' + stop_scale(d.start) +
});
Add label

gCounties.append('rect')
.attr('x', -5)
.attr('width', function (d) {
return stop_scale(d.span + .8)
})
.attr('height', chartSize.height);

gCounties.append('text')
.attr("y", 15)
.text(function (d) {
if (d.county == "5") {
return "BRX"
} else if (d.county == "61") {
return "MAN"
} else if (d.county == "81") {
return "QNS"
} else if (d.county == "47") {
return "BRK"
};
});

More Related Content

What's hot

Standford 2015 week3: Objective-C Compatibility, Property List, Views
Standford 2015 week3: Objective-C Compatibility, Property List, ViewsStandford 2015 week3: Objective-C Compatibility, Property List, Views
Standford 2015 week3: Objective-C Compatibility, Property List, Views
彼得潘 Pan
 
Standford 2015 week9
Standford 2015 week9Standford 2015 week9
Standford 2015 week9
彼得潘 Pan
 
QML\Qt Quick на практике
QML\Qt Quick на практикеQML\Qt Quick на практике
QML\Qt Quick на практике
Platonov Sergey
 
Charting with Google
Charting with GoogleCharting with Google
Charting with Google
Russell Heimlich
 
PART 5: RASTER DATA
PART 5: RASTER DATAPART 5: RASTER DATA
PART 5: RASTER DATA
Andrea Antonello
 
The Ring programming language version 1.7 book - Part 48 of 196
The Ring programming language version 1.7 book - Part 48 of 196The Ring programming language version 1.7 book - Part 48 of 196
The Ring programming language version 1.7 book - Part 48 of 196
Mahmoud Samir Fayed
 
VC「もしかして...」Model「私たち...」「「入れ替わってるー!?」」を前前前世から防ぐ方法
VC「もしかして...」Model「私たち...」「「入れ替わってるー!?」」を前前前世から防ぐ方法VC「もしかして...」Model「私たち...」「「入れ替わってるー!?」」を前前前世から防ぐ方法
VC「もしかして...」Model「私たち...」「「入れ替わってるー!?」」を前前前世から防ぐ方法
Kenji Tanaka
 
Sapo GIS Hands-On
Sapo GIS Hands-OnSapo GIS Hands-On
Sapo GIS Hands-Oncodebits
 
Jfreechart tutorial
Jfreechart tutorialJfreechart tutorial
Jfreechart tutorial
Danilo Tabares Jimenez
 
PART 6: FROM GEO INTO YOUR REPORT
PART 6: FROM GEO INTO YOUR REPORTPART 6: FROM GEO INTO YOUR REPORT
PART 6: FROM GEO INTO YOUR REPORT
Andrea Antonello
 
djangoのmigrationはどう動いているか
djangoのmigrationはどう動いているかdjangoのmigrationはどう動いているか
djangoのmigrationはどう動いているか
Xoxzo Inc.
 
Android progamming fundamentals
Android progamming fundamentalsAndroid progamming fundamentals
Android progamming fundamentals
Adnene BELFODIL
 
Swift, via "swift-2048"
Swift, via "swift-2048"Swift, via "swift-2048"
Swift, via "swift-2048"
Austin Zheng
 
The Ring programming language version 1.9 book - Part 38 of 210
The Ring programming language version 1.9 book - Part 38 of 210The Ring programming language version 1.9 book - Part 38 of 210
The Ring programming language version 1.9 book - Part 38 of 210
Mahmoud Samir Fayed
 
Google Chart Tools Kanika Garg (10BM60035) Lavanya R. (10BM60042)
Google Chart Tools Kanika Garg (10BM60035) Lavanya R. (10BM60042)Google Chart Tools Kanika Garg (10BM60035) Lavanya R. (10BM60042)
Google Chart Tools Kanika Garg (10BM60035) Lavanya R. (10BM60042)
Kanika Garg
 
D3 svg & angular
D3 svg & angularD3 svg & angular
D3 svg & angular
500Tech
 
Advance java
Advance javaAdvance java
Advance java
Vivek Kumar Sinha
 
Exceptional exceptions
Exceptional exceptionsExceptional exceptions
Exceptional exceptions
Llewellyn Falco
 
A new distance education certificate program .ppt
A new distance education certificate program .pptA new distance education certificate program .ppt
A new distance education certificate program .pptRichard Smith
 

What's hot (20)

Standford 2015 week3: Objective-C Compatibility, Property List, Views
Standford 2015 week3: Objective-C Compatibility, Property List, ViewsStandford 2015 week3: Objective-C Compatibility, Property List, Views
Standford 2015 week3: Objective-C Compatibility, Property List, Views
 
Standford 2015 week9
Standford 2015 week9Standford 2015 week9
Standford 2015 week9
 
QML\Qt Quick на практике
QML\Qt Quick на практикеQML\Qt Quick на практике
QML\Qt Quick на практике
 
Charting with Google
Charting with GoogleCharting with Google
Charting with Google
 
PART 5: RASTER DATA
PART 5: RASTER DATAPART 5: RASTER DATA
PART 5: RASTER DATA
 
The Ring programming language version 1.7 book - Part 48 of 196
The Ring programming language version 1.7 book - Part 48 of 196The Ring programming language version 1.7 book - Part 48 of 196
The Ring programming language version 1.7 book - Part 48 of 196
 
VC「もしかして...」Model「私たち...」「「入れ替わってるー!?」」を前前前世から防ぐ方法
VC「もしかして...」Model「私たち...」「「入れ替わってるー!?」」を前前前世から防ぐ方法VC「もしかして...」Model「私たち...」「「入れ替わってるー!?」」を前前前世から防ぐ方法
VC「もしかして...」Model「私たち...」「「入れ替わってるー!?」」を前前前世から防ぐ方法
 
Sapo GIS Hands-On
Sapo GIS Hands-OnSapo GIS Hands-On
Sapo GIS Hands-On
 
Jfreechart tutorial
Jfreechart tutorialJfreechart tutorial
Jfreechart tutorial
 
PART 6: FROM GEO INTO YOUR REPORT
PART 6: FROM GEO INTO YOUR REPORTPART 6: FROM GEO INTO YOUR REPORT
PART 6: FROM GEO INTO YOUR REPORT
 
djangoのmigrationはどう動いているか
djangoのmigrationはどう動いているかdjangoのmigrationはどう動いているか
djangoのmigrationはどう動いているか
 
Android progamming fundamentals
Android progamming fundamentalsAndroid progamming fundamentals
Android progamming fundamentals
 
Swift, via "swift-2048"
Swift, via "swift-2048"Swift, via "swift-2048"
Swift, via "swift-2048"
 
The Ring programming language version 1.9 book - Part 38 of 210
The Ring programming language version 1.9 book - Part 38 of 210The Ring programming language version 1.9 book - Part 38 of 210
The Ring programming language version 1.9 book - Part 38 of 210
 
Google Chart Tools Kanika Garg (10BM60035) Lavanya R. (10BM60042)
Google Chart Tools Kanika Garg (10BM60035) Lavanya R. (10BM60042)Google Chart Tools Kanika Garg (10BM60035) Lavanya R. (10BM60042)
Google Chart Tools Kanika Garg (10BM60035) Lavanya R. (10BM60042)
 
D3 svg & angular
D3 svg & angularD3 svg & angular
D3 svg & angular
 
Advance java
Advance javaAdvance java
Advance java
 
Exceptional exceptions
Exceptional exceptionsExceptional exceptions
Exceptional exceptions
 
A new distance education certificate program .ppt
A new distance education certificate program .pptA new distance education certificate program .ppt
A new distance education certificate program .ppt
 
D3.js workshop
D3.js workshopD3.js workshop
D3.js workshop
 

Viewers also liked

Resume
ResumeResume
Resume
Bioroid
 
R and Big Data using Revolution R Enterprise with Hadoop
R and Big Data using Revolution R Enterprise with HadoopR and Big Data using Revolution R Enterprise with Hadoop
R and Big Data using Revolution R Enterprise with Hadoop
Revolution Analytics
 
R workshop xx -- Parallel Computing with R
R workshop xx -- Parallel Computing with R R workshop xx -- Parallel Computing with R
R workshop xx -- Parallel Computing with R
Vivian S. Zhang
 
R workshop iii -- 3 hours to learn ggplot2 series
R workshop iii -- 3 hours to learn ggplot2 seriesR workshop iii -- 3 hours to learn ggplot2 series
R workshop iii -- 3 hours to learn ggplot2 series
Vivian S. Zhang
 
Introducing natural language processing(NLP) with r
Introducing natural language processing(NLP) with rIntroducing natural language processing(NLP) with r
Introducing natural language processing(NLP) with r
Vivian S. Zhang
 

Viewers also liked (6)

Resume
ResumeResume
Resume
 
13 jun13 gaming-webinar
13 jun13 gaming-webinar13 jun13 gaming-webinar
13 jun13 gaming-webinar
 
R and Big Data using Revolution R Enterprise with Hadoop
R and Big Data using Revolution R Enterprise with HadoopR and Big Data using Revolution R Enterprise with Hadoop
R and Big Data using Revolution R Enterprise with Hadoop
 
R workshop xx -- Parallel Computing with R
R workshop xx -- Parallel Computing with R R workshop xx -- Parallel Computing with R
R workshop xx -- Parallel Computing with R
 
R workshop iii -- 3 hours to learn ggplot2 series
R workshop iii -- 3 hours to learn ggplot2 seriesR workshop iii -- 3 hours to learn ggplot2 series
R workshop iii -- 3 hours to learn ggplot2 series
 
Introducing natural language processing(NLP) with r
Introducing natural language processing(NLP) with rIntroducing natural language processing(NLP) with r
Introducing natural language processing(NLP) with r
 

Similar to Supstat nyc subway

The Web map stack on Django
The Web map stack on DjangoThe Web map stack on Django
The Web map stack on Django
Paul Smith
 
Better d3 charts with tdd
Better d3 charts with tddBetter d3 charts with tdd
Better d3 charts with tdd
Marcos Iglesias
 
D3
D3D3
Introduction to d3js (and SVG)
Introduction to d3js (and SVG)Introduction to d3js (and SVG)
Introduction to d3js (and SVG)
zahid-mian
 
Svcc 2013-d3
Svcc 2013-d3Svcc 2013-d3
Svcc 2013-d3
Oswald Campesato
 
SVCC 2013 D3.js Presentation (10/05/2013)
SVCC 2013 D3.js Presentation (10/05/2013)SVCC 2013 D3.js Presentation (10/05/2013)
SVCC 2013 D3.js Presentation (10/05/2013)
Oswald Campesato
 
Exploring Canvas
Exploring CanvasExploring Canvas
Exploring CanvasKevin Hoyt
 
Data Structure in C Programming Language
Data Structure in C Programming LanguageData Structure in C Programming Language
Data Structure in C Programming Language
Arkadeep Dey
 
Computer graphics lab assignment
Computer graphics lab assignmentComputer graphics lab assignment
Computer graphics lab assignment
Abdullah Al Shiam
 
Scrollytelling
ScrollytellingScrollytelling
Scrollytelling
Baron Watts
 
Computer graphics lab manual
Computer graphics lab manualComputer graphics lab manual
Computer graphics lab manual
Uma mohan
 
A Shiny Example-- R
A Shiny Example-- RA Shiny Example-- R
A Shiny Example-- R
Dr. Volkan OBAN
 
The Ring programming language version 1.5.3 book - Part 54 of 184
The Ring programming language version 1.5.3 book - Part 54 of 184The Ring programming language version 1.5.3 book - Part 54 of 184
The Ring programming language version 1.5.3 book - Part 54 of 184
Mahmoud Samir Fayed
 
The Ring programming language version 1.5.3 book - Part 44 of 184
The Ring programming language version 1.5.3 book - Part 44 of 184The Ring programming language version 1.5.3 book - Part 44 of 184
The Ring programming language version 1.5.3 book - Part 44 of 184
Mahmoud Samir Fayed
 
I need to create a page looks like a picture. But it looks different.pdf
I need to create a page looks like a picture. But it looks different.pdfI need to create a page looks like a picture. But it looks different.pdf
I need to create a page looks like a picture. But it looks different.pdf
allurafashions98
 
The Ring programming language version 1.10 book - Part 54 of 212
The Ring programming language version 1.10 book - Part 54 of 212The Ring programming language version 1.10 book - Part 54 of 212
The Ring programming language version 1.10 book - Part 54 of 212
Mahmoud Samir Fayed
 
Fun with D3.js: Data Visualization Eye Candy with Streaming JSON
Fun with D3.js: Data Visualization Eye Candy with Streaming JSONFun with D3.js: Data Visualization Eye Candy with Streaming JSON
Fun with D3.js: Data Visualization Eye Candy with Streaming JSON
Tomomi Imura
 
ggtimeseries-->ggplot2 extensions
ggtimeseries-->ggplot2 extensions ggtimeseries-->ggplot2 extensions
ggtimeseries-->ggplot2 extensions
Dr. Volkan OBAN
 

Similar to Supstat nyc subway (20)

The Web map stack on Django
The Web map stack on DjangoThe Web map stack on Django
The Web map stack on Django
 
Better d3 charts with tdd
Better d3 charts with tddBetter d3 charts with tdd
Better d3 charts with tdd
 
D3
D3D3
D3
 
Introduction to d3js (and SVG)
Introduction to d3js (and SVG)Introduction to d3js (and SVG)
Introduction to d3js (and SVG)
 
Svcc 2013-d3
Svcc 2013-d3Svcc 2013-d3
Svcc 2013-d3
 
SVCC 2013 D3.js Presentation (10/05/2013)
SVCC 2013 D3.js Presentation (10/05/2013)SVCC 2013 D3.js Presentation (10/05/2013)
SVCC 2013 D3.js Presentation (10/05/2013)
 
C++ programs
C++ programsC++ programs
C++ programs
 
Exploring Canvas
Exploring CanvasExploring Canvas
Exploring Canvas
 
Data Structure in C Programming Language
Data Structure in C Programming LanguageData Structure in C Programming Language
Data Structure in C Programming Language
 
JQuery Flot
JQuery FlotJQuery Flot
JQuery Flot
 
Computer graphics lab assignment
Computer graphics lab assignmentComputer graphics lab assignment
Computer graphics lab assignment
 
Scrollytelling
ScrollytellingScrollytelling
Scrollytelling
 
Computer graphics lab manual
Computer graphics lab manualComputer graphics lab manual
Computer graphics lab manual
 
A Shiny Example-- R
A Shiny Example-- RA Shiny Example-- R
A Shiny Example-- R
 
The Ring programming language version 1.5.3 book - Part 54 of 184
The Ring programming language version 1.5.3 book - Part 54 of 184The Ring programming language version 1.5.3 book - Part 54 of 184
The Ring programming language version 1.5.3 book - Part 54 of 184
 
The Ring programming language version 1.5.3 book - Part 44 of 184
The Ring programming language version 1.5.3 book - Part 44 of 184The Ring programming language version 1.5.3 book - Part 44 of 184
The Ring programming language version 1.5.3 book - Part 44 of 184
 
I need to create a page looks like a picture. But it looks different.pdf
I need to create a page looks like a picture. But it looks different.pdfI need to create a page looks like a picture. But it looks different.pdf
I need to create a page looks like a picture. But it looks different.pdf
 
The Ring programming language version 1.10 book - Part 54 of 212
The Ring programming language version 1.10 book - Part 54 of 212The Ring programming language version 1.10 book - Part 54 of 212
The Ring programming language version 1.10 book - Part 54 of 212
 
Fun with D3.js: Data Visualization Eye Candy with Streaming JSON
Fun with D3.js: Data Visualization Eye Candy with Streaming JSONFun with D3.js: Data Visualization Eye Candy with Streaming JSON
Fun with D3.js: Data Visualization Eye Candy with Streaming JSON
 
ggtimeseries-->ggplot2 extensions
ggtimeseries-->ggplot2 extensions ggtimeseries-->ggplot2 extensions
ggtimeseries-->ggplot2 extensions
 

More from Vivian S. Zhang

Why NYC DSA.pdf
Why NYC DSA.pdfWhy NYC DSA.pdf
Why NYC DSA.pdf
Vivian S. Zhang
 
Career services workshop- Roger Ren
Career services workshop- Roger RenCareer services workshop- Roger Ren
Career services workshop- Roger Ren
Vivian S. Zhang
 
Nycdsa wordpress guide book
Nycdsa wordpress guide bookNycdsa wordpress guide book
Nycdsa wordpress guide book
Vivian S. Zhang
 
We're so skewed_presentation
We're so skewed_presentationWe're so skewed_presentation
We're so skewed_presentation
Vivian S. Zhang
 
Wikipedia: Tuned Predictions on Big Data
Wikipedia: Tuned Predictions on Big DataWikipedia: Tuned Predictions on Big Data
Wikipedia: Tuned Predictions on Big Data
Vivian S. Zhang
 
A Hybrid Recommender with Yelp Challenge Data
A Hybrid Recommender with Yelp Challenge Data A Hybrid Recommender with Yelp Challenge Data
A Hybrid Recommender with Yelp Challenge Data
Vivian S. Zhang
 
Kaggle Top1% Solution: Predicting Housing Prices in Moscow
Kaggle Top1% Solution: Predicting Housing Prices in Moscow Kaggle Top1% Solution: Predicting Housing Prices in Moscow
Kaggle Top1% Solution: Predicting Housing Prices in Moscow
Vivian S. Zhang
 
Data mining with caret package
Data mining with caret packageData mining with caret package
Data mining with caret package
Vivian S. Zhang
 
Xgboost
XgboostXgboost
Streaming Python on Hadoop
Streaming Python on HadoopStreaming Python on Hadoop
Streaming Python on Hadoop
Vivian S. Zhang
 
Kaggle Winning Solution Xgboost algorithm -- Let us learn from its author
Kaggle Winning Solution Xgboost algorithm -- Let us learn from its authorKaggle Winning Solution Xgboost algorithm -- Let us learn from its author
Kaggle Winning Solution Xgboost algorithm -- Let us learn from its author
Vivian S. Zhang
 
Xgboost
XgboostXgboost
Nyc open-data-2015-andvanced-sklearn-expanded
Nyc open-data-2015-andvanced-sklearn-expandedNyc open-data-2015-andvanced-sklearn-expanded
Nyc open-data-2015-andvanced-sklearn-expanded
Vivian S. Zhang
 
Nycdsa ml conference slides march 2015
Nycdsa ml conference slides march 2015 Nycdsa ml conference slides march 2015
Nycdsa ml conference slides march 2015
Vivian S. Zhang
 
THE HACK ON JERSEY CITY CONDO PRICES explore trends in public data
THE HACK ON JERSEY CITY CONDO PRICES explore trends in public dataTHE HACK ON JERSEY CITY CONDO PRICES explore trends in public data
THE HACK ON JERSEY CITY CONDO PRICES explore trends in public data
Vivian S. Zhang
 
Max Kuhn's talk on R machine learning
Max Kuhn's talk on R machine learningMax Kuhn's talk on R machine learning
Max Kuhn's talk on R machine learning
Vivian S. Zhang
 
Winning data science competitions, presented by Owen Zhang
Winning data science competitions, presented by Owen ZhangWinning data science competitions, presented by Owen Zhang
Winning data science competitions, presented by Owen Zhang
Vivian S. Zhang
 
Using Machine Learning to aid Journalism at the New York Times
Using Machine Learning to aid Journalism at the New York TimesUsing Machine Learning to aid Journalism at the New York Times
Using Machine Learning to aid Journalism at the New York Times
Vivian S. Zhang
 
Bayesian models in r
Bayesian models in rBayesian models in r
Bayesian models in r
Vivian S. Zhang
 
Natural Language Processing(SupStat Inc)
Natural Language Processing(SupStat Inc)Natural Language Processing(SupStat Inc)
Natural Language Processing(SupStat Inc)
Vivian S. Zhang
 

More from Vivian S. Zhang (20)

Why NYC DSA.pdf
Why NYC DSA.pdfWhy NYC DSA.pdf
Why NYC DSA.pdf
 
Career services workshop- Roger Ren
Career services workshop- Roger RenCareer services workshop- Roger Ren
Career services workshop- Roger Ren
 
Nycdsa wordpress guide book
Nycdsa wordpress guide bookNycdsa wordpress guide book
Nycdsa wordpress guide book
 
We're so skewed_presentation
We're so skewed_presentationWe're so skewed_presentation
We're so skewed_presentation
 
Wikipedia: Tuned Predictions on Big Data
Wikipedia: Tuned Predictions on Big DataWikipedia: Tuned Predictions on Big Data
Wikipedia: Tuned Predictions on Big Data
 
A Hybrid Recommender with Yelp Challenge Data
A Hybrid Recommender with Yelp Challenge Data A Hybrid Recommender with Yelp Challenge Data
A Hybrid Recommender with Yelp Challenge Data
 
Kaggle Top1% Solution: Predicting Housing Prices in Moscow
Kaggle Top1% Solution: Predicting Housing Prices in Moscow Kaggle Top1% Solution: Predicting Housing Prices in Moscow
Kaggle Top1% Solution: Predicting Housing Prices in Moscow
 
Data mining with caret package
Data mining with caret packageData mining with caret package
Data mining with caret package
 
Xgboost
XgboostXgboost
Xgboost
 
Streaming Python on Hadoop
Streaming Python on HadoopStreaming Python on Hadoop
Streaming Python on Hadoop
 
Kaggle Winning Solution Xgboost algorithm -- Let us learn from its author
Kaggle Winning Solution Xgboost algorithm -- Let us learn from its authorKaggle Winning Solution Xgboost algorithm -- Let us learn from its author
Kaggle Winning Solution Xgboost algorithm -- Let us learn from its author
 
Xgboost
XgboostXgboost
Xgboost
 
Nyc open-data-2015-andvanced-sklearn-expanded
Nyc open-data-2015-andvanced-sklearn-expandedNyc open-data-2015-andvanced-sklearn-expanded
Nyc open-data-2015-andvanced-sklearn-expanded
 
Nycdsa ml conference slides march 2015
Nycdsa ml conference slides march 2015 Nycdsa ml conference slides march 2015
Nycdsa ml conference slides march 2015
 
THE HACK ON JERSEY CITY CONDO PRICES explore trends in public data
THE HACK ON JERSEY CITY CONDO PRICES explore trends in public dataTHE HACK ON JERSEY CITY CONDO PRICES explore trends in public data
THE HACK ON JERSEY CITY CONDO PRICES explore trends in public data
 
Max Kuhn's talk on R machine learning
Max Kuhn's talk on R machine learningMax Kuhn's talk on R machine learning
Max Kuhn's talk on R machine learning
 
Winning data science competitions, presented by Owen Zhang
Winning data science competitions, presented by Owen ZhangWinning data science competitions, presented by Owen Zhang
Winning data science competitions, presented by Owen Zhang
 
Using Machine Learning to aid Journalism at the New York Times
Using Machine Learning to aid Journalism at the New York TimesUsing Machine Learning to aid Journalism at the New York Times
Using Machine Learning to aid Journalism at the New York Times
 
Bayesian models in r
Bayesian models in rBayesian models in r
Bayesian models in r
 
Natural Language Processing(SupStat Inc)
Natural Language Processing(SupStat Inc)Natural Language Processing(SupStat Inc)
Natural Language Processing(SupStat Inc)
 

Recently uploaded

FIDO Alliance Osaka Seminar: Passkeys at Amazon.pdf
FIDO Alliance Osaka Seminar: Passkeys at Amazon.pdfFIDO Alliance Osaka Seminar: Passkeys at Amazon.pdf
FIDO Alliance Osaka Seminar: Passkeys at Amazon.pdf
FIDO Alliance
 
Builder.ai Founder Sachin Dev Duggal's Strategic Approach to Create an Innova...
Builder.ai Founder Sachin Dev Duggal's Strategic Approach to Create an Innova...Builder.ai Founder Sachin Dev Duggal's Strategic Approach to Create an Innova...
Builder.ai Founder Sachin Dev Duggal's Strategic Approach to Create an Innova...
Ramesh Iyer
 
Smart TV Buyer Insights Survey 2024 by 91mobiles.pdf
Smart TV Buyer Insights Survey 2024 by 91mobiles.pdfSmart TV Buyer Insights Survey 2024 by 91mobiles.pdf
Smart TV Buyer Insights Survey 2024 by 91mobiles.pdf
91mobiles
 
PCI PIN Basics Webinar from the Controlcase Team
PCI PIN Basics Webinar from the Controlcase TeamPCI PIN Basics Webinar from the Controlcase Team
PCI PIN Basics Webinar from the Controlcase Team
ControlCase
 
De-mystifying Zero to One: Design Informed Techniques for Greenfield Innovati...
De-mystifying Zero to One: Design Informed Techniques for Greenfield Innovati...De-mystifying Zero to One: Design Informed Techniques for Greenfield Innovati...
De-mystifying Zero to One: Design Informed Techniques for Greenfield Innovati...
Product School
 
Elevating Tactical DDD Patterns Through Object Calisthenics
Elevating Tactical DDD Patterns Through Object CalisthenicsElevating Tactical DDD Patterns Through Object Calisthenics
Elevating Tactical DDD Patterns Through Object Calisthenics
Dorra BARTAGUIZ
 
Designing Great Products: The Power of Design and Leadership by Chief Designe...
Designing Great Products: The Power of Design and Leadership by Chief Designe...Designing Great Products: The Power of Design and Leadership by Chief Designe...
Designing Great Products: The Power of Design and Leadership by Chief Designe...
Product School
 
UiPath Test Automation using UiPath Test Suite series, part 3
UiPath Test Automation using UiPath Test Suite series, part 3UiPath Test Automation using UiPath Test Suite series, part 3
UiPath Test Automation using UiPath Test Suite series, part 3
DianaGray10
 
FIDO Alliance Osaka Seminar: Overview.pdf
FIDO Alliance Osaka Seminar: Overview.pdfFIDO Alliance Osaka Seminar: Overview.pdf
FIDO Alliance Osaka Seminar: Overview.pdf
FIDO Alliance
 
When stars align: studies in data quality, knowledge graphs, and machine lear...
When stars align: studies in data quality, knowledge graphs, and machine lear...When stars align: studies in data quality, knowledge graphs, and machine lear...
When stars align: studies in data quality, knowledge graphs, and machine lear...
Elena Simperl
 
Unsubscribed: Combat Subscription Fatigue With a Membership Mentality by Head...
Unsubscribed: Combat Subscription Fatigue With a Membership Mentality by Head...Unsubscribed: Combat Subscription Fatigue With a Membership Mentality by Head...
Unsubscribed: Combat Subscription Fatigue With a Membership Mentality by Head...
Product School
 
State of ICS and IoT Cyber Threat Landscape Report 2024 preview
State of ICS and IoT Cyber Threat Landscape Report 2024 previewState of ICS and IoT Cyber Threat Landscape Report 2024 preview
State of ICS and IoT Cyber Threat Landscape Report 2024 preview
Prayukth K V
 
To Graph or Not to Graph Knowledge Graph Architectures and LLMs
To Graph or Not to Graph Knowledge Graph Architectures and LLMsTo Graph or Not to Graph Knowledge Graph Architectures and LLMs
To Graph or Not to Graph Knowledge Graph Architectures and LLMs
Paul Groth
 
GenAISummit 2024 May 28 Sri Ambati Keynote: AGI Belongs to The Community in O...
GenAISummit 2024 May 28 Sri Ambati Keynote: AGI Belongs to The Community in O...GenAISummit 2024 May 28 Sri Ambati Keynote: AGI Belongs to The Community in O...
GenAISummit 2024 May 28 Sri Ambati Keynote: AGI Belongs to The Community in O...
Sri Ambati
 
Epistemic Interaction - tuning interfaces to provide information for AI support
Epistemic Interaction - tuning interfaces to provide information for AI supportEpistemic Interaction - tuning interfaces to provide information for AI support
Epistemic Interaction - tuning interfaces to provide information for AI support
Alan Dix
 
Software Delivery At the Speed of AI: Inflectra Invests In AI-Powered Quality
Software Delivery At the Speed of AI: Inflectra Invests In AI-Powered QualitySoftware Delivery At the Speed of AI: Inflectra Invests In AI-Powered Quality
Software Delivery At the Speed of AI: Inflectra Invests In AI-Powered Quality
Inflectra
 
Neuro-symbolic is not enough, we need neuro-*semantic*
Neuro-symbolic is not enough, we need neuro-*semantic*Neuro-symbolic is not enough, we need neuro-*semantic*
Neuro-symbolic is not enough, we need neuro-*semantic*
Frank van Harmelen
 
GDG Cloud Southlake #33: Boule & Rebala: Effective AppSec in SDLC using Deplo...
GDG Cloud Southlake #33: Boule & Rebala: Effective AppSec in SDLC using Deplo...GDG Cloud Southlake #33: Boule & Rebala: Effective AppSec in SDLC using Deplo...
GDG Cloud Southlake #33: Boule & Rebala: Effective AppSec in SDLC using Deplo...
James Anderson
 
LF Energy Webinar: Electrical Grid Modelling and Simulation Through PowSyBl -...
LF Energy Webinar: Electrical Grid Modelling and Simulation Through PowSyBl -...LF Energy Webinar: Electrical Grid Modelling and Simulation Through PowSyBl -...
LF Energy Webinar: Electrical Grid Modelling and Simulation Through PowSyBl -...
DanBrown980551
 
The Future of Platform Engineering
The Future of Platform EngineeringThe Future of Platform Engineering
The Future of Platform Engineering
Jemma Hussein Allen
 

Recently uploaded (20)

FIDO Alliance Osaka Seminar: Passkeys at Amazon.pdf
FIDO Alliance Osaka Seminar: Passkeys at Amazon.pdfFIDO Alliance Osaka Seminar: Passkeys at Amazon.pdf
FIDO Alliance Osaka Seminar: Passkeys at Amazon.pdf
 
Builder.ai Founder Sachin Dev Duggal's Strategic Approach to Create an Innova...
Builder.ai Founder Sachin Dev Duggal's Strategic Approach to Create an Innova...Builder.ai Founder Sachin Dev Duggal's Strategic Approach to Create an Innova...
Builder.ai Founder Sachin Dev Duggal's Strategic Approach to Create an Innova...
 
Smart TV Buyer Insights Survey 2024 by 91mobiles.pdf
Smart TV Buyer Insights Survey 2024 by 91mobiles.pdfSmart TV Buyer Insights Survey 2024 by 91mobiles.pdf
Smart TV Buyer Insights Survey 2024 by 91mobiles.pdf
 
PCI PIN Basics Webinar from the Controlcase Team
PCI PIN Basics Webinar from the Controlcase TeamPCI PIN Basics Webinar from the Controlcase Team
PCI PIN Basics Webinar from the Controlcase Team
 
De-mystifying Zero to One: Design Informed Techniques for Greenfield Innovati...
De-mystifying Zero to One: Design Informed Techniques for Greenfield Innovati...De-mystifying Zero to One: Design Informed Techniques for Greenfield Innovati...
De-mystifying Zero to One: Design Informed Techniques for Greenfield Innovati...
 
Elevating Tactical DDD Patterns Through Object Calisthenics
Elevating Tactical DDD Patterns Through Object CalisthenicsElevating Tactical DDD Patterns Through Object Calisthenics
Elevating Tactical DDD Patterns Through Object Calisthenics
 
Designing Great Products: The Power of Design and Leadership by Chief Designe...
Designing Great Products: The Power of Design and Leadership by Chief Designe...Designing Great Products: The Power of Design and Leadership by Chief Designe...
Designing Great Products: The Power of Design and Leadership by Chief Designe...
 
UiPath Test Automation using UiPath Test Suite series, part 3
UiPath Test Automation using UiPath Test Suite series, part 3UiPath Test Automation using UiPath Test Suite series, part 3
UiPath Test Automation using UiPath Test Suite series, part 3
 
FIDO Alliance Osaka Seminar: Overview.pdf
FIDO Alliance Osaka Seminar: Overview.pdfFIDO Alliance Osaka Seminar: Overview.pdf
FIDO Alliance Osaka Seminar: Overview.pdf
 
When stars align: studies in data quality, knowledge graphs, and machine lear...
When stars align: studies in data quality, knowledge graphs, and machine lear...When stars align: studies in data quality, knowledge graphs, and machine lear...
When stars align: studies in data quality, knowledge graphs, and machine lear...
 
Unsubscribed: Combat Subscription Fatigue With a Membership Mentality by Head...
Unsubscribed: Combat Subscription Fatigue With a Membership Mentality by Head...Unsubscribed: Combat Subscription Fatigue With a Membership Mentality by Head...
Unsubscribed: Combat Subscription Fatigue With a Membership Mentality by Head...
 
State of ICS and IoT Cyber Threat Landscape Report 2024 preview
State of ICS and IoT Cyber Threat Landscape Report 2024 previewState of ICS and IoT Cyber Threat Landscape Report 2024 preview
State of ICS and IoT Cyber Threat Landscape Report 2024 preview
 
To Graph or Not to Graph Knowledge Graph Architectures and LLMs
To Graph or Not to Graph Knowledge Graph Architectures and LLMsTo Graph or Not to Graph Knowledge Graph Architectures and LLMs
To Graph or Not to Graph Knowledge Graph Architectures and LLMs
 
GenAISummit 2024 May 28 Sri Ambati Keynote: AGI Belongs to The Community in O...
GenAISummit 2024 May 28 Sri Ambati Keynote: AGI Belongs to The Community in O...GenAISummit 2024 May 28 Sri Ambati Keynote: AGI Belongs to The Community in O...
GenAISummit 2024 May 28 Sri Ambati Keynote: AGI Belongs to The Community in O...
 
Epistemic Interaction - tuning interfaces to provide information for AI support
Epistemic Interaction - tuning interfaces to provide information for AI supportEpistemic Interaction - tuning interfaces to provide information for AI support
Epistemic Interaction - tuning interfaces to provide information for AI support
 
Software Delivery At the Speed of AI: Inflectra Invests In AI-Powered Quality
Software Delivery At the Speed of AI: Inflectra Invests In AI-Powered QualitySoftware Delivery At the Speed of AI: Inflectra Invests In AI-Powered Quality
Software Delivery At the Speed of AI: Inflectra Invests In AI-Powered Quality
 
Neuro-symbolic is not enough, we need neuro-*semantic*
Neuro-symbolic is not enough, we need neuro-*semantic*Neuro-symbolic is not enough, we need neuro-*semantic*
Neuro-symbolic is not enough, we need neuro-*semantic*
 
GDG Cloud Southlake #33: Boule & Rebala: Effective AppSec in SDLC using Deplo...
GDG Cloud Southlake #33: Boule & Rebala: Effective AppSec in SDLC using Deplo...GDG Cloud Southlake #33: Boule & Rebala: Effective AppSec in SDLC using Deplo...
GDG Cloud Southlake #33: Boule & Rebala: Effective AppSec in SDLC using Deplo...
 
LF Energy Webinar: Electrical Grid Modelling and Simulation Through PowSyBl -...
LF Energy Webinar: Electrical Grid Modelling and Simulation Through PowSyBl -...LF Energy Webinar: Electrical Grid Modelling and Simulation Through PowSyBl -...
LF Energy Webinar: Electrical Grid Modelling and Simulation Through PowSyBl -...
 
The Future of Platform Engineering
The Future of Platform EngineeringThe Future of Platform Engineering
The Future of Platform Engineering
 

Supstat nyc subway

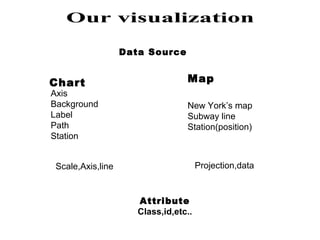
  • 1. Data Source Chart Axis Background Label Path Station Map New York’s map Subway line Station(position) Projection,data Scale,Axis,line Attribute Class,id,etc..
  • 2. subway line New York city subway_inequality_live (excel from google doc) topojson drawChart([json]); tabletop
  • 3. <script type="text/javascript" src="tabletop.js"></script> <script src="topojson.v0.min.js"></script> var sourceData; window.onload = function() { init() }; var url = 'https://docs.google.com/spreadsheet/pub? key=0ApL2ZVhpOmONdFdTUWhxV252elNORVNqT0g5Y0NzV1E&outp ut=html'; function init() { Tabletop.init( { key: url, callback: show, simpleSheet: true } ); } function show(data) { sourceData = data; drawChart();
  • 5. create map var projection = d3.geo.mercator() .center([-73.955, 40.678) .translate([w/2, h/2]) .scale([34000]); var path = d3.geo.path() .projection(projection); var g = svg.append("g") .attr("class", "borough_lines");
  • 6. create map var w = 400; var h = 400; var svg = d3.select("#map") .append("svg") .attr("width", w) .attr("height", h);
  • 8. create map var g1 = svg.append("g") .attr("class", "map_lines"); g1.selectAll("path.map_line") .data(topojson.object(subway_lines[0], subway_lines[0].objects.subways).geometries) .enter() .append("path") .attr("d", path) .attr("class", function(d){ return "map_line l_" + d.properties.route_id }) .style("fill", "white") .style("fill-opacity", 0) .style("opacity", .5) .style("stroke-width", 3) .style("stroke-linecap", "round");
  • 9. create map svg.selectAll("circle.map_circle") .data(sourceData) .enter() .append("circle") .attr("cx", function(d){//transform position return projection([d.long, d.lat])[0]; }) .attr("cy", function(d){ return projection([d.long, d.lat])[1]; }) .attr("r", 4) .attr("id", function(d){ return "t_" + d.county + "_" + d.tract }) .attr("opacity", 0); point marker : t_61_24302 hidden
  • 12. var containerSize = { width : 900, height : 400 }, create chart margins = {top : 20,right : 20,bottom : 30,left : 118}, chartSize = { width : containerSize.width - margins.left - margins.right - 20, height : containerSize.height - margins.top - margins.bottom }; var chart = d3.select("#graphic") .append("svg") .attr("width", containerSize.width) .attr("height", containerSize.height) .append("g") .attr("transform", "translate(" + margins.left + "," + margins.top + ")") .attr("id","chart");
  • 13. X position,50px Y position,0px 100px Data: [{x:5},{y:0}] What is scale? var test_scale = d3.scale.linear() .range([0,100) .domain([0, 10]); test_scale(5)? Get 50px Test_scale(0)? Get 0 px X: test_scale
  • 14. Make the scale var stop_scale = d3.scale.linear() .range([0,chartSize.width]) .domain([1, 49]); X: stop_scale Y: incomeScale var incomeScale = d3.scale.linear() //data range .range([chartSize.height, 0]) .domain([0,230000]); //income axis, max230000
  • 15. Make the axis convert function formatNum(d){ return d.toString().replace(/(?=(?!b)(?:d{3})+(?!d))/g, ',') } 10000 to 10,000 var stop_axis = d3.svg.axis() .scale(stop_scale); var incomeAxis = d3.svg.axis() .scale(incomeScale) .orient("left") .tickValues([0, 50000, 100000, 150000, 200000])//tick .tickSize(-chartSize.width, 0) .tickPadding(20) .tickFormat(function(d) { return "$" + formatNum(d); }); //format number
  • 16. create line g.selectAll("circle") .data(sourceData) .enter() .append("circle"); window ['lineBox'] = g //dispose var line2011Path = d3.svg.line() .x(function(d){return stop_scale(d.position)}) .y(function(d){return incomeScale(d.income2011)}) .interpolate("cardinal");
  • 17. d3.select("#chart") .append("g") .attr("id", "areaBox"); Make the chart chart.append("g") .attr("class", "y axis") .call(incomeAxis); d3.select(".y.axis") .append("text") .attr("text-anchor","middle") .text("median household income") .attr("transform", "rotate (270, 0, 0)") .attr("x", -180) .attr("y", -110); var g = d3.select("#chart") .append("g") .attr("id","line_path_2011"; g.append("path");
  • 18. Whole data Trigger by Button brushed data By “id” map chart Hide all line ShowLine (id) Hide all points Matching path Transition path (id) Show related points (brushed data)
  • 19. Class: line l_1 <div class="line l_1">1</div> <div class="line l_2">2</div> <div class="line l_3">3</div> <div class="line l_4">4</div> <div class="line l_5">5</div> <div class="line l_6">6</div> <div class="line l_7">7</div> .... .. <div class="line l_J">J</div> <div class="line l_Z">Z</div> <div class="line l_G">G</div> <div class="line l_L">L</div> <div class="line l_SIR">SIR</div> Create button
  • 20. use css to color the line .l_123, .l_1, .l_2, .l_3 { background-color: #FF3535; stroke: #FF3535;} .l_456, .l_4, .l_5, .l_6 { background-color: #019733; stroke: #019733;} .l_7 { background-color: #CC02C8; stroke: #CC02C8;} .l_ace, .l_A, .l_C, .l_E { background-color: #0F6797; stroke: #0F6797;} .l_bdfm, .l_B, .l_D, .l_F, .l_M { background-color: #FF9800; stroke: #FF9800;} .l_nqr, .l_N, .l_Q, .l_R { background-color: #ffe400; stroke: #ffe400;} .l_SIR { background-color: #164480; stroke: #164480;} .l_jz, .l_J, .l_Z { background-color: #986701; stroke: #986701;} .l_L, .l_l { background-color: #999999; stroke: #999999;} .l_G, .l_g { background-color: #9BCF00; stroke: #9BCF00;}
  • 21. Make the transition function drawLine(filteredData, id){ d3.selectAll(".line") .on(“click”, brushData) function brushData(){ id = d3.select(this).text(); filteredData = sourceData.filter(function(d){return d.line === id}); drawLine(filteredData, id); … Draw chart line(l_+id) … Draw subway (l_+id) … Show circles(filteredData) }
  • 22. function drawLine(filteredData, id){ Draw chart line(l_+id) Draw subway (l_+id) Show circles(filteredData) } Show circles(filteredData) d3.selectAll("circle") .transition() .duration(500) .attr("r", 0);//minimize all circle window['lineBox'].selectAll("circle") .data(filteredData) .transition() .duration(1000) .attr("r", 4) .attr("class", function(d) {return "t_" + d.county + "_" + d.tract }) .attr("cx", function(d) {return stop_scale(d.position)}) .attr("cy", function(d) {return incomeScale(d.income2011)});
  • 23. function drawLine(filteredData, id){ Draw chart line(l_+id) Draw subway (l_+id) Show circles(filteredData) } Draw chart line(l_+id) d3.select("#line_path_2011 path") .attr("class", "graph_line l_" + id .transition() .duration(1000) .attr("d", line2011Path(filteredData) var line2011Path = d3.svg.line() .x(function(d){return stop_scale(d.position)}) .y(function(d){return incomeScale(d.income2011)}) .interpolate("cardinal");
  • 24. function drawLine(filteredData, id){ Draw chart line(l_+id) Draw subway (l_+id) Show circles(filteredData) } Draw subway (l_+id) //hideall d3.selectAll(".map_line") .transition() .duration(500) .style("opacity", 0); //show d3.selectAll(".map_line.l_" + id) .transition() .duration(500) .style("opacity", 1); d3.selectAll(".line") .classed("selected", false); d3.select(".line.l_" + id) .classed("selected", true);
  • 25. Create info box <div id="tooltip" class=""> <div class="line l_F ">F</div> <div id="stop-name"> <span id="name">East Broadway</span> </div> <div class="label-wrap"> <div class="label-number" id="income2011">$86,806</div> <div class="label">2011 median household income in census tract <span id="census">001401</span></div> </div> </div>
  • 26. Define point activity //hover overs/interactions d3.selectAll("circle") .on("mouseover", function(d) { //Show tooltip(mouse position) //Bigger the point on chart //Insert content //Show the point on map }) .on("mouseout", function() { //hide tooltip //Smaller the point });
  • 27. d3.select(this) .transition() Bigger the point on chart .attr("r", 8); d3.select("#tooltip") .style("left", (d3.event.pageX) + 20 + "px") .style("top", (d3.event.pageY) - 30 + "px").transition() Show tooltip .style("opacity", 1); d3.select('#stop-name #name') .text(d.stopname) d3.select('#tooltip .line') .text(id) .attr("class", "line l_" + id, true) Fill the content d3.select('#income2011') .text("$" + formatNum(d.income2011)); d3.select('#census') .text(d.tractlookup); d3.select("circle#" + this.className.animVal) .transition() .duration(500) .attr("opacity", 1) .attr("r", 5); Show point on map
  • 28. //Hide the tooltip d3.select("#tooltip") .transition() .style("opacity", 0); d3.select(this) .transition() .attr("r", 4); d3.selectAll("#map circle") .transition() .duration(500) .attr("opacity", 0); Hide tooltip Smaller point on chart Hide point on map
  • 29. Start:where we can draw the next county Cut the county County:id Span: how many points
  • 30. Whole data Memo:[] Match the line “id” Filtered data Reduce data County change? yes Push new county data(start,span,county ) no Span++
  • 31. Filter data Boroughs = filteredData.reduce( function (memo, stop, i) { var len = memo.length; if (len == 0 || (memo[len - 1].county != stop.county)) { memo.push({ county : stop.county, start : i + 1, span : 1 }); } else { memo[len - 1].span++; } [{"county":"47","start":1,"span":19}, return memo; {"county":"61","start":20,"span":15}] }, [])
  • 32. Draw county var gCounties = d3.select("#areaBox") .selectAll('g.borough') .data(boroughs).enter() .append('g') .attr('class', 'borough') .attr('transform', function (d) return 'translate(' + stop_scale(d.start) + });
  • 33. Add label gCounties.append('rect') .attr('x', -5) .attr('width', function (d) { return stop_scale(d.span + .8) }) .attr('height', chartSize.height); gCounties.append('text') .attr("y", 15) .text(function (d) { if (d.county == "5") { return "BRX" } else if (d.county == "61") { return "MAN" } else if (d.county == "81") { return "QNS" } else if (d.county == "47") { return "BRK" }; });