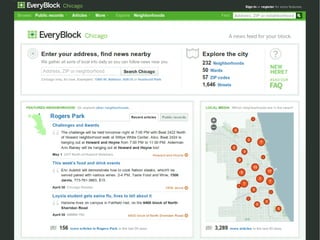
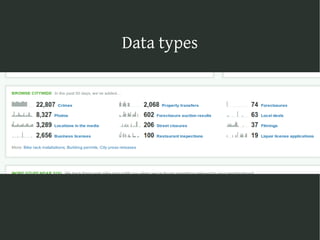
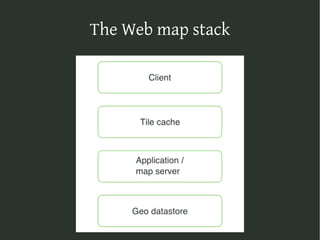
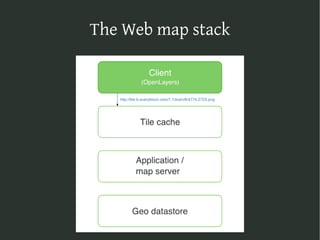
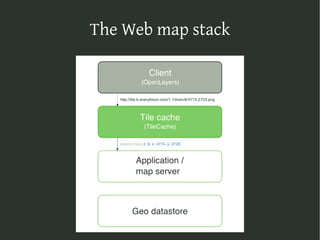
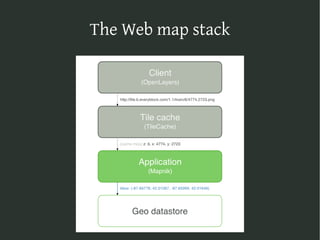
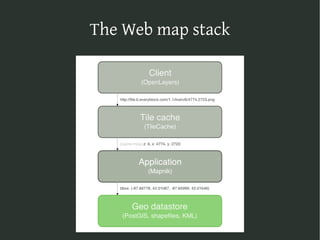
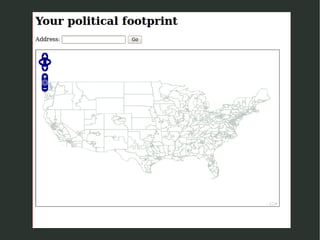
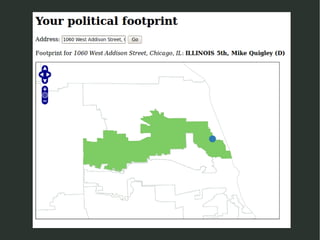
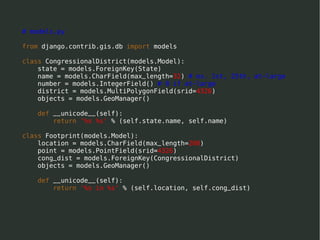
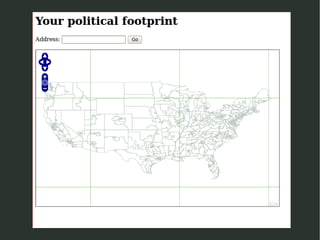
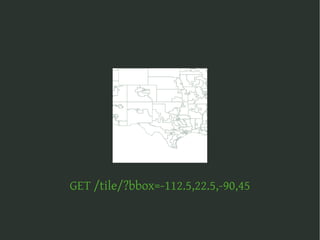
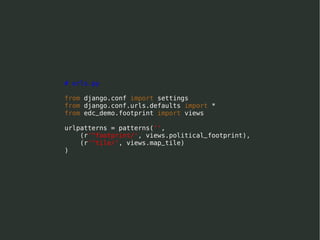
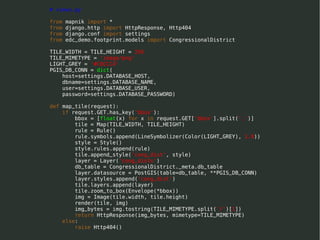
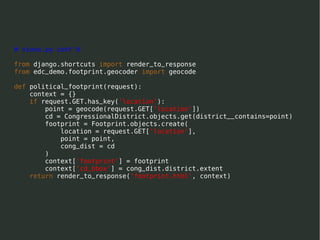
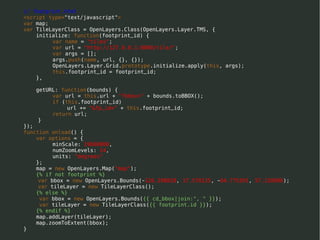
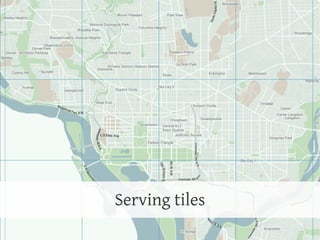
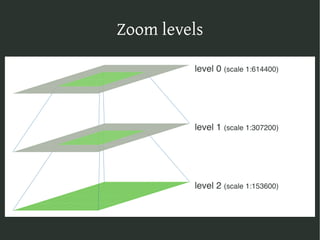
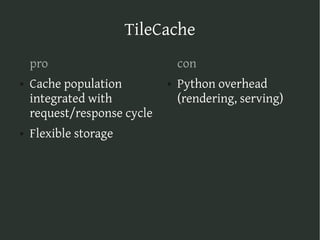
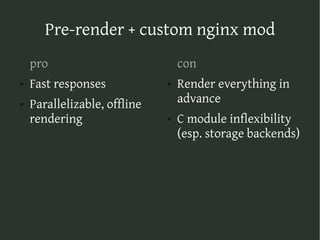
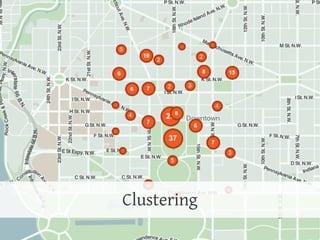
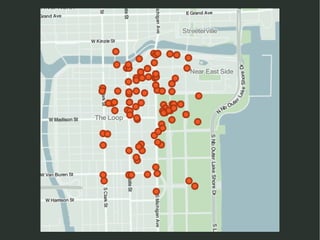
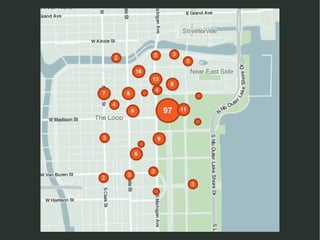
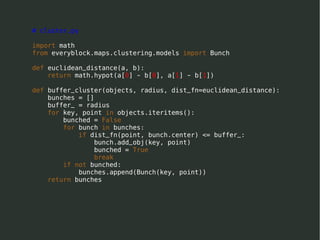
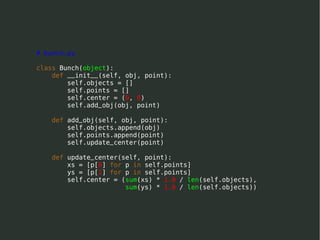
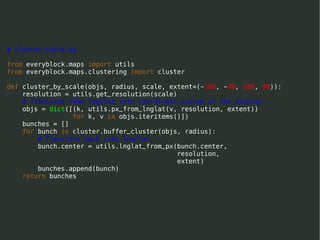
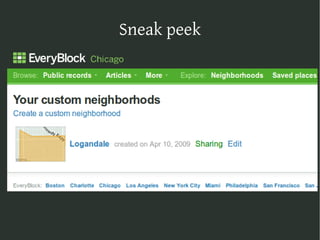
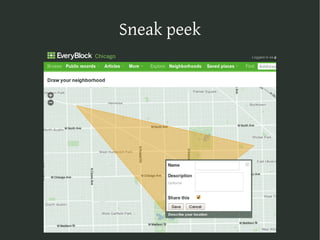
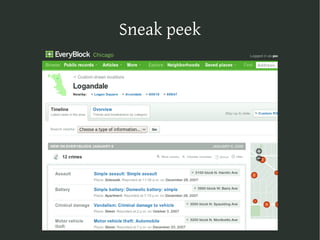
The document discusses the web mapping stack in Django. It provides an example application called "Your Political Footprint" that allows users to geocode an address and see the congressional district. It describes using GeoDjango with PostGIS to store spatial data and Mapnik to render map tiles. It also covers tile caching with TileCache or pre-rendering tiles and serving them with Nginx. Clustering algorithms are presented to group points on a map.
Integration of Google-map in Rails ApplicationSwati Jadhav
This document discusses how to integrate Google Maps into a Rails application using the Gmap4rails gem. It covers adding maps and markers to models and controllers, configuring map options like zoom level and clustering, and addressing issues like full zoom-out for single pins or displaying multiple locations. The gem provides features like markers, circles, polygons, clustering, and customizing marker windows. Models need latitude, longitude, and an address method, and controllers generate JSON for markers.
This document discusses geographic information systems (GIS) and how to work with geospatial data using Python and related tools. It introduces common geospatial data formats like KML, GML, and GeoJSON. It also discusses storing geospatial data in spatial databases like PostGIS. The document then covers how to obtain open geospatial data from OpenStreetMap and load it into a database. It demonstrates rendering geospatial data to maps using the Mapnik library and Python. Finally, it briefly discusses tile-based map services and front-end mapping libraries like OpenLayers that can display rendered geospatial data on web maps.
Getting Oriented with MapKit: Everything you need to get started with the new...John Wilker
New in 3.0 Map Kit works with the Google Mobile Maps Service and features panning and zooming, custom annotations, current location and geocoding. This new framework opens up many new possibilities programs not previously possible. Come learn everything you need to know to get started as well as some tips and tricks to speed your programming along.
The document provides an overview of the Google Maps API version 3. It introduces the API and covers topics like creating a basic map, adding markers, info windows, polylines and polygons. It also discusses customizing maps with options, dealing with large numbers of markers, and location data. The document is a tutorial that guides developers through building maps with various features using the Google Maps API.
The document provides an overview of HTML5 Canvas:
- Canvas is a 2D drawing platform that uses JavaScript and HTML without plugins, originally created by Apple and now developed as a W3C specification.
- Unlike SVG which uses separate DOM objects, Canvas is bitmap-based where everything is drawn as a single flat picture.
- The document outlines how to get started with Canvas including setting dimensions, accessing the 2D rendering context, and using methods to draw basic and complex shapes with paths, text, and images.
- It discusses using Canvas for animation, interactions, and pixel manipulation, and its potential to replace Flash in the future.
The HTML5 canvas element allows drawing directly onto the page via JavaScript. It provides pixel-level control for creating animations, games, charts, and more. The canvas is drawn upon by using a drawing context object and its methods like fillRect(), stroke(), arc(), and fillText(). Gradients, patterns, and images can also be rendered onto the canvas to create advanced graphics.
This document is a screenshot of an online map that allows users to view satellite images and add locations and categories. The map displays tools to measure distances, edit maps, add places, and select from various categories to tag locations. In the top left, users can translate the interface into different languages and access additional tools, help documents, and a forum.
This document discusses simulation methods for analyzing slot machine payout data. It includes sections on the mathematical approach, homework assignments, and feedback. Students are asked to write functions to simulate random slot machine draws, calculate payouts from multiple draws, and explore the distribution of mean payouts from increasing numbers of draws. The document suggests moving from simulation to calculating the expected value and variance of payouts mathematically.
A university lecture for journalism students -- how to use the canvas element to add graphics and animation to Web pages. Updated April 2014. Basics for beginners. See also https://github.com/macloo/canvas
This document provides information on using Google Maps and Charts APIs. It includes code snippets for initializing a map, adding markers to a map with location data from an XML file, getting directions, and creating pie and column charts with JavaScript and the Google Visualization API. Code examples demonstrate functions for maps like addOverlay, createMarker, and openInfoWindowHtml and initializing charts with data.
- HTML5 Canvas allows for dynamic drawing and animating directly in HTML using JavaScript scripting. It can be used to draw shapes, images, text and respond to user input like mouse clicks.
- The canvas element creates a grid that allows positioning images and objects by x and y coordinates. Basic drawing functions include lines, rectangles, curves and filling areas with colors.
- Transformations like translation and rotation can change the orientation of drawings on the canvas. The drawing state can be saved and restored to return to previous settings.
- Images can be drawn and manipulated at the pixel level by accessing image data. Animation is achieved by redrawing the canvas repeatedly with small changes.
- Data from sources like JSON can be
The document provides an overview of using the HTML5 canvas element to draw graphics and animations. It covers topics like rendering contexts, paths, styles, gradients, text, shapes, mouse/touch interaction, animation, and libraries. Code examples demonstrate how to draw basic shapes, handle user input, interpolate lines, add gradients, render to canvas, and more. The document is a tutorial for learning the capabilities of the canvas element.
This document provides information on using the Google Maps JavaScript API, including:
- The API is available free with usage limits or as a paid service. An API key is required.
- Basic HTML is shown to load the Google Maps script and initialize a map on a page.
- Default user interface elements like zoom controls can be configured or disabled. Custom buttons can be added.
- Markers can be placed on the map and configured with info windows, animations, and custom icons.
- Shapes like polylines and circles can be drawn on the map.
- Services provide capabilities like geocoding addresses and locations, directions, and accessing Fusion Tables data.
The document discusses APIs for working with maps and location in iOS apps. It provides examples of how to use the MapKit API to display maps, add pins to locations, and set regions. It also demonstrates using the Core Location API to get the device's current location via GPS, Wi-Fi or cellular data and print the latitude and longitude coordinates. Code snippets are given to import MapKit, create a map view, set the initial region, add annotations for pins, and implement the location manager delegate to handle location updates.
Having fun with graphs, a short introduction to D3.jsMichael Hackstein
This talk is all about drawing on your webpage. We will have a short introduction to d3.js, a library to easily create SVGs in your webpage. Along the way we will render graphs using different layouting strategies. But what are the problems when displaying a graph? Just think of graphs having more vertices then you have pixels on your screen. Or what if you want a user to manupilate the graph and his changes being persistent? Michael will present his answers to this questions, ending up wit a GUI for a graph database.
The document provides information about using geocoding services in Rails applications. It discusses what geocoding is, examples of geocoding addresses to get latitude and longitude coordinates, complications that can arise with geocoding, and several geocoding services including Google Maps, Yahoo Maps, and Geocoder.us. It also covers calling geocoding APIs using REST, parsing XML responses, and automatically geocoding model addresses in Rails.
This document provides an overview of mapping tools and techniques for sustainability projects. It discusses using Google Maps, Google Earth, and KML to map points, lines, polygons, images and other data types. It also covers embedding maps, working with large datasets, and examples of sustainability mapping projects.
This document provides an overview of geolocation and mapping using Google Maps services. It defines geolocation as identifying the real-world location of an object like a mobile phone or computer. Mapping refers to map-making and cartography. The document reviews the navigator.geolocation API for accessing location data, the Google Maps Javascript API for embedding maps, and common overlays like markers and polylines that can be added to maps. It also summarizes services for obtaining directions and distance matrix information between locations.
This document provides tips and tricks for using the Canvas API, with a focus on game programming and bitmaps. It discusses setting up an animation loop using requestAnimationFrame, caching techniques like double buffering to improve performance, and manipulating pixel data directly using ImageData to implement features like hit detection and image filters. The document encourages profiling code and considers challenges in testing Canvas code.
This document summarizes MongoDB's geospatial features including 2d and 2dsphere indexing, GeoJSON support for lines and polygons, and geospatial aggregation. It provides examples of querying points and geometries within regions, near points, and intersecting geometries. Future plans include additional geospatial predicates and indexing composite shapes.
This document contains graphics and audio settings for a player's game account, including preferences for quality levels, resolutions, volumes, and other options. Values are provided for graphics settings like effects detail, lighting quality, and texture quality, as well as audio settings like master volume and music volume. Additional settings cover physics, particles, shadows, textures, and other technical features in the game.
Machine Tags allow users to describe custom properties and relate online resources using a syntax based on subject-predicate-object triples, enabling uses like geotagging photos, field-based search, and linking to semantic web data. However, Machine Tags have limitations in expressing complex object values and semantic relationships. The document discusses how the software gnizr implements Machine Tag support by detecting tags, looking up locations in an external database, and notifying listeners to process and store the tag information.
The document provides 5 tips for optimizing HTML5 game performance:
1. Use frame buffering to avoid screen flickering by drawing to an off-screen canvas before copying to the visible one
2. You don't always need a game loop which can be expensive; consider alternatives for simple games
3. Drawing operations like getImageData and putImageData are expensive so use them sparingly
4. Large fill operations are costly compared to smaller ones or plain colors
5. Consider using multiple smaller canvases instead of one large one to split work across frames
Let's take a look at the HTML5 element canvas. See how you can draw shapes and images, manipulate single pixels and even animate it. Given as a lecture in the fh ooe in Hagenberg, Austria in December 2011.
Architecture at SimpleGeo: Staying Agile at ScaleMike Malone
As an infrastructure services company, it's critical that our systems stay fast and robust at scale. As a startup, we're keen to keep costs down and returns high, and as a young company agility is doubly important. This presentation covers some of the architectural tenets that shape our systems to accomplish these goals at SimpleGeo, and lessons learned along the way.
This document provides an overview of patterns for scalability, availability, and stability in distributed systems. It discusses general recommendations like immutability and referential transparency. It covers scalability trade-offs around performance vs scalability, latency vs throughput, and availability vs consistency. It then describes various patterns for scalability including managing state through partitioning, caching, sharding databases, and using distributed caching. It also covers patterns for managing behavior through event-driven architecture, compute grids, load balancing, and parallel computing. Availability patterns like fail-over, replication, and fault tolerance are discussed. The document provides examples of popular technologies that implement many of these patterns.
1) The document discusses opportunity mapping research conducted in Massachusetts to analyze spatial access to opportunity.
2) The research found that people of color, immigrants, and low-income individuals are disproportionately concentrated in low-opportunity neighborhoods with poor education, economic prospects, health outcomes and other disadvantages.
3) In contrast, white and higher income individuals were more likely to live in high-opportunity neighborhoods, concentrating racial inequity into specific geographic areas and systems of disadvantage.
Django web framework ships with very powerful admin interface for site managers. Default interface is generated from model's metadata and can be customized using many hooks. This presentation is about customizing and making admin interface faster and more user friendly.
The document discusses Django, a Python web framework. It covers diving into backend architecture, Django basics including project structure and MVC patterns, the Django REST framework for APIs, and steps to create a simple Django app including installing Python/pip and Django then running the development server.
This is the slides I used when I shared my humble insight on Django to the students in University of Taipei in 2016. Please feel free to correct me if there is anything wrong.
This document contains Simon Willison's heresies about Django. Some of the heresies discussed include that the {% if %} tags in Django templates suck, that silencing template errors is a bad idea, and that settings.py causes problems. Alternatives proposed include using a smarter {% if %} tag snippet, not silencing errors, and allowing per-application settings instead of one global settings file. The document also advocates for improving testing and documentation in the Django community.
This document discusses integrating Django, Django Rest Framework, React, Redux, and related technologies. It recommends using Webpack to bundle JavaScript assets. It provides code examples for defining React components, Redux reducers, and connecting a React frontend to a Django Rest Framework backend via API calls. The document emphasizes building reusable presentational and container components, and wiring actions and reducers to the backend via Redux middleware like redux-promise.
The Python Sevilla meeting of March took place last Wednesday. The talk was given by Pablo Iglesias (Pablo is the Senior Django developer for Emergya in the BeDjango team). During this talk he explained what we know at BedDjango as a “Starter” and some of its characteristics
Must Know Google Map Features for your Web applicationAppsbee
To get the best out of any web application every entrepreneur seeks all the know-how about Google Map API features. This presentation focuses over all those parts and makes one enable to develop a robust application using Google map features and add-on.
Order Out of Chaos - The Designs of Donna KaranGraspingfish
Donna Karan's creative process can be summarized as follows:
1) Karan is inspired by the constant state of chaos in her life that drives her to create new fashion designs.
2) Her designs emerge through a complex dynamical system where inspiration flows into her work like an energy flux undergoing a phase transition, becoming organized by a "strange attractor" into new patterns.
3) Karan sees fashion as a canvas for empowering women, drawing from both Eastern and Western influences in an ongoing process of exploration and renewal.
Free-spirited fashion designer Asmita Marwa owns a store in Goa but had to shut it down due to an unsatisfactory location. She intends to reopen in Goa, which she frequents regularly and feels has a soul that draws people to it. During an interview, Asmita discusses her journey as a designer, starting her own label in 2003 and debuting at Lakme Fashion Week in 2008. She creates bohemian, free-flowing designs inspired by her travels around the world and experiences with artists. Asmita balances her work with being a homemaker and part-time chef when not traveling or creating new collections.
Enrique Iglesias was born in 1975 to famous singer Julio Iglesias and Filipina journalist Isabel Preysler. He was sent to Miami for safety after his grandfather was kidnapped. Iglesias has sold over 58 million albums worldwide and holds the record with 21 number #1 songs on the Billboard Hot 100 charts, making him the most successful artist in chart history.
This very short document does not contain enough substantive information to summarize in 3 sentences or less. It only contains the phrase "This is what so ever" without any other context or details.
The document describes how to create an interactive visualization showing subway lines and median household income data on a map of New York City. It involves loading data from Google sheets, creating scales and axes, drawing the subway lines and income data as paths on a map, and adding interactivity through hovering and clicking on points. Key elements include filtering the data by subway line, drawing the corresponding path on the chart and highlighting the matching line on the map, and aggregating data by borough to add labeled regions to the chart.
The document discusses the Dojo JavaScript toolkit. It provides an overview of what Dojo is, including that it is a lightweight JavaScript toolkit with modular components for tasks like charts, calendars, file uploads and more. It also discusses Dojo's build system for concatenating and minifying files, its module loading system, and patterns used like ambiguous constructors, chaining and deferreds. The document promotes Dojo's large developer community and active development.
This document provides an overview of a presentation on using D3 for data visualization on desktops, smartphones, and Google Glass. It discusses how D3 works, examples of basic charts like scatter plots and bar charts using D3, and how to incorporate features like mouse interactions, animations, filters and gradients. It also covers using D3 with technologies like Android, PhoneGap, and Google Glass to create mobile visualizations.
This document provides an overview of a presentation on using D3 for data visualization on desktops, smartphones, and Google Glass. It discusses topics like what D3 is, how it works, examples of creating simple charts and adding interactivity with mouse events, using SVG filters and gradients, and integrating D3 visualizations into Android and Google Glass apps. It also briefly mentions related technologies, resources for learning more, and potential training topics.
ES6 is Nigh is a presentation on the future of JavaScript. It discusses the history of JavaScript and why ES6 is important for advancing the language. The presentation outlines many new features being added in ES6, such as arrow functions, classes, modules, template strings, symbols, generators, and proxies. It emphasizes that ES6 is purely additive and introduces these features without breaking backwards compatibility.
This document describes ggTimeSeries, an R package that provides extensions to ggplot2 for creating time series plots. It includes examples of using functions from ggTimeSeries to create calendar heatmaps, horizon graphs, steam graphs, and marimekko plots from time series data. The examples demonstrate how to generate sample time series data, create basic plots, and add formatting customizations.
State of the Art Web Mapping with Open SourceOSCON Byrum
This document discusses the importance of open source tools and data for web mapping. It begins by providing background on TileMill and Mapbox, which provide open source tools for making maps. It then discusses key concepts in web mapping like geospatial data formats, tile rendering, and minimal code examples. Modern approaches to web mapping involve preprocessing data, using tile renderers and caches, and gradually rendering more client-side. Upcoming improvements may optimize tiled formats and storage. TileMill is demonstrated as an open source tool for making maps. The talk concludes by emphasizing other open mapping tools like CartoDB, Stamen, and CartoDB that build on these concepts.
This document provides an overview of HTML5 and CSS3 features. It discusses the evolution of browsers and web applications. Key HTML5 features covered include client-side storage, offline capabilities, 2D graphics using canvas and SVG, audio/video playback, geolocation, and forms. New CSS3 features and JavaScript APIs related to these HTML5 technologies are also summarized.
- JavaScript has come a long way from its early days of form validation and image rollovers in 1995 to modern innovations like ES2015, Promises, async/await, and Web Assembly.
- Today, JavaScript features like classes, arrow functions, and template strings in ES2015 are widely adopted, and new standards like Promises, generators, and async programming have revolutionized asynchronous JavaScript.
- Emerging web platform technologies like Web Components, Service Workers, and CSS Paint enable new kinds of custom elements, offline/progressive web apps, and painting APIs, while proposals like decorators, value types, and module loading continue pushing the language forward.
Visual Exploration of Large Data sets with D3, crossfilter and dc.jsFlorian Georg
My talk at this year's Jazoon about data visualization and exploration with D3, crossfilter and dc.js
It should give you a good introduction on how/when to use these frameworks and how they relate to each other.
More info on http://datavisual.mybluemix.net
This document discusses using the C to Go translation tool c2go to translate C code implementing quicksort algorithms into Go code. It provides examples of translating simple quicksort C code, improving the translation by using a configuration file, and how c2go handles standard C functions like qsort by translating them to their Go equivalents. The examples demonstrate how c2go can generate valid Go code from C code but may require some manual fixes or configuration to handle certain data structures or language differences.
This document contains code for a web application that serves geographic vector data stored in a Postgres database. It includes code to:
1) Connect to a Postgres database and import vector data from a shapefile into a table with a geometry column.
2) Define routes in a Sinatra application to serve pre-rendered web pages with the vector data visualized using SVG and embedded in HTML.
3) Include JavaScript code to pan and zoom the vector data visualization in the browser.
This document provides an overview of functional programming using Underscore.js and Lo-Dash. It discusses key concepts of functional programming like pure functions, first class functions, and higher order functions. It then explains how Underscore.js and Lo-Dash support functional programming in JavaScript with functions like compose, map, reduce, filter, and utilities to work with functions as first class citizens. The document compares Underscore.js and Lo-Dash, noting Lo-Dash's better performance, larger feature set, and utilities like partial and result. It emphasizes applying functional concepts judiciously for benefits while avoiding rewriting all code to be purely functional.
This document provides an overview of HTML5 and its capabilities for building interactive web applications. It discusses the history and development of HTML5, including the roles of the WHATWG and W3C. It also summarizes key HTML5 features such as JavaScript, Canvas, WebSockets, storage options, and emerging 3D capabilities. Throughout, it provides examples of how these features can be used to create games, multimedia experiences, and real-time applications on the modern web.
When I first started out with D3.js 2 years ago, I built things the same way, customising examples and although worked, I was never proud of my code. The chaining of methods makes the graphs concise, but costs a lot in cognitive overload and maintainability. Building this way is painful to modify, reuse or even to understand once you sit back down after lunch!
I had a huge revelation when I discovered the Reusable API (a modular structure to create and reuse d3 elements) and my code was elevated to even higher levels with Test Driven Development.
In this session I'll walk you through my journey toward beautiful, maintainable D3 graphs with step by step examples of refactoring crufty code to be shiny and new and testable.
By the end of the talk you too will know how to build decoupled, composable, encapsulated and consistent D3 graphs and be proud of your code again!
R is an open source statistical computing platform that is rapidly growing in popularity within academia. It allows for statistical analysis and data visualization. The document provides an introduction to basic R functions and syntax for assigning values, working with data frames, filtering data, plotting, and connecting to databases. More advanced techniques demonstrated include decision trees, random forests, and other data mining algorithms.
Part presentation, part debate about the future of the language while touching base on the current state of the industry with respect to ES6/ES2015, and the possibilities of using it today in web applications and frameworks, the different options, and the things to keep in mind. Additionally, we will do a walk-through on the new features included in ES7/ES2016 draft, and those that are being discussed for ES8/ES2017.
Tom Colley - QGIS Print Composer & Advanced Atlas ProductionShaun Lewis
This document discusses advanced atlas map production techniques in QGIS, including:
- Using data defined overrides to customize atlas outputs
- Creating atlases from memory layers or CSV files
- Adding dynamic page items like system and atlas variables to labels
- Filtering atlas features to only include those covered by relevant background maps
- Calculating or labeling adjacent atlas tile references by writing custom functions or rule-based styling
The document provides code examples and discusses pros and cons of different approaches.
"It's all about simplicity": perchè le applicazioni basate su Javascript sono spesso complesse, farraginose e difficilmente manutenibili quando è possibile renderle semplici, eleganti e funzionali?
In questa sessione a quattro mani vedremo per prima cosa come sfruttare Javascript al meglio, utilizzando i prototipi, i namespaces, gli oggetti, gli eventi, le chiusure e le altre mille funzionalità di un linguaggio di programmazione troppo spesso sottovalutato.
Ci soffermeremo poi su jQuery per analizzare il suo contributo nel semplificare task normalmente tediosi come la manipolazione del DOM, la gestione degli eventi, la programmazione asincrona (AJAX) e le problematiche di compatibilità cross-browser.
GraphSummit Singapore | The Future of Agility: Supercharging Digital Transfor...Neo4j
Leonard Jayamohan, Partner & Generative AI Lead, Deloitte
This keynote will reveal how Deloitte leverages Neo4j’s graph power for groundbreaking digital twin solutions, achieving a staggering 100x performance boost. Discover the essential role knowledge graphs play in successful generative AI implementations. Plus, get an exclusive look at an innovative Neo4j + Generative AI solution Deloitte is developing in-house.
Climate Impact of Software Testing at Nordic Testing DaysKari Kakkonen
My slides at Nordic Testing Days 6.6.2024
Climate impact / sustainability of software testing discussed on the talk. ICT and testing must carry their part of global responsibility to help with the climat warming. We can minimize the carbon footprint but we can also have a carbon handprint, a positive impact on the climate. Quality characteristics can be added with sustainability, and then measured continuously. Test environments can be used less, and in smaller scale and on demand. Test techniques can be used in optimizing or minimizing number of tests. Test automation can be used to speed up testing.
Essentials of Automations: The Art of Triggers and Actions in FMESafe Software
In this second installment of our Essentials of Automations webinar series, we’ll explore the landscape of triggers and actions, guiding you through the nuances of authoring and adapting workspaces for seamless automations. Gain an understanding of the full spectrum of triggers and actions available in FME, empowering you to enhance your workspaces for efficient automation.
We’ll kick things off by showcasing the most commonly used event-based triggers, introducing you to various automation workflows like manual triggers, schedules, directory watchers, and more. Plus, see how these elements play out in real scenarios.
Whether you’re tweaking your current setup or building from the ground up, this session will arm you with the tools and insights needed to transform your FME usage into a powerhouse of productivity. Join us to discover effective strategies that simplify complex processes, enhancing your productivity and transforming your data management practices with FME. Let’s turn complexity into clarity and make your workspaces work wonders!
For the full video of this presentation, please visit: https://www.edge-ai-vision.com/2024/06/building-and-scaling-ai-applications-with-the-nx-ai-manager-a-presentation-from-network-optix/
Robin van Emden, Senior Director of Data Science at Network Optix, presents the “Building and Scaling AI Applications with the Nx AI Manager,” tutorial at the May 2024 Embedded Vision Summit.
In this presentation, van Emden covers the basics of scaling edge AI solutions using the Nx tool kit. He emphasizes the process of developing AI models and deploying them globally. He also showcases the conversion of AI models and the creation of effective edge AI pipelines, with a focus on pre-processing, model conversion, selecting the appropriate inference engine for the target hardware and post-processing.
van Emden shows how Nx can simplify the developer’s life and facilitate a rapid transition from concept to production-ready applications.He provides valuable insights into developing scalable and efficient edge AI solutions, with a strong focus on practical implementation.
Let's Integrate MuleSoft RPA, COMPOSER, APM with AWS IDP along with Slackshyamraj55
Discover the seamless integration of RPA (Robotic Process Automation), COMPOSER, and APM with AWS IDP enhanced with Slack notifications. Explore how these technologies converge to streamline workflows, optimize performance, and ensure secure access, all while leveraging the power of AWS IDP and real-time communication via Slack notifications.
Sudheer Mechineni, Head of Application Frameworks, Standard Chartered Bank
Discover how Standard Chartered Bank harnessed the power of Neo4j to transform complex data access challenges into a dynamic, scalable graph database solution. This keynote will cover their journey from initial adoption to deploying a fully automated, enterprise-grade causal cluster, highlighting key strategies for modelling organisational changes and ensuring robust disaster recovery. Learn how these innovations have not only enhanced Standard Chartered Bank’s data infrastructure but also positioned them as pioneers in the banking sector’s adoption of graph technology.
A tale of scale & speed: How the US Navy is enabling software delivery from l...sonjaschweigert1
Rapid and secure feature delivery is a goal across every application team and every branch of the DoD. The Navy’s DevSecOps platform, Party Barge, has achieved:
- Reduction in onboarding time from 5 weeks to 1 day
- Improved developer experience and productivity through actionable findings and reduction of false positives
- Maintenance of superior security standards and inherent policy enforcement with Authorization to Operate (ATO)
Development teams can ship efficiently and ensure applications are cyber ready for Navy Authorizing Officials (AOs). In this webinar, Sigma Defense and Anchore will give attendees a look behind the scenes and demo secure pipeline automation and security artifacts that speed up application ATO and time to production.
We will cover:
- How to remove silos in DevSecOps
- How to build efficient development pipeline roles and component templates
- How to deliver security artifacts that matter for ATO’s (SBOMs, vulnerability reports, and policy evidence)
- How to streamline operations with automated policy checks on container images
TrustArc Webinar - 2024 Global Privacy SurveyTrustArc
How does your privacy program stack up against your peers? What challenges are privacy teams tackling and prioritizing in 2024?
In the fifth annual Global Privacy Benchmarks Survey, we asked over 1,800 global privacy professionals and business executives to share their perspectives on the current state of privacy inside and outside of their organizations. This year’s report focused on emerging areas of importance for privacy and compliance professionals, including considerations and implications of Artificial Intelligence (AI) technologies, building brand trust, and different approaches for achieving higher privacy competence scores.
See how organizational priorities and strategic approaches to data security and privacy are evolving around the globe.
This webinar will review:
- The top 10 privacy insights from the fifth annual Global Privacy Benchmarks Survey
- The top challenges for privacy leaders, practitioners, and organizations in 2024
- Key themes to consider in developing and maintaining your privacy program
In his public lecture, Christian Timmerer provides insights into the fascinating history of video streaming, starting from its humble beginnings before YouTube to the groundbreaking technologies that now dominate platforms like Netflix and ORF ON. Timmerer also presents provocative contributions of his own that have significantly influenced the industry. He concludes by looking at future challenges and invites the audience to join in a discussion.
UiPath Test Automation using UiPath Test Suite series, part 5DianaGray10
Welcome to UiPath Test Automation using UiPath Test Suite series part 5. In this session, we will cover CI/CD with devops.
Topics covered:
CI/CD with in UiPath
End-to-end overview of CI/CD pipeline with Azure devops
Speaker:
Lyndsey Byblow, Test Suite Sales Engineer @ UiPath, Inc.
Maruthi Prithivirajan, Head of ASEAN & IN Solution Architecture, Neo4j
Get an inside look at the latest Neo4j innovations that enable relationship-driven intelligence at scale. Learn more about the newest cloud integrations and product enhancements that make Neo4j an essential choice for developers building apps with interconnected data and generative AI.
“An Outlook of the Ongoing and Future Relationship between Blockchain Technologies and Process-aware Information Systems.” Invited talk at the joint workshop on Blockchain for Information Systems (BC4IS) and Blockchain for Trusted Data Sharing (B4TDS), co-located with with the 36th International Conference on Advanced Information Systems Engineering (CAiSE), 3 June 2024, Limassol, Cyprus.
Securing your Kubernetes cluster_ a step-by-step guide to success !KatiaHIMEUR1
Today, after several years of existence, an extremely active community and an ultra-dynamic ecosystem, Kubernetes has established itself as the de facto standard in container orchestration. Thanks to a wide range of managed services, it has never been so easy to set up a ready-to-use Kubernetes cluster.
However, this ease of use means that the subject of security in Kubernetes is often left for later, or even neglected. This exposes companies to significant risks.
In this talk, I'll show you step-by-step how to secure your Kubernetes cluster for greater peace of mind and reliability.
UiPath Test Automation using UiPath Test Suite series, part 6DianaGray10
Welcome to UiPath Test Automation using UiPath Test Suite series part 6. In this session, we will cover Test Automation with generative AI and Open AI.
UiPath Test Automation with generative AI and Open AI webinar offers an in-depth exploration of leveraging cutting-edge technologies for test automation within the UiPath platform. Attendees will delve into the integration of generative AI, a test automation solution, with Open AI advanced natural language processing capabilities.
Throughout the session, participants will discover how this synergy empowers testers to automate repetitive tasks, enhance testing accuracy, and expedite the software testing life cycle. Topics covered include the seamless integration process, practical use cases, and the benefits of harnessing AI-driven automation for UiPath testing initiatives. By attending this webinar, testers, and automation professionals can gain valuable insights into harnessing the power of AI to optimize their test automation workflows within the UiPath ecosystem, ultimately driving efficiency and quality in software development processes.
What will you get from this session?
1. Insights into integrating generative AI.
2. Understanding how this integration enhances test automation within the UiPath platform
3. Practical demonstrations
4. Exploration of real-world use cases illustrating the benefits of AI-driven test automation for UiPath
Topics covered:
What is generative AI
Test Automation with generative AI and Open AI.
UiPath integration with generative AI
Speaker:
Deepak Rai, Automation Practice Lead, Boundaryless Group and UiPath MVP
9. 11 metros
Boston Philadelphia
● ●
Charlotte San Francisco
● ●
Chicago San Jose
● ●
Los Angeles Seattle
● ●
Miami Washington, DC
● ●
New York … and growing
●
36. TileCache
pro con
Cache population Python overhead
● ●
integrated with (rendering, serving)
request/response cycle
Flexible storage
●
37. Pre-render + custom nginx mod
pro con
Fast responses Render everything in
● ●
advance
Parallelizable, offline
●
rendering C module inflexibility
●
(esp. storage backends)
38. Tile rendering
for each zoom level z:
for each column x:
for each row y:
render tile (x, y, z)
39. Tile rendering
for each zoom level z:
for each column x:
for each row y:
render tile (x, y, z)
40. Tile rendering
for each zoom level z:
for each column x:
for each row y:
render tile (x, y, z)
41. Tile rendering
for each zoom level z:
for each column x:
for each row y:
render tile (x, y, z)
43. // ngx_tilecache_mod.c
/*
* This struct holds the attributes that uniquely identify a map tile.
*/
typedef struct {
u_char *version;
u_char *name;
int x;
int y;
int z;
u_char *ext;
} tilecache_tile_t;
/*
* The following regex pattern matches the request URI for a tile and
* creates capture groups for the tile attributes. Example request URI:
*
* /1.0/main/8/654,23.png
*
* would map to the following attributes:
*
* version: 1.0
* name: main
* z: 8
* x: 654
* y: 23
* extension: png
*/
static ngx_str_t tile_request_pat = ngx_string(quot;^/([^/]+)/([^/]+)/([0-9]+)/([0-9]+),([0-9]+).([a-z]+)$quot;);
44. // ngx_tilecache_mod.c
u_char *
get_disk_key(u_char *s, u_char *name, int x, int y, int z, u_char *ext)
{
u_int a, b, c, d, e, f;
a = x / 100000;
b = (x / 1000) % 1000;
c = x % 1000;
d = y / 100000;
e = (y / 1000) % 1000;
f = y % 1000;
return ngx_sprintf(s, quot;/%s/%02d/%03d/%03d/%03d/%03d/%03d/%03d.%squot;,
name, z, a, b, c, d, e, f, ext);
}
static ngx_int_t
ngx_tilecache_handler(ngx_http_request_t *r)
{
// ... snip ...
sub_uri.data = ngx_pcalloc(r->pool, len + 1);
if (sub_uri.data == NULL) {
return NGX_ERROR;
}
get_disk_key(sub_uri.data, tile->name, tile->x, tile->y, tile->z, tile->ext);
sub_uri.len = ngx_strlen(sub_uri.data);
return ngx_http_internal_redirect(r, &sub_uri, &r->args);
}
50. # cluster.py
import math
from everyblock.maps.clustering.models import Bunch
def euclidean_distance(a, b):
return math.hypot(a[0] - b[0], a[1] - b[1])
def buffer_cluster(objects, radius, dist_fn=euclidean_distance):
bunches = []
buffer_ = radius
for key, point in objects.iteritems():
bunched = False
for bunch in bunches:
if dist_fn(point, bunch.center) <= buffer_:
bunch.add_obj(key, point)
bunched = True
break
if not bunched:
bunches.append(Bunch(key, point))
return bunches
51. # bunch.py
class Bunch(object):
def __init__(self, obj, point):
self.objects = []
self.points = []
self.center = (0, 0)
self.add_obj(obj, point)
def add_obj(self, obj, point):
self.objects.append(obj)
self.points.append(point)
self.update_center(point)
def update_center(self, point):
xs = [p[0] for p in self.points]
ys = [p[1] for p in self.points]
self.center = (sum(xs) * 1.0 / len(self.objects),
sum(ys) * 1.0 / len(self.objects))
52. # cluster_scale.py
from everyblock.maps import utils
from everyblock.maps.clustering import cluster
def cluster_by_scale(objs, radius, scale, extent=(-180, -90, 180, 90)):
resolution = utils.get_resolution(scale)
# Translate from lng/lat into coordinate system of the display.
objs = dict([(k, utils.px_from_lnglat(v, resolution, extent))
for k, v in objs.iteritems()])
bunches = []
for bunch in cluster.buffer_cluster(objs, radius):
# Translate back into lng/lat.
bunch.center = utils.lnglat_from_px(bunch.center,
resolution,
extent)
bunches.append(bunch)
return bunches