Download as PDF, PPTX

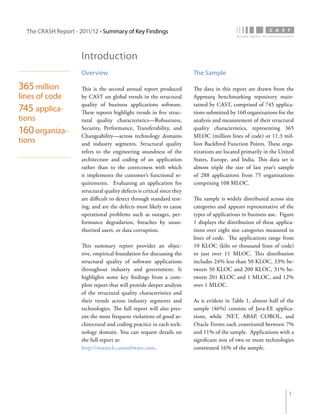
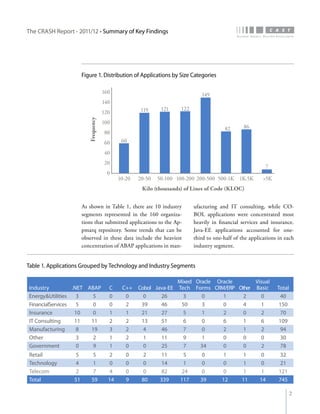

The crash report for 2011/12 analyzes the structural quality of software applications using data from 745 applications submitted by 160 organizations, revealing trends in security, performance, maintainability, and technical debt. Key findings indicate that COBOL applications exhibit higher security scores while Java EE applications suffer from lower performance scores, and maintainability is particularly low in government applications. The report provides insights into how development methods and application size impact software quality and highlights the importance of addressing technical debt.


