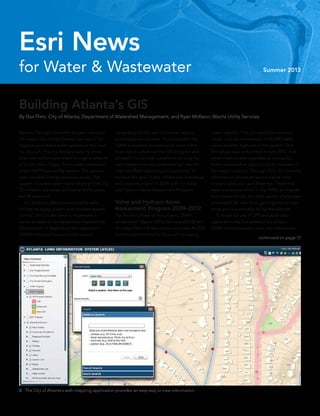
The City of Atlanta implemented a series of initiatives to improve its aging water infrastructure and increase system control. This included an ambitious project from 2009-2012 to inventory, repair, and document over 80,000 valves and fire hydrants using ArcGIS technology. To make full use of the collected asset data, Atlanta commissioned professionals to migrate the data to a GIS database. This allowed the creation of web-based maps and reports to better manage the water system assets.
Esri News for State & Local Government Fall 2013 newsletterEsri
Local governments in Wilson County, Tennessee are meeting the challenge of efficiently delivering GIS services to both power users and casual users through a combination of on-premises and cloud-based GIS technologies. For power users, nightly data replication between local geodatabases and a centralized cloud repository ensures timely sharing of updated data. For casual users, focused web applications built with ArcGIS Online directly support specific business needs like reviewing liquor license applications and identifying residents not enrolled in an emergency notification program. This hybrid approach increases GIS adoption and drives efficiency within local government operations.
The document discusses how governments are making open data available through initiatives like Data.gov and how GIS technology can unlock the potential of open data. It provides examples of government agencies like the FCC and Department of Agriculture that are using interactive maps and applications to communicate open data in a spatial context and engage citizens. This facilitates open government through increased transparency, collaboration and efficiency.
SeaSketch is a new online geospatial planning tool developed by researchers at the University of California, Santa Barbara that incorporates ArcGIS technologies. It allows stakeholders to collaboratively plan marine resource use by sketching out proposals, analyzing impacts, and producing reports in an online workspace. SeaSketch improves on previous tools by being less expensive, easier to maintain, and faster to deploy for marine spatial planning projects. It leverages existing ArcGIS for Server map services and ArcGIS Online data to provide users with robust analytical capabilities and large amounts of geospatial data.
The EPA has launched EPA GeoPlatform, built on Esri's ArcGIS Online infrastructure, to serve geospatial data, maps, and reports to EPA staff. EPA GeoPlatform provides a standardized framework for coordinating EPA's geospatial activities, applications, and data. It allows all EPA employees to access and build applications on a common platform. EPA cites benefits like increased access to decision-making tools, a standardized look and feel for maps, cost savings from reduced duplication, and improved environmental decision making. EPA GeoPlatform supports various EPA programs and provides data and maps to staff for their community work.
The Los Angeles Unified School District uses a smartphone app integrated with its GIS to allow students and faculty to report maintenance issues like graffiti or broken equipment. When an issue is reported, details are sent to the district's asset management system to generate a work order. The app is part of the district's effort to expand GIS use and involve the community in facility upkeep.
Esri News for Telecommunications 2013 newsletterEsri
Bell Aliant aimed to offer fiber to the home to over 650,000 customers by 2012 but faced challenges with their time-consuming manual design process. They implemented a GIS-based solution from Telcordia and Esri to automate network design and data collection. This reduced fiber serving area design times by 40% and helped Bell Aliant scale their fiber rollout to meet aggressive expansion targets in a cost-effective manner.
The document discusses how GIS software, specifically ArcGIS, can be used to better manage facilities and buildings. ArcGIS allows facilities managers to design and operate buildings from a single database, perform spatial analysis, and model asset usage over time. It also improves various business functions related to facilities management like planning, asset management, safety and security, and energy management. ArcGIS provides templates and applications to get started easily and helps exchange data with CAD systems.
The Alabama Forestry Commission used ArcGIS to quickly and accurately assess forest damage from tornadoes in April 2011. A GIS model was developed to analyze data from 39 counties, calculating that 204,590 acres were impacted with an assessed value of $266 million. The model automated geoprocessing tasks and produced results in minutes that would have taken weeks or months manually. The analysis helped document funding requests and guide forest recovery efforts.
Esri News for State and Local Government Spring 2013 issueEsri
The US population continued to grow more diverse in 2012, with rising racial/ethnic diversity and changes in household composition. While the housing market recovery remained slow overall, signs of recovery were seen in some areas. Housing growth varied across the country, driven by factors like military presence in some areas and economic growth in others. Traditional husband-wife families with children continued to decline as a share of households.
This document summarizes an interview with Jack Dangermond, President of Esri, about how the ArcGIS platform is transforming government. Key points:
- ArcGIS provides a cloud-based platform for mapping, data analysis, and application development through ArcGIS Online. This has made GIS more accessible across devices and to non-experts.
- ArcGIS Online facilitates improved collaboration within and across agencies by allowing users to access and share maps, data, and applications.
- Esri has supported developers by providing tools and hosting events to promote building applications using ArcGIS APIs and geoservices. This helps organizations more broadly adopt and integrate GIS.
Web GIS is a transformational architecture that opens, integrates, and simplifies GIS systems. It connects GIS professionals with more users across organizations through simple apps and mobile access. This allows for better geographic understanding and more informed decisions. Examples at the user conference showed how the Atlanta airport uses web GIS and mobile apps to inspect and maintain facilities in 3D. The National Geospatial-Intelligence Agency director discussed sharing open data to aid humanitarian efforts. A new Young Professionals Network was launched to connect emerging GIS professionals.
The document discusses the Utah Automated Geographic Reference Center's (AGRC) efforts to reorganize around geospatial web services. It outlines AGRC's mission to facilitate effective geospatial data use in Utah. AGRC manages the State Geographic Information Database (SGID) and provides web and mapping services. It has transitioned from an exploration phase to focus on developing reusable component services and business solutions using its geospatial data and ArcGIS Server.
Esri News for State & Local Government newsletterEsri
The document discusses how three local governments - Fort Lauderdale, Florida; Lake County, Florida; and Cabarrus County, North Carolina - were able to quickly implement mapping applications using configurable templates from Esri's ArcGIS for Local Government resource center rather than developing applications from scratch. Fort Lauderdale replaced an aging parks and recreation application in a week. Lake County created a public services application in under a week. The templates allow local governments to expand services faster and at lower cost compared to custom development.
Web Mapping - exploiting location based information through eGovernmentDavid Hayward
eGovernment conference presentation:
Government has huge amounts of information but how can this be effectively managed and delivered through the web? This session will ‘lift the lid’ on web mapping technology and identify some of the key issues that must be addressed to achieve a successful outcome.
The NSW government SIX Viewer web mapping portal will be used as a case study to demonstrate how terabytes of data can be integrated and delivered via the Internet.
The Mapping Revolution: Incorporating Geographic Information Systems in Gover...GovLoop
Since the beginning of civilization, humans have used images as a means to tell stories. We have used images to educate, entertain or to build a just and moral society. Our ancient ancestors would use images to remember stories and archive information for future generations. Similar to our ancient ancestors, we use images today to convey meaning, understand complex relationships and improve communication.
The use of mapping and geospatial technology is at the heart of story telling and improved communications. As the challenges of the public sector continue to grow in complexity, efficient and effective communication tools are essential. Today, government is more interconnected than ever before, and the complexity has led to increased integration between state, local and federal officials. At all levels of government, agencies are looking for solutions to find value and improve public sector decision-making through data. http://www.govloop.com/profiles/blogs/govloop-guide-the-mapping-revolution-incorporating-geographic-inf
The summary analyzes how the City of Sault Ste. Marie has leveraged geographic data and GIS technology through the Sault Ste. Marie Innovation Centre (SSMIC) to benefit the community in several ways:
1) The SSMIC facilitates data sharing between over 60 community partners and uses GIS to analyze patterns across datasets to inform decisions around community planning, development, and investment.
2) Examples are provided where GIS analysis helped attract investment by quickly providing location data to companies, identify suitable sites for infrastructure like signal towers for smart meters, and determine optimal locations for services like audible crosswalk signals.
3) Public health and safety initiatives like tracking bear encounters and identifying homes at risk for
Tracking the Anonymous GIS User in King CountyGreg Babinski
This presentation analyzes 6 years of detailed GIS-based web mapping application user statistics within 35 King County (WA) departments and offices. It also compares King County web mapping application usage growth compared to other municipal jurisdictions accross the US.
The document discusses the National Informatics Centre's (NIC) initiatives on visualization through maps and images from 1990 onwards. It provides details on NIC's Multi-Layer GIS Platform called NICMAPS which provides seamless countrywide base maps, satellite images, and hybrid maps aligned to global standards. NICMAPS serves as an essential component of Digital India for electronic delivery of services for planning and governance. It provides maps and layers at different scales along with terrain maps and supports geo-coding of locations. The document outlines NIC's role in developing digital GIS assets and standards-based multi-layer GIS framework involving various stakeholders for use in e-governance applications.
CCAPS and AidData built an interactive app with the ArcGIS API for Microsoft Silverlight/WPF to map effects of aid, climate change, and conflict in Africa.
Citizen engagement applications using GIS allow governments to receive real-time feedback from citizens on smartphones. This helps governments understand community needs and improve services. Smart cities recognize citizens as sensors, making it easy for public to report issues online or on mobile devices. The City of Glendale collaborated on an app for citizens to report issues like potholes with photos and locations sent to the city for tracking and resolution. Incorporating citizen data helps governments operate more smoothly and responsively to community needs.
The Richland County Information Technology/Geographic Information Systems Department mobilized mapping tools to disseminate critical information for flood damage assessment and recovery from historic October 2015 rainfall and flooding. They created a collection of open source mapping applications to provide updated information on road closures, dam statuses, debris locations, and damage assessments to emergency responders and the public. Through leveraging cloud technologies, citizen reporting, and collaboration with other agencies, they were able to quickly gather and publish timely, accurate data to support response and recovery efforts in an innovative and cost effective manner.
This document proposes a smart city surveillance system that utilizes vehicle-mounted cameras and sensors to crowdsource real-time data about urban events and conditions. Vehicles would collect image and location data using cameras and GPS and upload it to a cloud server. The server would store the data and make it accessible to the public. The system aims to provide detailed, efficient monitoring of cities to benefit residents and officials. It was tested and shown to perform well under increasing workload.
Geospatial solutions for creating a smart cityShristi Paudel
Smart city is a concept for sustainable cities. Geomatics/Geospatial technologies play a major role in creating a smart city; they act like the foundation for smart city. This presentation highlights the importance and role of different sectors of geospatial field in a smart city. The presentation was presented in an open presentation competition on the theme 'Applied engineering technology' and was awarded the first prize.
Wellbeing Toronto is a dynamic map visualization tool that helps evaluate community wellbeing across Toronto's 140 neighbourhoods on a number of factors including as crime, transportation and housing. It’s used by decision-makers that need data to support neighbourhood level planning, residents that want information to better understand the communities they live, work, and play in; and businesses needing indicators to learn more about their customers.
But it’s more than just a map.
In this session, Wellbeing Toronto Project Manager Mat Krepicz takes you on a tour of Wellbeing Toronto and share candid insights on its development including key lessons learned, mistakes made, and preview what’s next for one of Canada’s most robust community indicator platforms.
Esri Location Analytics reveals relationships and patterns in enterprise data using location. It extends traditional applications by providing complete information and analysis. Location analytics allows businesses to maximize advertising dollars, governments to see spending patterns, and first responders to access digital floor plans during emergencies. Putting location at the center of analysis provides deeper insights, more powerful analytics, and richer information for improved decision making.
The document discusses how public participatory GIS can empower communities by allowing them to create maps using technologies like the Google Maps API. It provides examples of how environmental groups have used interactive mapping applications with Google Maps to involve the public, collect and share local data, and raise awareness of issues. The use of these technologies lowers the cost and technical barriers to using GIS for community organizations.
The Southern Company UAV Idea Team will present their vision to use drone technology across Southern Company's utility operations to help reduce outages, improve safety, and reduce costs. The presentation will discuss challenges with utilities and ideas for addressing them. The idea team is made up of several members from Alabama Power and Georgia Power focused on transmission and land management, as well as members from Southern Company's program management office and research and development department.
This document discusses the four main goals of a successful utility company according to the former president of a utility company: 1) make money, 2) keep customers happy, 3) keep employees safe and happy, and 4) stay out of trouble. It explains how location analytics can help utilities better understand the relationships between various key performance indicators (KPIs) that measure how well a utility is meeting these goals, in order to gain business insights and address issues like pockets of poor reliability.
Coweta County in Georgia used iPads with ArcGIS Collector to double the productivity of infrastructure inspections. Field inspectors were able to complete inspections and instantly sync collected data to the central GIS system without returning to the office. This allowed the county to complete mandated annual inspections of all infrastructure assets within half a year, freeing up time to begin additional mapping work earlier than required. The increased efficiency has improved infrastructure management and planning for Coweta County.
Esri News for Federal Government Winter 2012/2013 issueEsri
The United States Environmental Protection Agency (EPA) has built a map service called EPA GeoPlatform on Esri's ArcGIS Online for Organizations to make geospatial data and tools more accessible to EPA staff. EPA GeoPlatform includes public and private cloud components to share internal and external data. It supports EPA activities like enforcement targeting and environmental justice screening. EPA sees benefits like increased access to decision-making tools and cost savings from standardization. EPA GeoPlatform serves as the agency's centralized hub for hosted map services.
A low cost method of real time pavement condition data sharing to expedite ma...UVision
A low cost method of real time pavement condition data sharing to expedite maintenance intervention
Pavements for roads in cities and highways are degraded with potholes, cracking, and rutting distresses. There is a strong need to identify these locations and sections with undesired longitudinal roughness quickly and accurately every year. Traditionally, expensive standalone survey vehicles for roughness measurements and more expensive multi-function vehicles are employed by highway agencies or through contract services, which most cities and local agencies can’t afford. The primary objective of this study is to describe a low cost method to collect essential pavement condition data and share real time to expedite maintenance intervention needs. This facilitates rapid identification of pavement sections with undesired longitudinal roughness and local defects. This paper discusses the impact of social media, crowd sourcing, and advances in cheaper accurate motion sensors and cloud server data processing. These tools make it possible to develop easy-to-use low cost methods, which are affordable by city public work and smaller road agencies.
The document summarizes Logic Concepts' Atlas360 product, which provides mobile solutions for asset management and field data collection. It offers applications for tasks like solid waste management, storm water asset tracking, sign inventory, and disaster assessment. Customers in various municipalities have reported benefits like reduced fuel and operating costs, quicker FEMA reimbursement after disasters, and improved efficiency in code enforcement activities.
Esri News for State and Local Government Winter 2012/2013 issueEsri
The document discusses how Utah County, Utah updated its GIS data model using the ArcGIS for Local Government Information Model. Patrick Wawro, the GIS manager, decided to abandon his individual efforts to update the data model and instead model the data on the information model, which is built on best practices from governments around the US. This standardized and modernized the county's work. Using the information model also makes it easier for cities to take advantage of ArcGIS for Local Government templates and allows the county to easily adopt new technologies. The county is now taking advantage of templates for applications like an election polling places app and developing other apps based on templates.
At Esri UK Annual Conference 2014
United Utilities (UU) is one of the UK’s largest water and wastewater companies with seven million people in the North West of England. UU had been working with an old GIS ‘landscape’ implementation, comprising five separate systems. Without an enterprise GIS platform affording ‘one version of the truth’, there were risks to the business of making decisions based on wrong or missing information. UU embarked on the journey of Linear Asset Management (LAM) programme with an aim to create a future-proof GIS platform and take UU right to the front of the utility industry in terms of leading-edge technology and state-of-the-art information management.
ArcGIS for Water Utilities is a collection of Esri products configured specifically for water utilities. It includes maps and apps to support common water utility workflows such as maintaining asset information, designing capital projects, optimizing field operations, understanding operations status, and connecting with customers. These workflows integrate the common GIS patterns of asset management, planning and analysis, field mobility, operational awareness, and constituent engagement. The ArcGIS platform allows water utilities to deploy these solutions to unlock benefits and efficiently manage their operations.
World Pipelines - Better Together - SCADA and GISsmrobb
This document discusses how geographic information systems (GIS) and supervisory control and data acquisition (SCADA) systems can work together to improve pipeline operations. Traditionally, pipeline operators have relied on SCADA alone, but integrating SCADA data with GIS capabilities offers significant benefits. The combination allows operators to view pipeline assets and real-time operating conditions within an accurate geospatial context. Linking GIS and SCADA without data duplication also reduces long-term costs while providing operators a comprehensive picture to more effectively troubleshoot problems and dispatch field crews. Pipeline companies are now able to realize improved logistics, decision-making, and overall operational efficiency by integrating their GIS and SCADA systems.
Esri News for Petroleum Winter 2013/2014 newsletterEsri
Hart Energy launched its extensive North American energy infrastructure dataset on Esri's ArcGIS Online platform. This allows Hart Energy customers to access high-quality GIS data on demand from anywhere using GIS tools. Hart Energy is the first energy data provider to use Esri's cloud service, strengthening its lead in the industry. Users can add Hart Energy's pipeline and attribute data to maps on ArcGIS Online along with other data layers. The dataset is continually updated by Hart Energy and provides comprehensive energy infrastructure mapping for analysis.
Hart Energy launched its extensive energy infrastructure dataset on Esri's ArcGIS Online platform. This allows Hart Energy customers to access high-quality pipeline and oil/gas asset data from anywhere using GIS tools in the cloud. As the first energy data provider to use Esri's cloud services, Hart Energy can now provide its comprehensive North American energy dataset to customers in a cost-effective and low-risk manner.
8 Ways Utility Networks Can Meet Data DemandsSafe Software
Having a data integration plan is crucial for a successful distribution network, whether it’s for electrical, natural gas, or water utilities. Automated integration processes can preserve data quality, save time, and make information access effortless for everyone.
In this webinar, we’ll showcase 8 ways real utility organizations are using FME to integrate and deliver information for tasks like:
Asset management
Emergency and risk management
Design and planning
Ensuring data quality
Migrating data to other systems (ie. Esri Utility Network)
UAV data collection and AR data visualization
By automatically keeping systems and information up-to-date, you can gain significant time and cost savings, and enable actionable decision-making.
1) Automatic metering infrastructure (AMI) technology is allowing water utilities to more effectively detect leaks and reduce non-revenue water losses through the collection and analysis of granular, real-time consumption data.
2) Two case studies describe how Boston and Detroit implemented AMI systems to significantly cut their non-revenue water losses from around 20% to less than 10% and improve customer service through more accurate billing and leak notification.
3) Even smaller and more rural water utilities are realizing benefits from AMI such as identifying customer leaks, benchmarking consumption by customer type, and gaining data to consider new rate structures.
Don Talend Automatic Metering Infrastructure Implementation ArticleDon Talend
Innovative water utilities implement AMI and utilize the data to develop comprehensive loss prevention plans, , brand storytelling, content strategy and demand generation expert. Water processing industry
A GIS acts as the central hub to integrate critical data sources like customer information, metering data, maps, vehicle tracking and outage calls. This allows dispatchers to manage outage restoration more efficiently by having all relevant information organized on a map. Integrating these previously separate sources reduces costs by lowering staffing needs and speeds decision making during outages. A GIS also enables faster outage reporting and analysis to further aid restoration efforts.
This document discusses a mobile app called "Road Factor" that uses GPS to provide information on road conditions. It allows users to view details of the road they are currently on, like when it was last resurfaced. Government agencies can use the data to monitor roads and make planning/budget decisions to improve road maintenance. The app aims to help build better transportation infrastructure and facilitate governance through electronic monitoring of roadwork. It connects to a centralized database containing road condition details for cities across India.
Microsoft Windows Azure - City Government Of Miami Improves Service Offerings...Microsoft Private Cloud
The City of Miami IT department wanted to improve its 311 nonemergency application to include online tracking and mapping capabilities. However, managing the necessary server infrastructure required significant resources and the department had shrinking budgets. The city developed the new 311 application on the Windows Azure platform to gain scalable, cost-effective hosting and resources. This allowed the city to reduce costs while improving services for citizens faster than before, including relying on Azure's disaster recovery capabilities important for their hurricane-prone location.
INIA- CISA: Análisis de las amenazas en la fauna silvestreEsri
El documento describe cómo un centro de investigación utilizó herramientas SIG para analizar datos sobre animales silvestres ingresados en un centro de recuperación con el fin de identificar especies, áreas y períodos con mayor riesgo de amenazas y sus relaciones con factores humanos y ambientales. Esto permitió enfocar medidas correctivas de manera más eficiente para conservar la fauna silvestre y prevenir amenazas. En particular, se analizó el riesgo de colisión de rapaces nocturnas con vehículos, identificando las zonas de mayor
Aena Aeropuerto Adolfo Suárez-Barajas crea potentes aplicaciones para sus cli...Esri
Aena Aeropuerto Adolfo Suárez-Barajas creó aplicaciones personalizadas para sus clientes internos utilizando ArcGIS, aprovechando su experiencia previa. Estas nuevas aplicaciones son fáciles de usar y gestionar, y permiten responder más rápidamente a las necesidades de los usuarios. Ahora los usuarios internos y externos tienen acceso a herramientas de mapeo actualizadas que mejoran la eficiencia de las operaciones en el aeropuerto.
El Ayuntamiento de Móstoles implementó una plataforma Smart City utilizando ArcGIS para mejorar la eficiencia, permitir la participación ciudadana y gestionar los activos municipales en tiempo real. La solución integró toda la información municipal en una sola plataforma e incorporó sensores para supervisar servicios como el alumbrado público. Además, una aplicación permite a los ciudadanos reportar incidencias y el ayuntamiento responder más rápido, ahorrando costos.
ArcGIS Online es una plataforma en la nube que permite crear y compartir mapas, aplicaciones y datos geográficos. Los usuarios pueden publicar y almacenar servicios web en la nube, crear mapas interactivos a partir de datos como hojas de cálculo, y colaborar y compartir contenido con otros mediante grupos privados o públicos.
Portal for ArcGIS is a content management system that provides a framework to easily manage and secure geographic assets within an organization. It extends the reach of GIS to everyone in an organization, enabling better decision making. Portal for ArcGIS can be used to implement web GIS on-premises or in the cloud for organizations with specialized security requirements. It will be included with ArcGIS for Server Standard and Advanced starting at version 10.3.
GIS-Based Web Services Provide Rapid Analysis and Dissemination of Maritime DataEsri
The Royal Australian Navy's Hydrography, Meteorology and Oceanography Branch is responsible for collecting, managing, analyzing, and disseminating meteorological and oceanographic data to enable defense users to properly consider environmental impacts. This data comes in large volumes and various formats. Using ArcGIS for Server and custom scripts, the branch can serve this data as OGC web services, including nautical charts and bathymetry as WMS and netCDF weather data as WMS and WCS. This allows for rapid analysis and dissemination of data to gain knowledge of the battlespace and environment.
An Effective Tool for Drinking Water ProtectionEsri
The document discusses ICWater, a tool developed by Leidos to predict the spread and impact of hazardous material releases in river systems. ICWater forecasts (1) where contaminants will travel, (2) if they will reach drinking water intakes, (3) when they will arrive, and (4) if concentrations will threaten human health. It interfaces with USGS stream gauges and databases on infrastructure to provide timely information to decision makers. ICWater successfully modeled the 2014 Elk River chemical spill in West Virginia to advise authorities and protect drinking water.
GeoCollector for ArcPad is a mobile GIS solution that combines Esri's ArcPad software with Trimble GPS hardware to improve the accuracy of collected location data. It provides field workers with a rugged tablet equipped with an integrated GPS receiver and ArcPad software for mapping and data collection. This solution allows organizations to make timely decisions based on reliable location information gathered by field staff.
GeoCollector for ArcGIS for Windows Mobile is a mobile GIS solution that combines Esri's GIS software with Trimble's GPS hardware to improve the accuracy of collected data. It allows field workers to visualize maps, collect geo-located data, and integrate accurate location information into organizational decision making. The solution includes a Trimble Geo 7X handheld device with integrated GPS receiver and ArcGIS for Windows Mobile software for mobile field mapping and data collection with minimal training.
Data Appliance for ArcGIS is an enterprise solution that provides high performance and secure access to terabytes of preloaded geospatial data stored on a network-attached storage device. It includes global basemaps that allow users to immediately build mapping applications. Organizations can publish maps and build apps to share securely behind their firewall. A server bundle is also available for organizations that do not have ArcGIS for Server.
This document describes new premium imagery services from Esri and BlackBridge that provide continuously updated 5-band, 5-meter imagery for use in ArcGIS. The services include a Living Image Basemap service sourced from BlackBridge's RapidEye constellation, regional Mosaics services with virtually cloud-free hand-picked images, and a Living Image Multispectral service providing temporal multispectral imagery through online services.
GeoPlanner for ArcGIS is a web-based app that helps users create, assess, and share planning designs using the geographic knowledge and tools of the ArcGIS platform. It allows users to bring in their own planning data, sketch design plans, compare alternative designs using dashboards, and enable collaboration throughout the planning process. GeoPlanner incorporates each aspect of a geodesign workflow into a single app so that designers, evaluators, and the public can assess the impacts of various scenarios. The app runs on both desktop and mobile devices with touch-enabled tools, supporting planning and design access from anywhere.
This document summarizes an Esri and AccuWeather partnership that provides weather data and warnings through ArcGIS Online. It allows key personnel to access real-time weather reports and warnings to communicate updates. The partnership protects people, property, and assets from severe weather threats with AccuWeather warnings developed by meteorologists. ArcGIS tools can analyze weather data to understand weather impacts and help determine emergency procedures. AccuWeather aims to provide the earliest warnings to enact procedures and save lives.
Esri and Airbus Defense & Space provide imagery products and services including thematic imagery layers with region-specific basemaps and fresh 50cm resolution orthorectified imagery. Their site monitoring service analyzes changes at targeted sites on a daily, weekly or monthly basis and delivers a detailed change detection report as an ArcGIS image service and Story Map app. Their satellite tasking and archive app allows users to task Airbus Defense & Space satellites to acquire new imagery over areas of interest or order images from the archive, with images delivered as an ArcGIS image service.
This document provides a summary of various US demographic and business data sources available from Esri, including descriptions, frequencies of updates, and data vintages. It describes datasets covering topics such as population, households, income, businesses, retail sales, crime, banking and demographics. The data comes from sources including the US Census Bureau, Bureau of Labor Statistics, Dun & Bradstreet and other public and private organizations. Most datasets are updated annually, with some updated decennially, quarterly or semiannually.
ArcGIS for Server on Microsoft Azure JumpstartEsri
This document discusses ArcGIS for Server on Microsoft Azure and the ArcGIS for Server on Microsoft Azure Jumpstart offering from Esri. It provides an overview of deploying ArcGIS for Server in the Microsoft Azure cloud, including advantages such as lower hardware costs, automatic scaling, and leveraging the Azure management portal. It then describes the Jumpstart as providing on-site support and training to help customers get started with ArcGIS Server on Azure, including orientation, VM setup, data loading, service creation, and custom VM configuration. It notes that Esri Professional Services can determine if the Jumpstart is a good fit or provide custom services if additional needs exist. The Jumpstart can be purchased through Esri Professional Services or a customer's
ArcGIS provides tools and capabilities to enable naval units to operate self-sufficiently in remote locations with limited bandwidth. It allows warfighters to access and analyze geospatial data through familiar applications like dashboards and Microsoft Office. The ArcGIS platform delivers low-cost and interoperable solutions to support maritime operations and command and control decisions. It helps transform raw data into actionable intelligence through geoanalytics and visualization.
Esri Geoportal Server is an open source product that enables discovery and use of geospatial resources like datasets, rasters, and web services. It helps organizations manage and publish metadata for their geospatial resources so users can discover and connect to those resources. Key features include supporting international standards, cataloging GIS resources regardless of location or type, and facilitating discovery through a customizable geoportal web interface.
GeoEvent Extension for Server allows users to connect streaming sensor data to GIS applications in real time to monitor assets and alert personnel of specified conditions. It can process and filter multiple data streams using user-defined rules, and includes connectors for common sensors. Key benefits include incorporating real-time data into existing GIS systems to show updated information and detect important spatial or attribute events. The software can be integrated with various monitoring applications and deployed on-premises or in the cloud.
Taking AI to the Next Level in Manufacturing.pdfssuserfac0301
Read Taking AI to the Next Level in Manufacturing to gain insights on AI adoption in the manufacturing industry, such as:
1. How quickly AI is being implemented in manufacturing.
2. Which barriers stand in the way of AI adoption.
3. How data quality and governance form the backbone of AI.
4. Organizational processes and structures that may inhibit effective AI adoption.
6. Ideas and approaches to help build your organization's AI strategy.
What is an RPA CoE? Session 1 – CoE VisionDianaGray10
In the first session, we will review the organization's vision and how this has an impact on the COE Structure.
Topics covered:
• The role of a steering committee
• How do the organization’s priorities determine CoE Structure?
Speaker:
Chris Bolin, Senior Intelligent Automation Architect Anika Systems
AppSec PNW: Android and iOS Application Security with MobSFAjin Abraham
Mobile Security Framework - MobSF is a free and open source automated mobile application security testing environment designed to help security engineers, researchers, developers, and penetration testers to identify security vulnerabilities, malicious behaviours and privacy concerns in mobile applications using static and dynamic analysis. It supports all the popular mobile application binaries and source code formats built for Android and iOS devices. In addition to automated security assessment, it also offers an interactive testing environment to build and execute scenario based test/fuzz cases against the application.
This talk covers:
Using MobSF for static analysis of mobile applications.
Interactive dynamic security assessment of Android and iOS applications.
Solving Mobile app CTF challenges.
Reverse engineering and runtime analysis of Mobile malware.
How to shift left and integrate MobSF/mobsfscan SAST and DAST in your build pipeline.
How information systems are built or acquired puts information, which is what they should be about, in a secondary place. Our language adapted accordingly, and we no longer talk about information systems but applications. Applications evolved in a way to break data into diverse fragments, tightly coupled with applications and expensive to integrate. The result is technical debt, which is re-paid by taking even bigger "loans", resulting in an ever-increasing technical debt. Software engineering and procurement practices work in sync with market forces to maintain this trend. This talk demonstrates how natural this situation is. The question is: can something be done to reverse the trend?
5th LF Energy Power Grid Model Meet-up SlidesDanBrown980551
5th Power Grid Model Meet-up
It is with great pleasure that we extend to you an invitation to the 5th Power Grid Model Meet-up, scheduled for 6th June 2024. This event will adopt a hybrid format, allowing participants to join us either through an online Mircosoft Teams session or in person at TU/e located at Den Dolech 2, Eindhoven, Netherlands. The meet-up will be hosted by Eindhoven University of Technology (TU/e), a research university specializing in engineering science & technology.
Power Grid Model
The global energy transition is placing new and unprecedented demands on Distribution System Operators (DSOs). Alongside upgrades to grid capacity, processes such as digitization, capacity optimization, and congestion management are becoming vital for delivering reliable services.
Power Grid Model is an open source project from Linux Foundation Energy and provides a calculation engine that is increasingly essential for DSOs. It offers a standards-based foundation enabling real-time power systems analysis, simulations of electrical power grids, and sophisticated what-if analysis. In addition, it enables in-depth studies and analysis of the electrical power grid’s behavior and performance. This comprehensive model incorporates essential factors such as power generation capacity, electrical losses, voltage levels, power flows, and system stability.
Power Grid Model is currently being applied in a wide variety of use cases, including grid planning, expansion, reliability, and congestion studies. It can also help in analyzing the impact of renewable energy integration, assessing the effects of disturbances or faults, and developing strategies for grid control and optimization.
What to expect
For the upcoming meetup we are organizing, we have an exciting lineup of activities planned:
-Insightful presentations covering two practical applications of the Power Grid Model.
-An update on the latest advancements in Power Grid -Model technology during the first and second quarters of 2024.
-An interactive brainstorming session to discuss and propose new feature requests.
-An opportunity to connect with fellow Power Grid Model enthusiasts and users.
Freshworks Rethinks NoSQL for Rapid Scaling & Cost-EfficiencyScyllaDB
Freshworks creates AI-boosted business software that helps employees work more efficiently and effectively. Managing data across multiple RDBMS and NoSQL databases was already a challenge at their current scale. To prepare for 10X growth, they knew it was time to rethink their database strategy. Learn how they architected a solution that would simplify scaling while keeping costs under control.
For the full video of this presentation, please visit: https://www.edge-ai-vision.com/2024/06/temporal-event-neural-networks-a-more-efficient-alternative-to-the-transformer-a-presentation-from-brainchip/
Chris Jones, Director of Product Management at BrainChip , presents the “Temporal Event Neural Networks: A More Efficient Alternative to the Transformer” tutorial at the May 2024 Embedded Vision Summit.
The expansion of AI services necessitates enhanced computational capabilities on edge devices. Temporal Event Neural Networks (TENNs), developed by BrainChip, represent a novel and highly efficient state-space network. TENNs demonstrate exceptional proficiency in handling multi-dimensional streaming data, facilitating advancements in object detection, action recognition, speech enhancement and language model/sequence generation. Through the utilization of polynomial-based continuous convolutions, TENNs streamline models, expedite training processes and significantly diminish memory requirements, achieving notable reductions of up to 50x in parameters and 5,000x in energy consumption compared to prevailing methodologies like transformers.
Integration with BrainChip’s Akida neuromorphic hardware IP further enhances TENNs’ capabilities, enabling the realization of highly capable, portable and passively cooled edge devices. This presentation delves into the technical innovations underlying TENNs, presents real-world benchmarks, and elucidates how this cutting-edge approach is positioned to revolutionize edge AI across diverse applications.
"Frontline Battles with DDoS: Best practices and Lessons Learned", Igor IvaniukFwdays
At this talk we will discuss DDoS protection tools and best practices, discuss network architectures and what AWS has to offer. Also, we will look into one of the largest DDoS attacks on Ukrainian infrastructure that happened in February 2022. We'll see, what techniques helped to keep the web resources available for Ukrainians and how AWS improved DDoS protection for all customers based on Ukraine experience
Driving Business Innovation: Latest Generative AI Advancements & Success StorySafe Software
Are you ready to revolutionize how you handle data? Join us for a webinar where we’ll bring you up to speed with the latest advancements in Generative AI technology and discover how leveraging FME with tools from giants like Google Gemini, Amazon, and Microsoft OpenAI can supercharge your workflow efficiency.
During the hour, we’ll take you through:
Guest Speaker Segment with Hannah Barrington: Dive into the world of dynamic real estate marketing with Hannah, the Marketing Manager at Workspace Group. Hear firsthand how their team generates engaging descriptions for thousands of office units by integrating diverse data sources—from PDF floorplans to web pages—using FME transformers, like OpenAIVisionConnector and AnthropicVisionConnector. This use case will show you how GenAI can streamline content creation for marketing across the board.
Ollama Use Case: Learn how Scenario Specialist Dmitri Bagh has utilized Ollama within FME to input data, create custom models, and enhance security protocols. This segment will include demos to illustrate the full capabilities of FME in AI-driven processes.
Custom AI Models: Discover how to leverage FME to build personalized AI models using your data. Whether it’s populating a model with local data for added security or integrating public AI tools, find out how FME facilitates a versatile and secure approach to AI.
We’ll wrap up with a live Q&A session where you can engage with our experts on your specific use cases, and learn more about optimizing your data workflows with AI.
This webinar is ideal for professionals seeking to harness the power of AI within their data management systems while ensuring high levels of customization and security. Whether you're a novice or an expert, gain actionable insights and strategies to elevate your data processes. Join us to see how FME and AI can revolutionize how you work with data!
Connector Corner: Seamlessly power UiPath Apps, GenAI with prebuilt connectorsDianaGray10
Join us to learn how UiPath Apps can directly and easily interact with prebuilt connectors via Integration Service--including Salesforce, ServiceNow, Open GenAI, and more.
The best part is you can achieve this without building a custom workflow! Say goodbye to the hassle of using separate automations to call APIs. By seamlessly integrating within App Studio, you can now easily streamline your workflow, while gaining direct access to our Connector Catalog of popular applications.
We’ll discuss and demo the benefits of UiPath Apps and connectors including:
Creating a compelling user experience for any software, without the limitations of APIs.
Accelerating the app creation process, saving time and effort
Enjoying high-performance CRUD (create, read, update, delete) operations, for
seamless data management.
Speakers:
Russell Alfeche, Technology Leader, RPA at qBotic and UiPath MVP
Charlie Greenberg, host
zkStudyClub - LatticeFold: A Lattice-based Folding Scheme and its Application...Alex Pruden
Folding is a recent technique for building efficient recursive SNARKs. Several elegant folding protocols have been proposed, such as Nova, Supernova, Hypernova, Protostar, and others. However, all of them rely on an additively homomorphic commitment scheme based on discrete log, and are therefore not post-quantum secure. In this work we present LatticeFold, the first lattice-based folding protocol based on the Module SIS problem. This folding protocol naturally leads to an efficient recursive lattice-based SNARK and an efficient PCD scheme. LatticeFold supports folding low-degree relations, such as R1CS, as well as high-degree relations, such as CCS. The key challenge is to construct a secure folding protocol that works with the Ajtai commitment scheme. The difficulty, is ensuring that extracted witnesses are low norm through many rounds of folding. We present a novel technique using the sumcheck protocol to ensure that extracted witnesses are always low norm no matter how many rounds of folding are used. Our evaluation of the final proof system suggests that it is as performant as Hypernova, while providing post-quantum security.
Paper Link: https://eprint.iacr.org/2024/257
Fueling AI with Great Data with Airbyte WebinarZilliz
This talk will focus on how to collect data from a variety of sources, leveraging this data for RAG and other GenAI use cases, and finally charting your course to productionalization.
In the realm of cybersecurity, offensive security practices act as a critical shield. By simulating real-world attacks in a controlled environment, these techniques expose vulnerabilities before malicious actors can exploit them. This proactive approach allows manufacturers to identify and fix weaknesses, significantly enhancing system security.
This presentation delves into the development of a system designed to mimic Galileo's Open Service signal using software-defined radio (SDR) technology. We'll begin with a foundational overview of both Global Navigation Satellite Systems (GNSS) and the intricacies of digital signal processing.
The presentation culminates in a live demonstration. We'll showcase the manipulation of Galileo's Open Service pilot signal, simulating an attack on various software and hardware systems. This practical demonstration serves to highlight the potential consequences of unaddressed vulnerabilities, emphasizing the importance of offensive security practices in safeguarding critical infrastructure.
Monitoring and Managing Anomaly Detection on OpenShift.pdfTosin Akinosho
Monitoring and Managing Anomaly Detection on OpenShift
Overview
Dive into the world of anomaly detection on edge devices with our comprehensive hands-on tutorial. This SlideShare presentation will guide you through the entire process, from data collection and model training to edge deployment and real-time monitoring. Perfect for those looking to implement robust anomaly detection systems on resource-constrained IoT/edge devices.
Key Topics Covered
1. Introduction to Anomaly Detection
- Understand the fundamentals of anomaly detection and its importance in identifying unusual behavior or failures in systems.
2. Understanding Edge (IoT)
- Learn about edge computing and IoT, and how they enable real-time data processing and decision-making at the source.
3. What is ArgoCD?
- Discover ArgoCD, a declarative, GitOps continuous delivery tool for Kubernetes, and its role in deploying applications on edge devices.
4. Deployment Using ArgoCD for Edge Devices
- Step-by-step guide on deploying anomaly detection models on edge devices using ArgoCD.
5. Introduction to Apache Kafka and S3
- Explore Apache Kafka for real-time data streaming and Amazon S3 for scalable storage solutions.
6. Viewing Kafka Messages in the Data Lake
- Learn how to view and analyze Kafka messages stored in a data lake for better insights.
7. What is Prometheus?
- Get to know Prometheus, an open-source monitoring and alerting toolkit, and its application in monitoring edge devices.
8. Monitoring Application Metrics with Prometheus
- Detailed instructions on setting up Prometheus to monitor the performance and health of your anomaly detection system.
9. What is Camel K?
- Introduction to Camel K, a lightweight integration framework built on Apache Camel, designed for Kubernetes.
10. Configuring Camel K Integrations for Data Pipelines
- Learn how to configure Camel K for seamless data pipeline integrations in your anomaly detection workflow.
11. What is a Jupyter Notebook?
- Overview of Jupyter Notebooks, an open-source web application for creating and sharing documents with live code, equations, visualizations, and narrative text.
12. Jupyter Notebooks with Code Examples
- Hands-on examples and code snippets in Jupyter Notebooks to help you implement and test anomaly detection models.
Essentials of Automations: Exploring Attributes & Automation ParametersSafe Software
Building automations in FME Flow can save time, money, and help businesses scale by eliminating data silos and providing data to stakeholders in real-time. One essential component to orchestrating complex automations is the use of attributes & automation parameters (both formerly known as “keys”). In fact, it’s unlikely you’ll ever build an Automation without using these components, but what exactly are they?
Attributes & automation parameters enable the automation author to pass data values from one automation component to the next. During this webinar, our FME Flow Specialists will cover leveraging the three types of these output attributes & parameters in FME Flow: Event, Custom, and Automation. As a bonus, they’ll also be making use of the Split-Merge Block functionality.
You’ll leave this webinar with a better understanding of how to maximize the potential of automations by making use of attributes & automation parameters, with the ultimate goal of setting your enterprise integration workflows up on autopilot.
The Microsoft 365 Migration Tutorial For Beginner.pptxoperationspcvita
This presentation will help you understand the power of Microsoft 365. However, we have mentioned every productivity app included in Office 365. Additionally, we have suggested the migration situation related to Office 365 and how we can help you.
You can also read: https://www.systoolsgroup.com/updates/office-365-tenant-to-tenant-migration-step-by-step-complete-guide/
Astute Business Solutions | Oracle Cloud Partner |
Summer 2013
1. continued on page 12
for Water & Wastewater Summer 2013
Esri News
Atlanta, Georgia, the ninth-largest metropoli-
tan area in the United States, has one of the
biggest and oldest water systems in the coun-
try. As such, the city delivers water to more
than one million customers through a network
of 2,700 miles of pipe. Three water treatment
plants (WTPs) serve the system. The service
area consists of three pressure zones. The
system includes water mains ranging from 2 to
72 inches in diameter, and some of the pipes
are 90 years old.
In a strategic effort to sustainably reha-
bilitate its aging system and increase system
control, the city decided to implement a
series of steps to fundamentally improve the
Department of Watershed Management’s
(DWM) infrastructure and work toward
Building Atlanta’s GIS
By Dax Flinn, City of Atlanta, Department of Watershed Management, and Ryan McKeon, Wachs Utility Services
integrating its GIS with its current legacy
and enterprise systems. To accomplish this,
DWM embarked on a series of major initia-
tives, which advanced the GIS program and
allowed it to provide a platform not only for
web-based viewing capabilities but also for
real-time field reporting and updating. To
achieve this goal, it first initiated an ambitious
and creative project in 2009 with the Valve
and Hydrant Asset Assessment Program.
Valve and Hydrant Asset
Assessment Program 2009–2012
For the first phase of this project, DWM
worked with Wachs Utility Services (WUS) and
Brindley Pieters & Associates and used ArcGIS
technology from Esri to focus on increasing
asset usability. This included the inventory,
repair, and documentation of 80,000 water
valves and fire hydrants in the system. This
first phase was completed in early 2012, and
while it was widely regarded as successful,
there remained an opportunity to increase in-
formation usability. Through 2012, the primary
information system of record was an atlas
of nonscaled plat card drawings. There had
been a previous effort in the 1990s to migrate
from paper to GIS, but data quality challenges
prevented the idea from gaining wide accept-
ance, and it eventually fell by the wayside.
To make full use of GPS and asset data
captured in the first phase of the project,
DWM commissioned a team of professionals
The City of Atlanta’s web mapping application provides an easy way to view information.
3. 3Summer 2013 esri.com/waterwrites
Elsinore Valley Municipal Water District
(EVMWD) has provided water service in
California’s Riverside County for 55 years.
EVMWD covers a 96-square-mile area
along the Interstate 15 corridor and has
approximately 40,000 water, wastewater, and
agricultural services satisfying a population
of approximately 133,000. It is anticipated
that water demand will double within 10 years.
EVMWD employs 160 dedicated staff.
In 2009, EVMWD went live with a customer
information system (CIS). This robust system
was designed to handle a number of customer
service workflows including the issuing and
processing of service orders. Over the next
year, the district identified areas in which it
would like to improve the CIS workflow pro-
cess. For example, a service order (SO) would
be completed in the field and subsequently
processed back in the office.
At the time, the procedure was to generate
an SO in the CIS, then print it out and hand it
off to the field personnel who would cover a
designated area of the district. The field per-
sonnel would then fill out information on the
paper forms, and at the end of the day that
information would have to be reentered into
the CIS manually by a dedicated staff member.
This created a situation of duplicate data
entry. Another challenge faced was when new
service orders and updates came in through-
out the day, there was no easy mechanism to
get that information out to the field other than
a phone call or summoning the field staff back
into the office. With an area of 96 square miles,
this became a logistics nightmare.
“We are looking to save time by not having
to complete the service orders in the office
and instead completing them in the field,”
said Tammy Ramirez, meter services super-
intendent. “We need a mechanism to move
information out to the field and then back into
the CIS in a more streamlined manner.”
The goal now was to look for a commercial
off-the-shelf (COTS) mobile workflow solution
that would integrate with the CIS and solve
the aforementioned issues. The district also
Serving Customers with a Mobile Work
Order System
Elsinore Valley Municipal Water District Goes Paperless
By James A. Ollerton, Water Employee Services Authority
Field Mapplet Mobile Highlighted Service Order
continued on page 4
Case Study
had interest in discovering a solution that
could satisfy additional criteria. The district
had a well-developed Esri-based GIS and
immediately realized the benefits of a solution
that would take advantage of the GIS data.
A computerized maintenance management
system (CMMS) was in place that was in need
of a GIS-based mobile component. The
district wanted a single mobile solution that
could address other field crew activity that did
not relate necessarily to the CIS or CMMS. As
can be seen from the criteria pattern so far,
it can be said that the district was looking to
support one mobile solution, thus reducing
the internal administrative challenges of sup-
porting multiple platforms. Finally, cost was
a key factor from a licensing standpoint, in
addition to the services involved, to do what
was needed.
EVMWD briefly considered the idea of
having the CIS accessible out in the field
through remote connection but quickly
rejected this idea due to a similar pilot effort
for remote connection of the CMMS. It was
decided from this pilot project that critical
workflow applications out in the field should
be able to perform in disconnected mode.
The district also was considering a mobile so-
lution sold as a separate module from the CIS.
It would satisfy the immediate need of the CIS
workflow issues but fell short of all the other
additional criteria. The district also looked
at other mobile platforms but was either not
impressed by the workflow architecture or felt
that the level of expertise was only in niche
workflows handled through the system and
would require major costs from an additional
consultant to make an integration successful.
Ultimately, EVMWD selected the Field
Mapplet solution from Spatial Wave.
EVMWD’s long history of involvement with
Esri’s Water/Wastewater group helped
the district learn of Spatial Wave. After
Spatial Wave had shown to the district the
solution and approach that it would take
4. 4 Esri News for Water & Wastewater Summer 2013
for integration, it was decided that this was
the right way to go. Another key factor that
played a role was the fact that the Field
Mapplet solution was GIS based and would
take advantage of the district’s mature
geodatabase. Another feature was the ability
to take advantage of ArcGIS web services and
the ability to execute ArcGIS geoprocessing
tasks.
“The GIS-based solution has helped in
areas where I didn’t even realize there could
be improvement; for example, the console
Field Mapplet Mobile Highlighted Service
Order
Service Order Summary Form in Field Mapplet
Serving Customers with a Mobile Work Order System continued from page 3
is a good managing tool where I can gauge
work visually with the GIS map and reallocate
work as needed,” said Carol Mallard, billing
specialist.
Now, district field services representatives
have full access to the robust GIS database
and construction drawings. Ultimately, the GIS
solution enabled the field crews from both
CIS and operations departments to obtain
and perform their work in the field. Some of
the key capabilities of integration with CIS
included the following:
•• The exchange of information between CIS
Infinity and Field Mapplet was in real time.
Customer service requests will show up on
the mobile units after synchronizing the unit.
•• The process of creating service orders in
CIS Infinity passed the information to Field
Mapplet in order that a service request can
be created in Field Mapplet.
•• Service orders could now be delegated
easily by area of responsibility.
•• Mobile printer configuration allows printing
of labels and door hangers on the fly, out in
the field.
•• Route optimizing saves time and resources.
•• The process of completing service requests
in Field Mapplet passed information to CIS
in order that the service order can be com-
pleted and the meter info can be updated
in CIS.
In addition, EVMWD is taking full advantage
of all the other extensions of Field Mapplet
including valve exercising, advanced fire flow
testing, underground service alerts, redlines,
and soon-to-be-implemented sewer line
cleaning. Also, EVMWD anticipates soon
having the Field Mapplet mobile GIS solution
completely integrated with the CMMS. With
all this spatial metadata now being collected
and more to come, the district has wasted no
time in developing reports and GIS viewing
services that display the data in a manner that
only engages the staff better and helps them
understand more about what is going on at
the district.
GIS has enabled the district to implement
a unified mobile solution to process customer
service workflows, CMMS work orders, and
other field workflows, such as underground
service alert ticket processing, which are not
managed by these systems. In addition, Field
Mapplet has replaced the district’s hard-copy
facility atlas data with a robust electronic
mobile atlas while allowing for redlining of
the data. Combining Esri technology and the
Spatial Wave solution has resulted in optimiz-
ing district resource utilization while continu-
ously improving the quality of the GIS.
5. 5Summer 2013 esri.com/waterwrites
Case Study
continued on page 6
It started as a free, public sewer infrastructure
map for Toms River, New Jersey. Len Bundra,
IT and GIS director for Toms River Municipal
Utilities Authority (TRMUA), built it in 2004.
Then, he kept adding layers. He added aerial
imagery, parcel data, and information from
agencies such as the New Jersey Department
of Transportation, the US Department of
Agriculture, and the US Census Bureau.
Bundra had one belief in mind: “If you build it,
they will become aware.”
He was right. When Hurricane Sandy
hit the East Coast of the United States in
October 2012, the map was suddenly the
go-to information source for emergency
responders, utilities, public works, private
surveyors, and local assessors. Bundra quickly
updated the map—known officially as the
Toms River Municipal Utilities Authority GIS
Map. He added poststorm satellite imagery
from the National Oceanic and Atmospheric
Administration (NOAA) along with current
floodplain delineations and Sandy high water
mark data from the Federal Emergency
Management Agency (FEMA).
“If You Build It, They Will Become Aware”
Integrated Web Map Aids Sandy Relief Efforts
By Jessica Wyland, Esri
NOAA imagery for the Barrier Island areas of Toms River. Above shows before Sandy. Below
shows after Sandy.
Anyone who needed to quickly get an
accurate picture of the Sandy situation could
click the TRMUA GIS Map. Bundra built it,
and people did come. Police and fire fighters
came to determine where to deploy resources.
Electric, gas, and water companies came
to decide where to start restoring services.
Homeowners, evacuated and eager to survey
the damage to their property, came to look
at before-and-after aerial photos. And, as
Bundra predicted, people most definitely did
become aware.
“The map served as a valuable resource for
the police department after Sandy,” said Mike
Burke, IT and 911 coordinator for the Toms
6. 6 Esri News for Water & Wastewater Summer 2013
River Police Department. “We relied on that
visual representation—the before-and-after
layers—to set up security perimeters and
determine where to place cement barriers.”
Since the TRMUA GIS Map was built on the
Esri ArcGIS platform and hosted by Amazon
Web Services, it provides virtually unlimited
power for analysis, collaboration, and spatial
data processing. For example, following the
storm, many outside contractors arrived on the
shores of New Jersey to restore the region’s
infrastructure. One group in particular was
engineers who needed to figure out the best
plan for repaving roads. The TRMUA GIS Map
helped them find their way around unfamiliar
areas. They were able to use the map to locate
important elements such as parcels, street
addresses, hydrants, and underground utilities.
In the weeks and months following Sandy,
the map continued to help. Utilities used it to
review parcel polygons on the barrier islands
to identify houses and neighborhoods that
“If You Build It, They Will Become Aware” continued from page 5
Before Bundra created the map, Otten said
TRMUA engineers had to sift through a room
of drawers with thousands of engineering
drawings for information or request data from
other departments or agencies. Often, they
would have to send out crews for field visits.
Now everything they need is on the computer
screen with an aerial basemap.
Otten says he can now view maps of all
430 miles of pipe, 9,600 manholes, and
18 pump stations, along with all attributes.
At a glance, he can see whether a pipe or
manhole has been inspected or rehabilitated
and then simply click to view an inspection
report or video. He can access various aerial
maps, including post-Hurricane Sandy and
aerial basemaps from as far back as 1930. He
can tell when a service lateral has been cut
were destroyed so those ratepayers would not
be charged for the year 2013. The map’s links
to FEMA flood advisory maps is helping af-
fected townships adopt a new flood insurance
risk map. Bundra also recently added a layer
to show houses that are slated for demoli-
tion and/or labeled uninhabitable to advise
citizens and utility companies on where to
focus rebuilding infrastructure.
For Bundra’s own company, the TRMUA
GIS Map continued to serve as a hub. “Simply
stated, the Toms River MUA GIS Map is a
comprehensive, one-stop shopping data-
base of all useful pieces of information for
everyone within TRMUA, as well as contrac-
tors, plumbers, consultants, and more,” said
Nicholas Otten, authority engineer for Toms
River Municipal Utilities Authority. “All various
pieces of data are centralized and accessible
by every TRMUA department within the office
or in the field.”
7. 7Summer 2013 esri.com/waterwrites
and capped and see the triangulated location
sketch of the curb cleanout.
The map shows all billing information, in-
cluding the recorded number of fixtures within
a building. It also shows pump station data
and the number of connections flowing to the
station, hundreds of pages of data on emer-
gency generators, wiring diagrams, pertinent
engineering drawings, and pump curves.
“With a few clicks, I am also able to generate
specific reports,” Otten said. “With GIS, I can
determine the approximate, average flow within
any given pipe segment. I can list pipes and
manholes by name. I can find the names and
mailing addresses of property owners within
200 feet of one of our construction projects.”
History of GIS at TRMUA
TRMUA began its GIS work in 2005 in an effort
to assemble 40 years of paper plans and files
into a centralized mapping interface. The
system was built entirely by in-house staff,
without the use of any outside consultants,
and was completed within two years.
All 9,600 of TRMUA’s sewer manholes had
exact coordinates verified in the field using
submeter GPS units. More than 600,000 line
and manhole attributes were entered into
an Esri geodatabase from more than 3,000
engineering plans.
In addition, an entire GIS parcel basemap
was created from scratch to include additional
elements not typically found on the tax maps.
For example, 3,000 individual condo units and
all major apartment buildings were added to
the basemap, which was then aligned to New
Jersey State US Geological Survey (USGS)
orthophotography.
The system is now available for all TRMUA
office staff across an internal network and to
all field staff via ruggedized laptop units.
“The GIS has increased operational efficiencies
across all departments by allowing instanta-
neous access to data that previously had to
be searched for amongst reams of paper files
and plans,” Bundra said. “The GIS also allows
our field crews access to all the information
they need to quickly assess and properly ad-
dress emergency situations.”
There are 2,558 points hyperlinked to post-
Sandy aerial oblique photographs from Civil
Air Patrol added to the TRMUA GIS Map.
Case Study
8. 8 Esri News for Water & Wastewater Summer 2013
The Washington Suburban Sanitary Commission (WSSC), headquar-
tered in Laurel, Maryland, recently used Esri technology to develop a
mobile application where customers can pay bills, report outages, and
check the status of a service request. The mobile solution increased
customer satisfaction by providing functionality 24/7 via iPhone,
Android, or BlackBerry smartphones.
Customers can use WSSC Mobile to pay all or a portion of their
bill, view bill and payment history, purchase watershed use permits,
and see a historical graph of actual household water consumption.
Customers can also report problems immediately to WSSC staff and
check for updates on service alerts in their area.
Established in 1918, WSSC is among the largest water and waste-
water utilities in the nation, with a network of nearly 5,600 miles of
freshwater pipeline and more than 5,400 miles of sewer pipeline. The
company serves 1.8 million residents through approximately 460,000
customer accounts. WSSC drinking water has always met or exceeded
federal standards. WSSC operates and maintains three reservoirs, two
water filtration plants, and six wastewater treatment plants.
“We needed a more efficient way to interact with customers without
tying them to desktop computers,” said Mujib Lodhi, chief information
officer for WSSC. “We also saw an opportunity to improve service and
repair operations using data gathered by customers’ mobile devices.”
The ability to report an outage—complete with location informa-
tion and images—is particularly useful to WSSC. It potentially adds
1.8 million pairs of eyes, those
of the customer base, to help
monitor nearly 11,000 miles of
water and wastewater system
infrastructure.
Within the customer contact
center, Lodhi said they anticipate
reductions in call volume and
call-handling times, as well as
the near elimination of the rou-
tine customer requests that can
be more easily handled through
the mobile application.
Quicker incident reporting
will lead to faster repairs, dol-
lars saved, and better service
for the community when it
comes to water incidents and
emergencies.
To build the mobile app,
WSSC used its existing industry-
standard web and Esri ArcGIS ar-
chitecture, the IBM WebSphere
suite for all Java 2 Enterprise
Edition (J2EE) applications, and
Oracle for the relational data-
base management system.
Mobile App Opens Customer Interaction
Washington Suburban Sanitary Commission
Using the WSSC mobile application, customers
can pay bills, report outages, and check the
status of a service request.
9. 9Summer 2013 esri.com/waterwrites
Partner Corner
Spatial Wave Software delivers high-quality,
innovative, GIS-based software products for
those seeking to maximize their investment
in ArcGIS from Esri. Spatial Wave Software
was formerly the products division of DCSE, a
California-based engineering and GIS consult-
ing firm, and has been an Esri partner since
1996. Spatial Wave products are designed
based on over 25 years of GIS experience
delivering solutions to water and wastewater
utilities.
The Spatial Wave product family includes
Mapplet, a robust workflow and operations
dashboard; Field Mapplet, a mobile workflow
solution; and Mapplet Library, a GIS-based
map and document management system.
Each of these solutions has the ability to work
independently of each other.
Field Mapplet is specially designed to
manage any workflow that spans office and
field, including underground service alerts,
work orders, customer service requests, peri-
odic monitoring, and inspections. MP/USA is
a configuration of Field Mapplet supporting
a utility’s one-call process. Field Mapplet
easily integrates with an organization’s tabular,
document, and Esri data environments.
Mapplet enables users across the enter-
prise to gain access to data and documents
from a spatial perspective. Mapplet is
integrated with ArcGIS API for Silverlight from
Esri. It allows you to gain access to data from
all aspects of your organization, including cus-
tomer service, field operations, engineering,
and finance, and any other enterprise data to
which you wish to connect.
Mapplet Library is a web-based application
for distributed sharing of thematic ArcGIS
maps. Mapplet Library has been deployed at
numerous water districts to make it easier to
find and view large libraries of maps already
Spatial Wave Software Benefits ArcGIS Users
created by multiple departments. It reduces
the technical proficiency needed and in-
creases the audience within your organization
who can benefit from GIS assets. In fact, in
the early days of Mapplet Library, thousands
of Esri International User Conference (Esri UC)
attendees were using the application at the
Map Gallery to submit and retrieve entries for
the Map Gallery competition.
Spatial Wave is a single vendor with exten-
sive experience providing proven, integrated
solutions and services for water and wastewater
utilities. Spatial Wave is known for providing a
cost-effective solution suite that is easy to use,
proven, efficient, and cost-effective to maintain.
Spatial Wave understands the needs of water
and wastewater agencies, anticipates the future
needs of a district, provides additional solutions,
and scales with each client’s needs.
Visit www.spatialwave.com.
GIS Platform and Powerful Organization Viewer
GIS for Spatially Enabled Workflows
Mobile Solutions for Utility Field Crews
10. 10 Esri News for Water & Wastewater Summer 2013
Residents of Collingwood in southern Ontario,
Canada, can rest assured that the water
distribution system they depend on is in good
hands thanks to a unique mobile application.
Developed using ArcGIS, the app supports
effective fire hydrant flushing throughout the
town—a central component to delivering
clean water.
Fire hydrant flushing is one of the most
important practices that can be performed on
a water distribution system and provides an
opportunity to check for leaks, proper valve
operation, corrosion and rust, water pressure,
and chlorine levels. If ignored, corrosion and
rust can cause serious public safety concerns,
not to mention threats to water quality.
In the town of Collingwood, fire hydrant
maintenance is carried out by Collingwood
Public Utilities/COLLUS Power, a municipally
owned utility that provides both water and
electricity services. With a commitment to
continuous improvement through innovative
business processes and technology, COLLUS
signed an enterprise license agreement (ELA)
with Esri Canada Limited so that it could cost-
effectively deploy multiple licenses of ArcGIS
and integrate the software into the weekly
and annual flushing program.
“Our field operations have rapidly evolved,”
said Jody Wilson, GIS technician, COLLUS.
“We’ve expanded from a few licenses to
running ArcGIS in 12 of our trucks. As a result,
we’re operating more productively, and our
ability to capture accurate data has grown by
leaps and bounds.”
Each week, operators flush out what’s
known as “dead end” hydrants—hydrants
located at the end of a street that receive
water from a single direction. These hydrants
must be checked on a regular basis to ensure
“We’re working more efficiently and are much better
equipped to demonstrate compliance. Our reports are
no longer based on assumptions. Through GIS, we’re
able to ensure complete accuracy when audited.”
—Jody Wilson, COLLUS
Securing Water Quality
through Mobile Mapping
By Barry Kelly, Esri Canada Limited
that they are fully functional and that chlorine
levels are in line with government standards.
Flushing the hydrants involves opening one
of the three ports of the hydrant and allowing
the water to flow wide open. Crews check
for ease of opening and closing, ensure that
water flow stops when the hydrant is shut
down, and check to see if remaining water
drains down below ground level into the sur-
rounding soil. If a hydrant does not perform
all these functions with ease, the hydrant is
flagged for repair.
To record results, operators use GPS-
enabled ruggedized mobile units that provide
access to basemaps; orthoimagery; and layers
of data such as parcels, property boundaries,
parks, and streets. When conducting a flush,
a new task is opened in ArcGIS, and the
operator fills out a series of attributes that
are pulled from the utility’s main database.
Attributes include the operator’s name, the
date of the flush, current chlorine levels, the
amount of water flushed, and the hydrant’s
pounds per square inch (PSI).
A user-friendly touch screen makes it quick
and easy to record the results of the inspec-
tion and move on to the next hydrant. Once
the operator returns to the office and is within
wireless range, all the new data is instantly
synced back to the main database.
Then models created using ArcGIS enable
data to be automatically calculated. For exam-
ple, the amount of waste resulting from a flush
can be instantly generated and included in
reports required for annual audits.
“We’re working more efficiently and are
much better equipped to demonstrate
compliance,” said Wilson. “Our reports are
no longer based on assumptions. Through
GIS, we’re able to report on exactly how many
hydrants were flushed, for what length of
time, as well as the volume of water flushed to
ensure complete accuracy when audited.”
In addition to weekly dead-end flushes,
COLLUS is responsible for conducting a bian-
nual inspection of the town’s 1,200 hydrants.
GIS is used to keep an up-to-date inventory of
the hydrants and analyze each asset’s history.
To carry out the biannual flushes, four trucks
are dispatched to different areas of the town.
Through shared access to the data, all four
11. 11Summer 2013 esri.com/waterwrites
operators can ensure that no hydrants are
missed during the inspection. When an asset
is identified as in need of repair, operators
mark this on the attribute form, and a call for
service is placed immediately.
Previously, operators would record data
by creating hand-drawn checklists in Excel
spreadsheets. The sheets would then be
stapled together, placed in a binder, and used
during the annual audit. Using this system,
the utility was not able to automatically call
up data, perform calculations, or analyze the
asset’s history.
“We can now pull up a five- to six-year his-
tory of a hydrant and proactively troubleshoot
any potential issues pertaining to that asset,”
said Wilson. “For example, if we receive a
complaint from a resident regarding a water
issue, we’re able to instantly view nearby
hydrants, check the condition, and see the
date of the last flush to get to the root of the
problem.”
In the near future, COLLUS will look at ex-
tending GIS capabilities to Apple and Android
devices so that operators in the field will be able
to capture data using smartphones or tablets.
Visit esricanada.com.
The Identify tool in ArcGIS is used on a
recently added hydrant inspection. The
Identify Results window shows inspections
dating back to 2007, which can be individually
selected and viewed by operators in the field.
Partner Corner
12. 12 Esri News for Water & Wastewater Summer 2013
Basic GIS Proves Innovative
in a Developing Country
By Rochelle Holm, Washington State University
Shallow well water
quality results from
Mzuzu, Malawi, are
plotted using ArcGIS.
On a recent rainy day, researchers were
huddled in a small laboratory in the Central
African country of Malawi, conducting water
quality analysis with onlookers eager for GIS
maps depicting the results. Few individuals
in Malawi are trained in GIS skills, and within
the university setting, GIS theory, rather than
practical application, is the standard.
In January 2012, a laboratory for water
quality testing was established at the
Mzuzu University Centre for Water and
Sanitation, Malawi, through a partnership with
Washington State University in the United
States. In Malawi, university attendance is
only 0.6 percent of the population, limiting
trained personnel in the water and sanita-
tion sector and those with GIS skills. In many
areas of Malawi, the risk to human health from
microbial drinking water contamination is not
known. This lack of data poses a unique chal-
lenge for governmental and nongovernmental
agencies working to protect human health
and the environment.
Basic skills in Esri’s ArcGIS technology were
recently used in combination with a water
quality investigation conducted in Mzuzu
in northern Malawi. Although the area has
municipal piped water service, shallow wells
are still used for drinking by some households.
ArcGIS provided a powerful and innovative
tool to visually depict the results of this
investigation as part of a risk communication
program. Results were reported back to
individual households at the conclusion of
the project as part of a targeted risk com-
munication program in an effort to encourage
behaviors that protect both human health and
the environment in this developing country.
Building Atlanta’s GIS continued from cover
to construct a water utility GIS. This phase of
the project focused on the consolidation of
data spread across 7,000 plat card drawings,
hundreds of thousands of inspection records,
and 80,000 GPS data points into a spatially
accurate, content rich, and widely available GIS.
In addition, DWM employed GIS to support
water network hydraulic modeling initiatives,
operations and maintenance activities, and
capital improvement planning.
The Valve and Hydrant Asset Assessment
Program named two key objectives: restore
Atlanta’s water distribution system of approxi-
mately 48,000 valves and 24,000 fire hydrants
to maximum operability, and develop a
GIS database with necessary water system
transmission and distribution asset records
and GPS locations to meet water utility asset
management and maintenance requirements.
Shallow well data collection is performed.
Phase I began in 2009. With a three-month
time limit, the team began preparing a base
of operations at the Peyton Road DWM Pipe
Yard. This included permitting, preparation of
the yard, procuring equipment, building ser-
vice trucks, setting up the computer network,
and all internal processes.
Phase II began during the final days of setup
at Peyton Road. Field Services included the
core scope of the primary objective to assess
48,000 valves and 24,000 hydrants and com-
plete in-scope repairs on valves. During these
assessments and repairs, more than 100 pieces
of data were collected on each asset, including
the GPS location. This data was compiled and
analyzed scrupulously to meet the needs of the
utility to complete a functioning GIS.
To reach assessment and repair goals, the
city first worked on pilot areas, then focused
on places where the hydrant flow was not per
the minimum standard.
By January 2012, the information services
team was delivering data on a weekly basis.
The first delivery of 12,511 assets and each
subsequent delivery only contained assets
that had gone through the entire assess-
ment cycle. This means that each valve and
hydrant in the delivery was exercised, made
accessible, repaired if necessary, and had its
GPS points logged. Furthermore, each piece
of data has gone through QA/QC and GIS
processes to ensure accurate information and
location for the asset.
Phase III began in April 2012 and included
utilizing the information for the valves and
hydrants collected under the Valve and
Hydrant Asset Assessment Program; the
group would create the geometric network
13. Mark Your Calendar
Esri International User Conference
July 8–12, 2013
San Diego, CA USA
www.esri.com/events/user-conference
National Rural Water Association H2O XPO
October 1–3, 2013
Louisville, KY USA
www.h2o-xpo.org
Water Environment Federation Technical Exhibition and
Conference (WEFTEC)
October 5–9, 2013
Chicago, IL USA
www.weftec.org
Pollutec Horizons
December 3–6, 2013
Paris, France
www.pollutec.com/GB.htm
On the Road
13Summer 2013 esri.com/waterwrites
Follow the Esri Water Community on Twitter
Keep up with the latest GIS news, especially as it relates to the
water industry, by following Esri on Twitter:
@esriteamwater
Watch Recorded Webinars
Visit esri.com/water and look under Announcements for new
webinars including Hydraulic Modeling and GIS and Services and
Solutions for the Water Utility Industry.
Access for Water Utilities
This website is for the ArcGIS water, wastewater, and storm water
utility community. It provides useful templates and best practice in-
formation enabling you to implement ArcGIS to manage your water
utility information, perform your daily operations, and support your
long-term planning.
Visit resources.arcgis.com/content/water-utilities.
Esri Onlinedepicting the pipes that connect the valves and hydrants together in a
functioning hydraulic network. This data, in conjunction with the DWM
plat cards showing pipe connections and relative pipe locations, was
used to build a geometric network for modeling the flow of water in
the water transmission and distribution system. Phase III was success-
fully completed in December 2012.
By the end of the project, the team had surpassed its goal by assess-
ing its targeted valves and hydrants on time, updated and vastly im-
proved the water distribution system GIS, and come in under budget.
Additional Benefits
Hospital Corridor
The city of Atlanta was in the process of replacing a bridge at
Peachtree-Dunwoody Road. Along that bridge is a main that
feeds seven hospitals. In the event that the main was disturbed,
the team wanted to be proactive and make sure there was a
secondary feed. It redirected a crew to locate certain valves that,
if necessary, could create a new zone to feed the hospitals. A crew
spent 1.5 days locating and making accessible seven valves along
the hospital corridor in Sandy Springs. Now, should there be a
disruption, the city can immediately execute the rezoning plans.
North Treatment Plant
The North Treatment Plant located in Johns Creek has a 48-foot
transmission main running 12 miles that feeds the city. A valve
replacement stopped treatment plant pumping for 24 hours. This
provided a perfect time to exercise valves along the main.
To take advantage of the downtime, a crew was sent out to
locate and identify all the city’s valves along the main. Making a
trip prior to shutdown allowed all the valves to be exercised in
a short period of time. Searching through woods and along the
400 Toll Road, 12 of 15 valves were located and made accessible.
The remaining three could not be found because of poor loca-
tion data. The team exhausted all standard locating techniques,
including the use of ground penetrating radar, in an extensive
search to find the last three. Instead, GPS was used to pinpoint
the area where the team believed them to be.
More Advancements
With the support of the executive offices within DWM, the GIS
Division has implemented a migration of the GIS datasets to
the ArcGIS Local Government Information Model; introduced
ArcGIS for Windows Mobile; purchased new data servers and
updated major application components; built a new web mapping
application called the Atlanta Land Information System (ATLIS);
integrated GIS and electronic documents and files with the DWM
Electronic Content Management System (ECMS); and is looking to
ArcGIS Online and its local government integration capabilities by
moving toward smartphones and tablets for increased integra-
tion of field reporting, viewing, and communication. It has been
an ambitious road, and the benefits can be seen by the wealth of
information now available to the department.