Location analytics-put-the-where
•
0 likes•863 views

Esri Location Analytics reveals relationships and patterns in enterprise data using location. It extends traditional applications by providing complete information and analysis. Location analytics allows businesses to maximize advertising dollars, governments to see spending patterns, and first responders to access digital floor plans during emergencies. Putting location at the center of analysis provides deeper insights, more powerful analytics, and richer information for improved decision making.

Recommended
Recommended
More Related Content
What's hot
What's hot (20)
Similar to Location analytics-put-the-where
Similar to Location analytics-put-the-where (20)
More from Esri
More from Esri (20)
Recently uploaded
Recently uploaded (20)
Location analytics-put-the-where
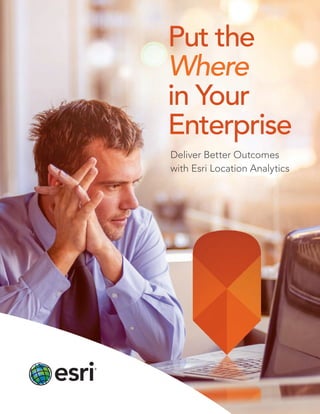
- 1. Put the Where in Your Enterprise Deliver Better Outcomes with Esri Location Analytics
- 2. Esri® Location Analytics reveals the where in corporate data. It extends the value of traditional applications. The result is access to complete information and analysis at every level. You unearth relationships, patterns, and trends that would otherwise remain buried. You make more accurate decisions. Visually. Businesses instantly see where to maximize their advertising dollars. Government agencies show taxpayers where and how they spend money. Fire fighters get the digital floor plan before they enter a burning building. Hospitals calculate demand for new vaccines or make sense of flu outbreaks. All by using the power of where. What Is the Question. Where Is the Answer. Business success in the current era of data overload requires better information combined with better analytics. But what is better? The answer is location. When you put where in your enterprise, a new world of understanding opens.
- 3. Deeper Insight See your data in new and provocative ways. Esri Location Analytics lets you visually explore and craft business intelligence far beyond putting dots on a simple map. Use geography to identify relationships and patterns that charts and graphs don’t reveal. Without smart maps, you’re only getting half the picture, and you could be losing ground to your competitors. More Powerful Analytics Map-driven analysis provides a new way to tackle an old problem—how to query and manipulate data. People at all levels of an organization can employ geography to view, analyze, and understand business performance. Take the risk out of business by asking new questions and getting precise answers. Richer Information Get the complete picture. GeoEnrichment allows you to take advantage of location in every type of decision. When you tap into demographics, lifestyle, business, and weather data, you create a more accurate and actionable plan for success. Add real-time visualizations when you need them. Big Data, Only Better Take back control of your big data. No matter the size and complexity of data, you can make the difficult easy and the complex consumable when you employ Esri Location Analytics. Location brings it together. Maps separate the usable from the unusable.
- 4. Every Industry, Every Need The global marketplace—business, government, energy, natural resources, and health care, etc.—today is beginning to recognize the value of mapping business activity. Managers, executives, and frontline staff can all use location analytics and map data for everything. • Business intelligence (BI) • Customer relationship management (CRM) • Enterprise resource planning (ERP) • Enterprise asset management (EAM) • Real estate planning • Field work force management • Risk management • Operational awareness
- 5. Location analytics improves: Retail: Compare sales territory revenue and profitability by region and location. Analyze marketing campaign effectiveness. See where customers live to determine where to open stores and distribute products. Insurance: Analyze Total Insured Value (TIV) by region. See revenue or losses by sales territory. Compare claims by market. Identify fraud by visually analyzing claims and incidents in a market. Perform risk analysis based on multiple variables. Financial: Examine total deposits, household savings, household automotive loans, and liquidity by region and branch. Grow line-of- business collaboration across departments with economic forecasts, neighborhood studies, and territory analysis. Energy: Improve service while reducing costs. Compare power outages and associated costs and anomalies in delivery. Employ customer location-based analysis on products and services to boost revenues. Transportation: Optimize route performance based on scheduled versus actual times; average revenue per seat; and percentage of late deliveries, buses, trains, or flights. Map customer transportation needs to streamline routes and service depots. Government: Make your agency transparent and accountable. Equip fire, police, and emergency managers with better information and preincident planning. Map location-based statistics about public- sector projects to help determine fund allocations. Health care: Quickly identify chronic illness and pandemic patterns. Provide community access to human services and information about service availability. Use maps to understand relationships between providers, employers, and consumers.
- 6. Open to Everyone Keep your data secure, but don’t tie it down. Set it free. All your systems. All your devices. One platform. Esri Location Analytics lets you safely infuse mapping into your enterprise with no disruption to your business systems. Whether it’s Microsoft Office® , IBM Cognos® , SAP® , Salesforce.com, or MicroStrategy® , your location analytics platform pillars them all. Custom Solutions Esri Location Analytics can also be easily embedded into enterprise systems using Esri services and technology. Business System Product Business Intelligence Esri Maps for IBM Cognos Esri Maps for MicroStrategy Esri Maps for SAP BusinessObjects Customer Relationship Management Esri Maps for Dynamics CRM Esri Maps for Salesforce Collaboration and Productivity Esri Maps for Office Esri Maps for SharePoint Focused Applications Esri Business Analysttm Esri Community Analyst
- 7. Do You Know Your Strategy? Esri is the world leader in location. Find out how organizations—and people like you—can start improving outcomes by putting where in their enterprise. Whether you have an extensive infrastructure or a point solution, Esri has the expertise to help you develop your location analytics strategy. Let us show you how. Get started at esri.com/locationanalytics.
- 8. Printed in USA Contact Esri 380 New York Street Redlands, California 92373-8100 usa 1 800 447 9778 t 909 793 2853 f 909 793 5953 info@esri.com esri.com Offices worldwide esri.com/locations Esri inspires and enables people to positively impact their future through a deeper, geographic understanding of the changing world around them. Governments, industry leaders, academics, and nongovernmental organizations trust us to connect them with the analytic knowledge they need to make the critical decisions that shape the planet. For more than 40 years, Esri has cultivated collaborative relationships with partners who share our commitment to solving earth’s most pressing challenges with geographic expertise and rational resolve. Today, we believe that geography is at the heart of a more resilient and sustainable future. Creating responsible products and solutions drives our passion for improving quality of life everywhere. Copyright © 2013 Esri. All rights reserved. Esri, the Esri globe logo, Business Analyst, @esri.com, and esri.com are trademarks, service marks, or registered marks of Esri in the United States, the European Community, or certain other jurisdictions. Other companies and products or services mentioned herein may be trademarks, service marks, or registered marks of their respective mark owners. 136553 ESRI?M6/13dg