1. for Water & Wastewater Winter 2014/2015
Esri News
continued on page 3
Coweta County field inspector Scotty Truitt inspects
a catch basin in a subdivision. The Collector for ArcGIS
app lets him document his findings.
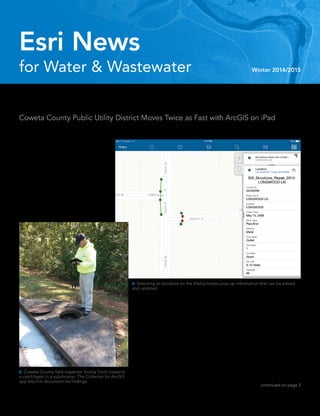
Selecting an attribute on the iPad prompts pop-up information that can be edited
and updated.
Coweta County sits 30 minutes south
of Atlanta, Georgia. Its horse farms and
gardens sustain a small-town feel; whatever
you need is just a short drive away.
“In other words, it’s a charming place
to live,” Coweta County stormwater
resources manager Brice Martin said. “A
lot of movie filming goes on here; The
Walking Dead has been filmed here for a
number of years. We are a south-metro
Hollywood, if you will.”
Double Time in Georgia
Coweta County Public Utility District Moves Twice as Fast with ArcGIS on iPad
Industrial and commercial
growth has exploded Coweta
County’s infrastructure in the
past 20 years. The population
more than doubled, to 130,000.
“The growth in all aspects of
our community has resulted in
us just trying to keep up with
infrastructure,” Martin said. “The
big thing is keeping up with our
assets and trying not to outpace
ourselves. We don’t want to get to
the point where we have a lot of
infrastructure going in and we are not able
to keep up with it.”
In just the past two years, something
else doubled: daily infrastructure inspec-
tions. Coweta County recently became
part of Metropolitan North Georgia Water
Planning District, resulting in stricter
regional mandates. To keep up with a new
annual inspection requirement—including
inspecting all urbanized infrastructure and
at least 10 percent of assets in unincorporat-
ed areas—the GIS department got creative.
3. 3Winter 2014/2015 esri.com/waterwrites
Double Time in Georgia continued from cover
GIS analyst Clint Richmond had an
idea. “I had looked into the news articles
Esri sends through e-mails,” Richmond
said. “The articles seemed to indicate
that the iPad was going to be real nice for
inspections.”
The iPad would prove to be twice as
nice, in fact.
Keeping Infrastructure
Peachy in Georgia
While Richmond explored the iPad as an
option, field teams had to be deployed
to respond to the new mandates. As
resources changed, though, so did the
availability of employees to inspect, and
soon just one person was responsible for
performing all inspections of more than
15,000 assets: Scotty Truitt.
Truitt operated on a clunky mobile
device with a small screen. Each morn-
ing, he checked out this mobile device
from the divisional office and drove
across the county to Richmond’s office
so Richmond could export the day’s GIS
data to Truitt’s device. At the end of the
day’s inspections, Truitt returned with
the device, let Richmond offload the data
into the GIS, and then drove back across
the county to his own office to deposit
the device before heading home.
“There would be a huge time savings if
[Truitt] could do it in real time on an iPad,”
Richmond said of the data transfers. “All I
would have to do was get the initial setup.”
Going Mobile
Coweta County started using ArcGIS for
Desktop in 2007 as a way of centralizing
departmental use of GIS in tax assess-
ment, public safety, and planning and
engineering. In 2013, the county got an
ArcGIS Online organizational account,
which Richmond thought would help with
inspections and user web applications.
Richmond tested the iPad himself
with ArcGIS software. Following the test
period, he asked the county to get Truitt
an iPad, and he set up the ArcGIS Online
organizational account with Esri. The
iPad connected with Coweta County’s
centralized GIS through the common
ArcGIS platform and the Collector for
ArcGIS app. Now Truitt could do some-
thing remarkable. He could perform daily
inspections without visiting Richmond.
His field data was uploaded instantly to
Richmond’s GIS through the Internet—no
more driving and exporting and im-
porting. “I don’t even have to see him,”
Richmond said. “I haven’t seen him in a
month now.”
In 2012, Truitt completed just over
50 inspections a day. In 2014, Truitt com-
pleted just under 100 inspections per day.
The iPad, which he got in 2013, has nearly
doubled his productivity.
Soft Water Gains
The project has been so successful that
Truitt finished all the mandated asset
inspections halfway through this year. He
even went beyond the mandated 10 per-
cent of rural inspections and completed
40 percent.
“The resulting increase in productiv-
ity is above and beyond our mandate,”
Martin said. “The asset information is
invaluable to the county, especially if we
have failure of infrastructure, allowing us
to be proactive.”
Truitt is getting a jump start on a
second set of regulatory initiatives—
mapping driveway pipelines—that
were not yet a priority. But the county is
making the most of Truitt’s freed time.
“There’s no big rush, just a year or so,”
Richmond said. “But we were like, Heck,
let’s just start finding them.”
So Truitt uses the Collector for ArcGIS
app on the iPad to find the driveway
pipes. Richmond added aerial layers to
Truitt’s basemap so Truitt has an even
easier identification tool.
“He can zoom in right where he’s at
and draw the pipe in,” Richmond said.
Not only is work getting done faster,
but Coweta County can also proactively
see where work needs to be done.
“It’s real nice for us not only for report-
ing to the state,” Richmond said, “but
also just knowing what’s out there and
what needs fixing.”
For more information,
contact contactus
@cowetawater.com.
Coweta County GIS analyst Clint Richmond configured the Collector for ArcGIS app with
multiple basemaps that can be used for field inspection. This aerial basemap provides a look at
the neighborhood in which the inspector is working.
4. 4 Esri News for Water & Wastewater Winter 2014/2015
Orange County infrastructure serves a huge population.
Orange County is California’s second most densely popu-
lated county and also the sixth most-populous county in the
United States. There, 3 million people reside along 40 miles
of coastline. More than 40 million tourists also arrive each year
for Orange County’s attractions, including Disneyland. The
demand this places on infrastructure is enormous.
The Orange County Sanitation District (OCSD) serves
2.6 million residents in 21 cities. The utility collects, treats, and
disposes of 207 million gallons of wastewater per day—nearly
80 gallons of water per resident.
Eliminating the Waste in Wastewater
Orange County Sanitation District Mobilizes Manhole Maintenance
with Trimble Handhelds
The infrastructure handling that load includes 579 miles of
sewer lines, 15 pump stations, two treatment plants, and five
miles of ocean outfall. Field operation crews use more than
8,000 manholes to access the infrastructure. To keep track of
all those manholes, pipe networks, and other assets, the OCSD
uses ArcGIS.
Knowing where infrastructure is isn’t enough, though.
Maintaining the vast OCSD network is an ongoing challenge. It
demands knowing what, if any, repair or maintenance work has
been performed.
The GNSS capabilities of the Trimble Juno
help improve the overall quality of OCSD’s sewer
network GIS during manhole inspection.
Orange County’s dense population clusters along the coastline and ebbs and flows with
millions of visitors each year.
5. 5Winter 2014/2015 esri.com/waterwrites
Your Stories
Until recently, the utility tracked and managed this informa-
tion manually.
Repairing the Manhole Management System
The OCSD inspects its 8,000 manholes every seven years. As
with any paper-based system, manual tracking of maintenance
and repair generated enormous amounts of documentation.
Not only that, this system also required manual data entry,
leaving it prone to human error and inaccuracy. Accessing
current and historical records was problematic, not to mention
slow. Another challenge was tracking progress. Field inspectors
took considerable time just determining which manholes had
already been inspected.
But the work was necessary. Manholes are essential to having
a smooth-running water collection system. A faulty manhole
could be vulnerable to infiltration from groundwater, which in
turn could cause corrosion, cave-ins, or other problems.
The OCSD decided that it needed to maintain, map, and
inspect its manholes digitally. It also wanted all manhole data to
be stored electronically in its central GIS. The solution therefore
lay in leveraging the software already being used: ArcGIS. It
could communicate with Trimble Connect, which the OCSD
implemented to run on Trimble Juno T41 handheld devices.
Nimble with Trimble: Saving Time and Resources
The OCSD needed a system that was accurate, reliable, and
easy to deploy. Trimble made it easy for the utility to adopt its
technology, beginning with its Manhole Inspector application.
Personnel now plan, manage, and dispatch manhole inspec-
tion jobs via the Trimble Connect web interface. Managers can
see who is working where and monitor the progress of field
activities. Spatial technology lets managers quickly and easily
dispatch resources directly to the right locations. Managers can
also access data gathered by field personnel as soon as the work
is completed and generate reports based on work completed
or required. The OCSD’s eight manhole inspectors use tools on
the Trimble Connect mobile app, including workflows to guide
them through processes and forms to complete their work.
The utility’s original paper form for manhole inspections
was incorporated electronically into Trimble Connect, with
additional fields to ensure the right information was captured.
Because operators were already familiar with the forms, they
easily transitioned to the new system. A three-week field test
produced feedback that was used to fine-tune the process
to meet OCSD’s unique needs and to confirm that there was
minimal or no risk involved.
Although Trimble Connect is supported on multiple plat-
forms, including iOS, Android, Windows, and Windows Mobile,
the OCSD selected the Trimble Juno handheld, which offers
Global Navigation Satellite System (GNSS) capabilities that
enable field inspectors to navigate to manholes more quickly
and easily—with accuracy of 1 to 2 meters (3 to 6 ft.). Inspectors
can also map the location of manholes more accurately for their
records. To further enhance data collection, OCSD inspectors
photograph manholes to record their appearance and condi-
tion—the Trimble Juno, with its built-in 8 MP camera, associates
GPS coordinates with photos.
Eliminating Paper, Saving Time and Trees
By automating its manhole management, the OCSD jokes that
it has saved a forest’s worth of trees. Not only that, but internal-
ly, it has also improved its GIS and streamlined communication
between colleagues in the office and the field, greatly decreas-
ing the need for trips between the two. The OCSD has certainly
improved efficiency and reduced errors to better serve the high
demand of Orange County residents and tourists.
For more information, visit
www.trimblewater.com.
The gloves can stay on! Electronic data entry on a rugged mobile
device is much easier than manual data entry with paper and a pen.
The Trimble Juno’s bright display and long-life battery allow inspectors
to work as long as they need to, all day.
6. 6 Esri News for Water & Wastewater Winter 2014/2015
EPCOR provides water and wastewater
service to more than a million Canadians.
Its subsidiary EPCOR Water serves more
than 300,000 people across Arizona
and New Mexico. Until recently, EPCOR
Water used three systems to maintain
more than 2,400 miles of water main
across 13 water districts and another
680 miles across 5 wastewater districts.
The data systems—CADD, GIS, and
paper maps—didn’t support cross-
reference querying. Due to the lack of
a standardized data model, it became
difficult to manage the main across many
districts.
Improving Operational Efficiency at
EPCOR Water with Web Maps
Christina Martinez and Jamie Patterson
communications and to comply with
regulations. In short, EPCOR needed
a standard way of producing and
analyzing maps and reports.
The GIS team saw a challenge in
managing a large number of personal
geodatabases—one for each of its
13 water and 5 wastewater districts. While
this approach to data management often
solved the issue of multiuser editing, it was
not always the case. It was difficult to imple-
ment changes to the common data model
across so many separate geodatabases.
Furthermore, the geodatabases were
stored on a file server, so performance was
not optimal, nor was security ideal. Map
display and scales were limited. There was
no way to share data quickly. Engagement
and feedback were limited. In short, the GIS
wasn’t operating at its fastest, and trying
to implement even a small change across
the separate geodatabases proved a huge
challenge.
The GIS team emerged with a plan.
Senior GIS technician Jamie Patterson,
two GIS interns, and local consulting
firm Engineering Mapping Solutions
(EMS) converted each of EPCOR Water’s
districts from the various CADD and GIS
formats into a common data model.
Through the process, the team was
able to produce a variety of updated
maps and reports. Initially these fed
the need for standardized reporting to
EPCOR Water’s rate regulator. But the
utility’s leadership noticed the high-
quality reports also supported internal
decision making. They wondered wheth-
er moving to a web-based GIS would
offer even more opportunities internally,
for instance, solving the problem of
having to request a map or report from
the GIS team each time one was wanted.
The process was time-consuming anyway.
Being in two states meant EPCOR Water
leaders sometimes had to wait longer
simply because of where the service
spanned, and the final product could
take several iterations to finalize.
Not only that but “there is only so
much data and detail that one can view
in a PDF or paper map of a distribution
“Multiply this across more than a
dozen water and wastewater districts,”
GIS manager Christina Martinez said,
“and then it becomes really challenging!”
EPCOR Water’s GIS Journey
CADD-GIS combinations are common
in utilities. But without a common data
model, EPCOR Water’s workflows slowed.
CADD and GIS didn’t have the same
level of dataset completion. And after
the 2009 postconstruction boom, EPCOR
Water had less money to undertake a
large-scale CADD-to-GIS conversion. The
utility needed to access its distribution
and collection system maps, and it
needed to standardize reports for internal
EPCOR is headquartered in Edmonton, Alberta, and serves communities in western
Canada and the Southwest United States.
EPCOR Water utility worker Mark Stevens
utilizes the EMS Web Map to view the water
distribution network while in the field.
7. 7Winter 2014/2015 esri.com/waterwrites
Your Stories
or collection system,” Martinez said.
“Having the ability to do things that GIS
professionals take for granted, such as
toggling layers and querying data, was
seen as a need for staff, especially in
Operations and Engineering.”
Migrating to Maps and Apps
from Desktop
EPCOR Water procured ArcGIS for Server
in fall 2012. EPCOR used Esri’s three-day
jump start program and, with support from
the utility’s IT resources headquartered in
Edmonton, made the move from file-
server-based, individual geodatabases to
a consolidated single SDE geodatabase
housed in a SQL server. Then came testing.
EPCOR Water brought in EMS to sup-
port the transition. The team members
tested web map functionality. They
ultimately deployed three instances of
the Silverlight Web Viewer, one each for
central Arizona, western Arizona, and
New Mexico. Staff throughout the utility
could unlock GIS data in the highly ac-
cessible viewer and request apps. Staff
members themselves could do queries
that once fell on the GIS team to perform.
“Staff no longer have to send requests
for custom maps or queries,” Martinez said.
All EPCOR Water staff, regardless of
location, could access the web maps. GIS
team members visited each site to demon-
strate how to use ArcGIS for Server. Having
non-GIS employees using the database
created a paradigm shift in the way staff
thought about GIS. Employees were
used to a several-month lag between GIS
updates and newly published hard-copy
map books. Now, not only was the data
current but also staff anywhere could visual-
ize changes in the system through the web
maps, sometimes cutting the lag time to
days.
In addition, web maps offered interac-
tivity. Users queried for themselves and
toggled layers, spurring employees to
think about the benefits additional layers
or apps could provide. Realizing there
would be no way to combine every great
idea into a single viewer, the GIS team
looked to take yet another step forward.
EPCOR Water adopted a cloud hybrid
of ArcGIS Online, with configurable
hosted apps and locally hosted feature
and map services, in early 2014. The
cloud-based GIS further reduced the
utility’s need for paper workflows, and
it improved security and enabled GIS
to go beyond even Operations and
Engineering. Customer service rep-
resentatives, the executive team, and
finance and rates staff could access,
manipulate, share, and interact with
data that had once been locked from all
except three GIS specialists.
The GIS team members looked for the
best first step to implement cloud-based
GIS internally. They started by implement-
ing ArcGIS for Water Utilities, a solution
that helped them configure the EPCOR
Water ArcGIS Online portal. With help from
Esri staff, the GIS team members focused
first on solving problems of inefficient and
paper-intensive processes. This involved
configuring an operations dashboard for
maintenance tracking. They created a red-
line and map-feedback app for field opera-
tions and engineering and an information
lookup app for customer service staff. Each
of these workflows had required copious
amounts of paper. Sometimes map labels
were so tiny, for instance, customer service
representatives had trouble reading them.
These are ongoing projects.
For the Future
“In order for GIS programs to continue to
mature, it is important to reflect on les-
sons learned along the way,” Patterson
said. He recommends starting with high-
impact projects.
EPCOR Water focused on an internal
and external paradigm shift. The GIS
team members gained ideas and insights
from their colleagues, who, for the first
time, could communicate with EPCOR
Water’s data. “Understanding the needs
of the user community is a key to suc-
cess,” Patterson said.
For more information,
contact Christina
Martinez, GIS manager, at
clmartinez@epcor.com and
Jamie Patterson, senior GIS
technician, at jbpatterson
@epcor.com.
One of the apps in EPCOR Water’s ArcGIS Online platform is a redline tool. Users can give
feedback on the map by using the arrow tools, or use the redline layers to provide a field sketch.
8. 8 Esri News for Water & Wastewater Winter 2014/2015
Since 1972, the Northeast Ohio Regional
Sewer District (NEORSD) has been re-
sponsible for collection, conveyance, and
treatment of wastewater and combined
sewer overflow control in the Greater
Cleveland area. To support many busi-
ness activities, a comprehensive storm-
water asset inventory was needed. The
district had to build a reliable inventory
with the ability to grow—fast.
To start development of the inventory,
NEORSD relied on a variety of informa-
tion sources: community maps, local
and national datasets, and community
images. Combined, these produced a
rough picture of the regional and local
stormwater system, from streams to
outfalls to culverts and sewers.
Cleveland Rocks Its Stormwater Inventory
A 40-Year-Old Utility Develops Comprehensive Inventory and Inspection of
Regional Stormwater Assets
Jeffrey Duke, P.E. GISP Manager of GIS Services
However, having multiple data sources
created a variety of inconsistencies and
challenges. Datasets varied in accuracy
and the frequency with which each
had been updated. Some were more
complete than others. District GIS staff,
consultants, and external stakeholders
had attempted several project-specific
inventory and inspection efforts. But
each of these had used a separate data
model, inspection format, and asset
labels. What was called a “culverted
stream” in one inventory might be called
a “storm sewer” in another.
Last year, the district implemented a
once-and-for-all program to consolidate
its information, capture a clear picture of
the wastewater system, and maximize its
performance.
Initial Inspection and Inventory
In 2013, NEORSD instituted its regional
Stormwater Management Program
(SMP). One of the program’s goals was to
understand the condition of the regional
stormwater assets—each one. The SMP
assets spanned more than 350 square
miles, 56 communities, and four coun-
ties. To quickly develop the inventory,
multiple third-party field crews were
deployed simultaneously to inspect more
than 300 miles of streams. They updated
asset inventory, performed baseline
inspections, and noted observations that
may affect stream system operations
and management. A crew member might
note erosion, debris, or exposed utilities,
for instance.
Project managers see at a glance the percentage of miles completed, thanks to a GIS dashboard feeding real-time intelligence to their screens.
9. 9Winter 2014/2015 esri.com/waterwrites
Your Stories
The data flowed (pun intended) in
huge volumes. NEORSD relied heavily on
the ArcGIS platform (especially ArcGIS
Online) to manage the data flow. The
district had issued inexpensive Android
tablets to crews, letting them access,
analyze, report, and manage information
related to stream channels, conduits,
inlets, and outlets. NEORSD populated
the devices with GIS data, map tile
caches of orthophotographic imagery
and stream assets, and other tools cre-
ated using ArcGIS for Server.
Each night, the data was synced to the
cloud. From the cloud, Python scripts
downloaded the data into ArcGIS feature
classes. Each week after quality assur-
ance and quality control checks, staff
uploaded the data into an ArcGIS Online
app. Then the process was repeated.
NEORSD was building a comprehensive
geodatabase on ArcSDE, part of ArcGIS
for Server. The geodatabase was inte-
grated with the district’s enterprise GIS
database (on Oracle). Each week, the field
crews added to the geodatabase new in-
formation from their inventory inspections.
In September 2013, the SMP was put
on hold. Legal rulings had stopped the
contract supplying the field crews. Two-
thirds of the stream system (~ 200 miles)
still needed the inventory and inspection
activities completed. In just 100 miles,
the crews had made more than 7,000
observations. NEORSD realized the long-
term value of continuing the inventory,
so it used in-house staff to complete the
project. Inventory and inspection activi-
ties have continued from October 2013
to today.
A Living Inventory
The comprehensive inventory will
not stop after the full 300 miles have
been inspected. The district continues
uploading new inspection information
on a daily basis. In addition, technology
updates are modernizing how NEORSD
accomplishes its updates. The district
invested in iOS tablets (iPad minis with
built-in Wi-Fi) for users to access the
ArcGIS Online applications. Staff built
web maps for accessing the data, so
their colleagues can directly edit, share,
and manipulate data from their devices.
Recently, NEORSD adopted Collector
for ArcGIS to facilitate inventory collec-
tion and record observations. That data
gets loaded instantly to the cloud, giving
management staff an eye into the field
from anywhere there’s Internet access.
The district also uses Operations
Dashboard for ArcGIS. This gives a full
view of the status of field inspections and
other project-related efforts. When crews
perform stream walks on a watershed-by-
watershed basis, for instance, Operations
Dashboard lets managers view total
observations, severity of conditions, and
total mileage of streams with pending
and completed inspections.
The district—once without any inven-
tory—now has one that changes with
the times. Data collection is efficient and
effective, and NEORSD staff in the field
and the office access real-time data to
manage their projects and make their
decisions. Data management, quality as-
sessment and control, and project follow-
up have been improved. Staff have clarity
and consistency in asset inventory and
inspection data, project summaries, and
statuses. Efficiencies have been realized
through the minimization of staff time
spent creating status reports.
This stormwater inventory project
is just the start. District GIS staff have
received many requests for more tools to
support other NEORSD initiatives.
For more information,
contact Jeffrey Duke,
PE, GISP—GIS Services
manager (GIS@neorsd
.org); Brian Villers, GIS
technician/ArcGIS Online
administrator (villersb
@neorsd.org); or Monica
Day, GIS supervisor
(daym@neorsd.org).
NEORSD inspected more than 300 miles of streams across 56 communities by using Collector
for ArcGIS.
10. 10 Esri News for Water & Wastewater Winter 2014/2015
Enterprise asset management (EAM) and GIS can collaborate
when integrated the right way. EAM provides rich information
about assets over their life cycle, and GIS provides the spatial
perspective to understand those assets: Where are they? What
surrounds them? What’s moving toward them that may put them
at risk? When organizations combine EAM and GIS, they typically
see these benefits and more.
Some say GIS takes EAM to the next level. GIS lets you
visualize today’s health and status of assets, driven by the
maintenance and monitoring of data collected that persists in
the EAM system. It moves EAM beyond the limitations of a his-
torical view of assets, to a current, operational one. Companies
no longer have to let assets fail silently over time, which occurs
when impending failures are not detected early enough for
staff to plan a repair or replacement. Monitoring devices have
become more affordable, meaning a distressed asset can be
identified through condition monitoring in the EAM system.
Assets in trouble can be proactively managed and visual-
ized with GIS. Combining EAM with GIS provides insight into
managing assets, revealing things that are often overlooked or
cannot be detected by visual inspection alone. Early detection
is a cornerstone to improving asset reliability.
Why You Need a Map When You’re
Just Doing Maintenance
Yes, You Need a Map
Maps are pervasive in our lives. The next-generation utility em-
ployee feels comfortable entering, interpreting, and acting on
data using visualization tools, particularly maps. And why not?
Today, tools exist to help users understand asset condition in
the spatial context of planned and current work in the environ-
ment and the community. Maps can minimize crew travel times
by optimizing routes and address-related work duties such as
responding to a customer call or equipment failure.
Take the case of an EAM system that monitors equipment
distress and severity. Time-sensitive repairs should get top
priority and response. The GIS can display levels of distress
and duration through graduated symbology. Add to that more
context—a layer of approaching weather, for instance—and the
response plan can improve the outcome to the best possible,
given all available information.
So you really do need a map. Spatial analytics are fast
becoming integral to managing assets. Spatial queries and
clustering techniques help determine whether a problem is
isolated or related to the bigger system and, thus, a bigger
issue. Real-Time Analytics (RTA) helps even new employees do
their work better, faster. GIS and EAM together make us better
equipped to tackle the most important work at the right time,
in the right way.
Maximo Escalations—Transformer Assets Down
11. 11Winter 2014/2015 esri.com/waterwrites
Chart Your Course in the Cloud Age
Integrating GIS and EAM is not simple without a plan. Making
these systems function in complementary roles is critical to
providing the right business value for the investment. IT spend-
ing has come under great scrutiny over the past few years. It is
the responsibility of us all to invest wisely and record successes.
GIS and EAM together can help determine and improve the
financial results of the business.
This doesn’t have to be hard. Out-of-the-box integration is
available for IBM Maximo Spatial Asset Management (EAM)
Risk Mitigation—Critical Load Transformers at Risk Due to Storm Surge
caption to come
and Esri’s ArcGIS for Server (GIS). More than 50 sites globally
are deploying this configuration.
We are in a new age—a cloud age. We must leverage cloud stor-
age, spatial analytics, mobile data tools, social responsibility, and
information security. We must adapt to our environment, to sustain-
able management of assets and infrastructure. Bringing EAM and
GIS together can yield a productive, responsible, and safe future.
This perspective was written by Gary Cooper, IBM client tech-
nical specialist (gacooper@us.ibm.com), and Terry Saunders, IBM
worldwide utilities industry leader (terry.saunders@us.ibm.com).
The Meeting You Love Is Expanding
Register for the Inaugural Esri Water Conference
After 20 years of Team Water/Wastewater Meetings, we’re creating
a full conference around our February gathering. This is the same
great meeting you remember, only enhanced.
In addition to collaborating with your peers and growing your
network, you’ll get hands-on training in the latest Esri products and solutions. Take away best practices for emergency
response, infrastructure management, inspection location data, and cost recovery. Plan your capital improvements
better, learn about environmental stewardship, and take on big data. Mobilize your workforce with web-based technol-
ogy that runs on easy applications and learn from the experts how to configure apps for your utility.
Join us at the 2015 host utility, Portland Water Bureau, February 10–12. Register today at esri.com/events/water.
Your Stories