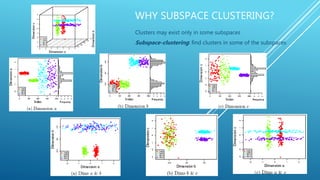
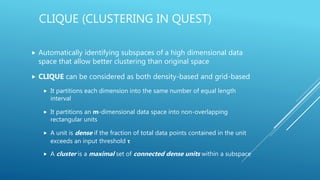
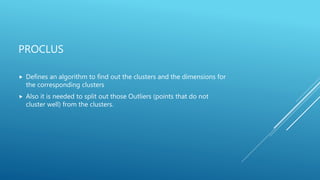
COMPARATIVE STUDY OF
SUBSPACE CLUSTERING
ALGORITHMS
NABIL ALSAADI
WASEEM HIJAZI
THE CURSE OF
DIMENSIONALITY
 Data in only one dimension is relatively packed
 Adding a dimension “stretches” the points
across that dimension, making them further
apart
 Adding more dimensions will make the points
further apart—high dimensional data is
extremely sparse
 Distance measure becomes meaningless
WHY SUBSPACE CLUSTERING?
Clusters may exist only in some subspaces
Subspace-clustering: find clusters in some of the subspaces
WHY SUBSPACE CLUSTERING?
 When the number of dimensions increases,
 the distance between any two points is nearly the same
This is the reason why we need to study subspace clustering
 Most known clustering algorithms cluster the data base on the
distance of the data.
 Problem: the data may be near in a few dimensions, but not all
dimensions.
 Such information will be failed to be achieved.
SUBSPACE CLUSTERING METHODS
 Subspace search methods: Search various subspaces to
find clusters
 Bottom-up approaches (clique)
 Top-down approaches (proclus)
CLIQUE (CLUSTERING IN QUEST)
 Automatically identifying subspaces of a high dimensional data
space that allow better clustering than original space
 CLIQUE can be considered as both density-based and grid-based
 It partitions each dimension into the same number of equal length
interval
 It partitions an m-dimensional data space into non-overlapping
rectangular units
 A unit is dense if the fraction of total data points contained in the unit
exceeds an input threshold τ
 A cluster is a maximal set of connected dense units within a subspace
Salary
(10,000)
20 30 40 50 60
age
54312670
20 30 40 50 60
age
54312670
Vacation
(week)
age
Vacation
30 50
 = 3
PROCLUS
 Defines an algorithm to find out the clusters and the dimensions for
the corresponding clusters
 Also it is needed to split out those Outliers (points that do not
cluster well) from the clusters.
INPUT AND OUTPUT FOR
PROCLUS
 Input:
 The set of data points
 Number of clusters, denoted by k
 Average number of dimensions for each clusters, denoted by L
 Output:
 The clusters found, and the dimensions respected to such clusters
PROCLUS
 Three Phase for PROCLUS:
 Initialization Phase
 Iterative Phase
 Refinement Phase
INITIALIZATION PHASE
 Choose a sample set of data point randomly.
 Choose a set of data point which is probably the medoids of the
clusters
MEDOIDS
 Medoid for a cluster is the data point which is nearest to the center
of the cluster
INITIALIZATION PHASE
All Data Points
Random Data Sample
Choose by Random
Size: A × k
The medoids found
Choose in Iterative Phase
Size: k
the set of points including Medoids
Choose by Greedy Algorithm
Size: B × k Denoted by M
GREEDY ALGORITHM
 Avoid to choose the medoids from the same clusters.
 Therefore the way is to choose the set of points which are most far
apart.
 Start on a random point
ITERATIVE PHASE
 From the Initialization Phase, we got a set of data points which should
contains the medoids. (Denoted by M)
 This phase, we will find the best medoids from M.
 Randomly find the set of points Mcurrent, and replace the “bad” medoids from
other point in M if necessary.
 For the medoids, following will be done:
 Find Dimensions related to the medoids
 Assign Data Points to the medoids
 Evaluate the Clusters formed
 Find the bad medoid, and try the result of replacing bad medoid
 The above procedure is repeated until we got a satisfied result
REFINEMENT PHASE-
HANDLE OUTLIERS
 For each medoid mi with the dimension Di, find the smallest
Manhattan segmental distance i to any of the other medoids with
respect to the set of dimensions Di
 jiDiji mmd i
,min 
 i is the sphere of influence of the medoid mi
 A data point is an outlier if it is not under any spheres of influence.
THE END

Subspace clustring

  • 1.
    COMPARATIVE STUDY OF SUBSPACECLUSTERING ALGORITHMS NABIL ALSAADI WASEEM HIJAZI
  • 2.
    THE CURSE OF DIMENSIONALITY Data in only one dimension is relatively packed  Adding a dimension “stretches” the points across that dimension, making them further apart  Adding more dimensions will make the points further apart—high dimensional data is extremely sparse  Distance measure becomes meaningless
  • 3.
    WHY SUBSPACE CLUSTERING? Clustersmay exist only in some subspaces Subspace-clustering: find clusters in some of the subspaces
  • 4.
    WHY SUBSPACE CLUSTERING? When the number of dimensions increases,  the distance between any two points is nearly the same This is the reason why we need to study subspace clustering  Most known clustering algorithms cluster the data base on the distance of the data.  Problem: the data may be near in a few dimensions, but not all dimensions.  Such information will be failed to be achieved.
  • 5.
    SUBSPACE CLUSTERING METHODS Subspace search methods: Search various subspaces to find clusters  Bottom-up approaches (clique)  Top-down approaches (proclus)
  • 6.
    CLIQUE (CLUSTERING INQUEST)  Automatically identifying subspaces of a high dimensional data space that allow better clustering than original space  CLIQUE can be considered as both density-based and grid-based  It partitions each dimension into the same number of equal length interval  It partitions an m-dimensional data space into non-overlapping rectangular units  A unit is dense if the fraction of total data points contained in the unit exceeds an input threshold τ  A cluster is a maximal set of connected dense units within a subspace
  • 7.
    Salary (10,000) 20 30 4050 60 age 54312670 20 30 40 50 60 age 54312670 Vacation (week) age Vacation 30 50  = 3
  • 8.
    PROCLUS  Defines analgorithm to find out the clusters and the dimensions for the corresponding clusters  Also it is needed to split out those Outliers (points that do not cluster well) from the clusters.
  • 9.
    INPUT AND OUTPUTFOR PROCLUS  Input:  The set of data points  Number of clusters, denoted by k  Average number of dimensions for each clusters, denoted by L  Output:  The clusters found, and the dimensions respected to such clusters
  • 10.
    PROCLUS  Three Phasefor PROCLUS:  Initialization Phase  Iterative Phase  Refinement Phase
  • 11.
    INITIALIZATION PHASE  Choosea sample set of data point randomly.  Choose a set of data point which is probably the medoids of the clusters
  • 12.
    MEDOIDS  Medoid fora cluster is the data point which is nearest to the center of the cluster
  • 13.
    INITIALIZATION PHASE All DataPoints Random Data Sample Choose by Random Size: A × k The medoids found Choose in Iterative Phase Size: k the set of points including Medoids Choose by Greedy Algorithm Size: B × k Denoted by M
  • 14.
    GREEDY ALGORITHM  Avoidto choose the medoids from the same clusters.  Therefore the way is to choose the set of points which are most far apart.  Start on a random point
  • 15.
    ITERATIVE PHASE  Fromthe Initialization Phase, we got a set of data points which should contains the medoids. (Denoted by M)  This phase, we will find the best medoids from M.  Randomly find the set of points Mcurrent, and replace the “bad” medoids from other point in M if necessary.  For the medoids, following will be done:  Find Dimensions related to the medoids  Assign Data Points to the medoids  Evaluate the Clusters formed  Find the bad medoid, and try the result of replacing bad medoid  The above procedure is repeated until we got a satisfied result
  • 16.
    REFINEMENT PHASE- HANDLE OUTLIERS For each medoid mi with the dimension Di, find the smallest Manhattan segmental distance i to any of the other medoids with respect to the set of dimensions Di  jiDiji mmd i ,min   i is the sphere of influence of the medoid mi  A data point is an outlier if it is not under any spheres of influence.
  • 17.