Downloaded 11 times
![89
Estrella, M.C.P., Mantaring, J.B.V. and David, G.Z. (2000). A double blind, randomized
controlled trial on the use of malunggay (Moringa oleifera) for augmentation of the volume of
breast milk among non-nursing mothers of preterm infant. The Philippine Journal of Pediatric,
49: 3-6.
Eustace, A., Iyayi, O., Oluwakemi, O. and Odueso, M. (2003). Response of some metabolic and
biochemical indices in rabbitsfed varying levels of dietary cyanide. African Journal of
Biomedical Research, 6(1): 43-47.
Fahey, J.W., Zakmann, A.T. and Talalay, P. (2001). The chemical diversity and distribution of
glucosinolates and isothiocyanates among plants. [Corrigendum: phytochemistry,(59): 200- 237].
Famounyan, R.T. and Meffega,F. (1986). Cassava by – products in Rabbit and Sheep Diets.
Proceedings of Workshop held at Ryall’s Hotel, Blantyre, Malawi.
Farinu, G.O., Ojebiyi, O.O., Akinlade, J.A., Ajibola, H.O.and Olaniyonu,B.I. (2008). Evaluation
of thenutritive potential of pigeon pea (Cajanus cajan) grain and leaf meals on growth
performance of pre-pubertal rabbits. Bowen Journal of Agriculture, 5: 102-108.
Fasuyi, A.O. and Aletor, V.A. (2005). Varietal composition and functional properties of cassava
leaf meal and leaf protein concentrates. Pak. J. Nutri., 4 : 43 – 49.
Femandez – Carmona, J., Cervera,C. and Blas, E. (1996). High fat diets for rabbit breeding does
housed at 300
C – Proc. 6th
World Rabbit Cong., Vol. 1: 167 (July 9 – 12), Toulouse, France.
Fielding, D. (1991). Rabbits:In Tropical Agricultural Series C.T.A. / Macmillan Education
Ltd.London,pp 39-50.
Foidl, N., Makkar, H.P.S. and Becker, K. (2001). The potential of Moringa Oleifera for
agricultural and industrial uses. In: Fugile, L.J. (ed). The miracle tree: the multiple attributes of
Moringa.CTA. Publication. Wageningen, The Netherlands, pp 45-76.
Forbes, J.M. (1995). Voluntary Food Intake and Diet Selection in Farm Animals. CAB
International, Wallingford, U.K., pp. 7-8.
Frandson, R.D. (1986). Anatomy and Physiology of FarmAnimals, 4th
Edition. Lea and Febilger.
Pennsylvania, USA.,pp 240-242.
Fuglie, L. (1999). Producing food without pesticides: local solution to crop pest control in West
Africa. CTA., Wageningen, The Netherlands.
Fuglie, L.J. (2001). Natural Nutrition for the Tropics. In: Fubalie, L.J. (ed). The Miracle Tree:
The Multiple Attributes of Moringa. CTA Publication,Wageningen, The Netherlands, pp 103-
115.](https://image.slidesharecdn.com/study-moringa-diet-for-rabbits-150210054607-conversion-gate01/85/Study-moringa-diet-for-rabbits-104-320.jpg)

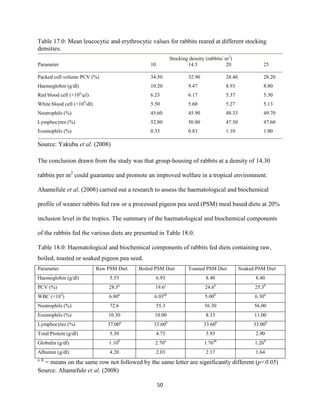
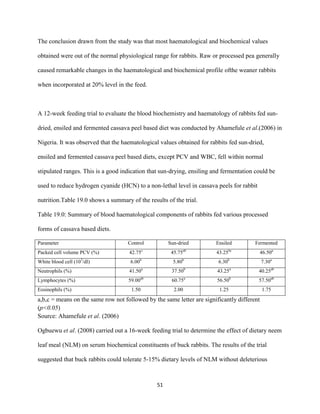
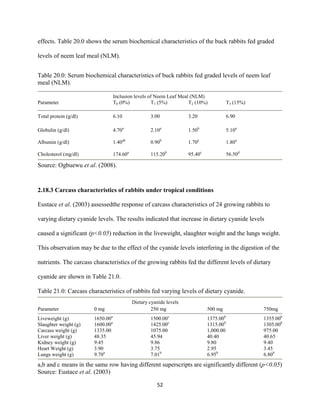
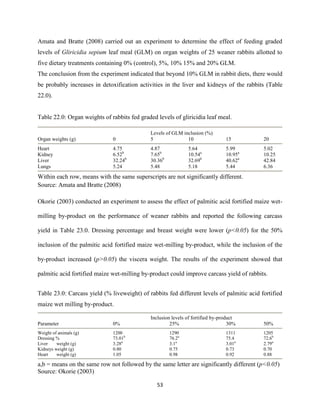
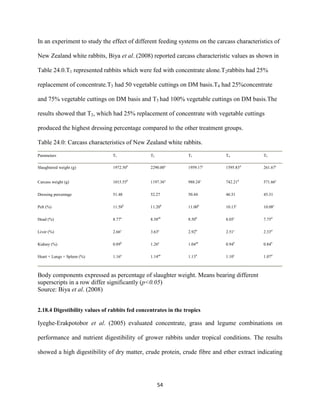
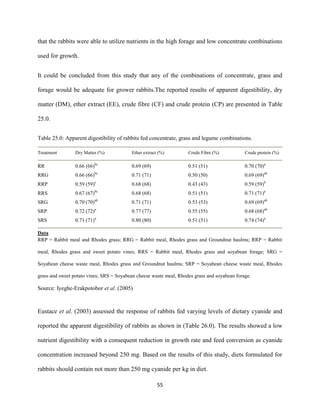
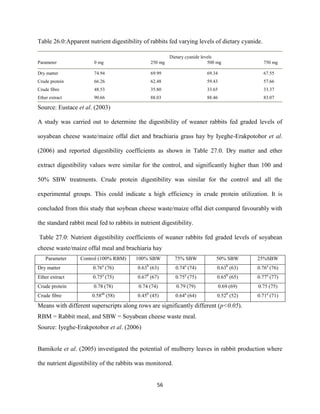
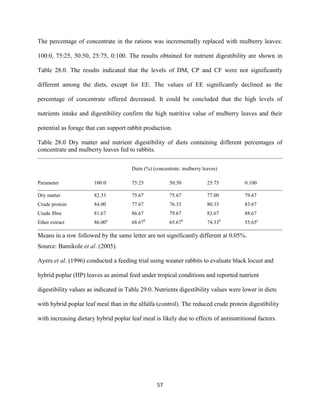
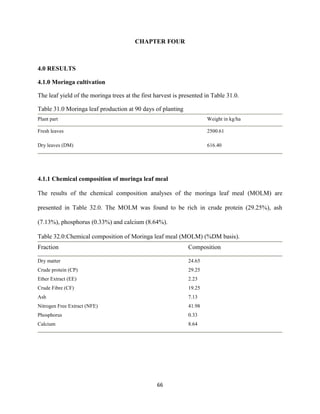
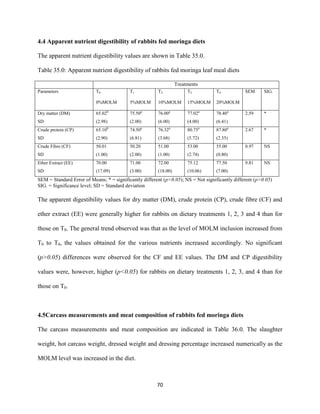
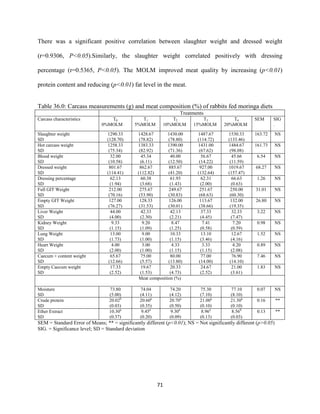
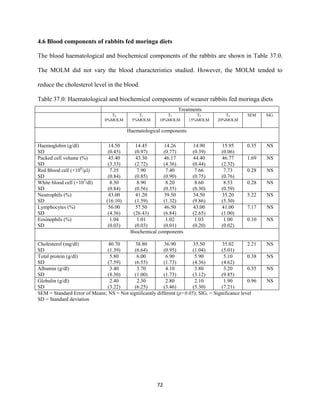
This document discusses a study that evaluated the use of moringa leaf meal (MOLM) as a replacement for soybean meal in rabbit diets. Specifically, the study: 1. Cultivated moringa and analyzed the chemical composition of the dried leaf meal. 2. Formulated diets containing 0%, 5%, 10%, 15%, and 20% MOLM and fed them to weaner rabbits to assess growth performance, nutrient digestibility, carcass characteristics, and blood parameters. 3. Analyzed data on feed intake, weight gain, feed conversion ratio (FCR), digestibility, carcass traits, and blood components to determine the effects of partially or completely replacing soy


