Downloaded 13 times
![IJRET: International Journal of Research in Engineering and Technology eISSN: 2319-1163 | pISSN: 2321-7308
__________________________________________________________________________________________
Volume: 02 Issue: 10 | Oct-2013, Available @ http://www.ijret.org 302
OPTIMIZATION OF EXTRUSION PROCESS FOR PRODUCTION OF
TEXTURIZED FLAXSEED DEFATTED MEAL BY RESPONSE SURFACE
METHODOLOGY
Suresh Bhise1
, Kaur A2
, Manikantan M R3
, Baljit Singh4
1, 2, 4
Department of Food Science and Technology, Punjab Agricultural University, Ludhiana, Punjab, India
3
Food Grain and Oilseeds Division, CIPHET, Ludhiana, India, sureshbhise_cft@yahoo.co.in1
Abstract
The objective of this work was to obtain and evaluate the nutritional and functional properties of texturized defatted flaxseed meal
rich in protein. The flaxseed was defatted, grinded, and sieved to eliminate hull fiber. The independent variables used were 14 to 20
per cent feed moisture; 300 to 500 rpm screw speed and 120 to 1800
C barrel temperature. The texturized flaxseed defatted meal
contained 2.61per cent moisture, 2.707 per cent fat, 38.24 per cent protein and 12.24 per cent fiber. During texturization two
important reactions (protein denaturation and starch gelatinization) in dough can affect viscosity. Functional properties as indicated
by this study, texturized defatted flaxseed meal may be recommended for use as an ingredient in products such as noodles, cookies,
extruded snacks, meat batters, hamburgers, and ice cream.
Keywords: Extrusion, Flaxseed meal, Texturization, Response surface methodology etc.
-------------------------------------------------------------------***----------------------------------------------------------------------
1. INTRODUCTION
Extrusion technology is extensively used for preparation of
new protein sources, such as oilseeds, leguminous seeds, leaf
and single cell proteins [1]. Providing safe, nutritious, and
wholesome food for poor and undernourished populations had
been a major challenge for the developing world [2, 3]. It had
been estimated that 800 million malnourished people exist in
least developed countries. Development of nutritious foods
has been suggested by FAO to combat malnutrition among
children for maintaining good health. Animal proteins are a
better source of high quality proteins than vegetable proteins
[4]. However, animal protein foods are more expensive than
vegetable protein [5]. Due to the price and relative scarcity of
food obtained from animals, it is necessary to find or develop
new alternative products that offer both better quality and a
greater quantity of proteins.
Flaxseed has been consumed throughout the world for
centuries. Today, flaxseed is used as a good source of soluble
and insoluble fiber to reduce blood cholesterol and promote
laxation [6]. However, flaxseed is one of the oilseeds that
have not yet been widely exploited as a source of
protein for human consumption. High meat prices have
prompted the food industry to produce nonmeat proteins. An
important reason for the increased acceptance of vegetable
proteins, such as texturized soy protein (TSP), is their low cost
[7]. In addition to retexturing and restructuring vegetable food
proteins, the extrusion cooking system performs several other
important functions. Denaturation of protein lowers solubility,
renders it digestible and destroys the biological activity of
enzymes and toxic proteins [8].
Traditionally used oil extraction machinery in India results
into poor oil extraction and oilseed cake contains substantial
amount of residual oil. This oilseed cake which is generally
used in animal feeds could be exploited for use in food
products of the proper processing. Extrusion technology had a
potential to process this large of byproducts. It may improve
the property of oil, protein denaturation and texturization of
along with starch gelatinization. Extrusion of flaxseed
modifies texture and causes complex physicochemical
changes. Under conditions of high temperature, high pressure
and high shear force proteins were denatured, dietary fibre
was broken down and cyanogenic glucoside was removed.
Amino acid and soluble dietary fibre increased, fat and water
content decreased, starch is gelatinized and degraded and the
texture became loose and uniform [9].
The potential usefulness of plant protein concentrates depends
on the versatility of their functional properties, which are
influenced by several intrinsic factors, such as protein
composition and conformation, as well as by environmental
factors, such as the composition of the model system of food
[10]. Functional properties affect processing applications, food
quality, acceptance, and use in formulating food products [11].
The objective of the present study was to obtain a texturized
protein from defatted flaxseed meal by extrusion, optimize the
process using response surface methodology and evaluate the](https://image.slidesharecdn.com/optimizationofextrusionprocessforproductionof-140805055340-phpapp01/85/Optimization-of-extrusion-process-for-production-of-1-320.jpg)
![IJRET: International Journal of Research in Engineering and Technology eISSN: 2319-1163 | pISSN: 2321-7308
__________________________________________________________________________________________
Volume: 02 Issue: 10 | Oct-2013, Available @ http://www.ijret.org 302
OPTIMIZATION OF EXTRUSION PROCESS FOR PRODUCTION OF
TEXTURIZED FLAXSEED DEFATTED MEAL BY RESPONSE SURFACE
METHODOLOGY
Suresh Bhise1
, Kaur A2
, Manikantan M R3
, Baljit Singh4
1, 2, 4
Department of Food Science and Technology, Punjab Agricultural University, Ludhiana, Punjab, India
3
Food Grain and Oilseeds Division, CIPHET, Ludhiana, India, sureshbhise_cft@yahoo.co.in1
Abstract
The objective of this work was to obtain and evaluate the nutritional and functional properties of texturized defatted flaxseed meal
rich in protein. The flaxseed was defatted, grinded, and sieved to eliminate hull fiber. The independent variables used were 14 to 20
per cent feed moisture; 300 to 500 rpm screw speed and 120 to 1800
C barrel temperature. The texturized flaxseed defatted meal
contained 2.61per cent moisture, 2.707 per cent fat, 38.24 per cent protein and 12.24 per cent fiber. During texturization two
important reactions (protein denaturation and starch gelatinization) in dough can affect viscosity. Functional properties as indicated
by this study, texturized defatted flaxseed meal may be recommended for use as an ingredient in products such as noodles, cookies,
extruded snacks, meat batters, hamburgers, and ice cream.
Keywords: Extrusion, Flaxseed meal, Texturization, Response surface methodology etc.
-------------------------------------------------------------------***----------------------------------------------------------------------
1. INTRODUCTION
Extrusion technology is extensively used for preparation of
new protein sources, such as oilseeds, leguminous seeds, leaf
and single cell proteins [1]. Providing safe, nutritious, and
wholesome food for poor and undernourished populations had
been a major challenge for the developing world [2, 3]. It had
been estimated that 800 million malnourished people exist in
least developed countries. Development of nutritious foods
has been suggested by FAO to combat malnutrition among
children for maintaining good health. Animal proteins are a
better source of high quality proteins than vegetable proteins
[4]. However, animal protein foods are more expensive than
vegetable protein [5]. Due to the price and relative scarcity of
food obtained from animals, it is necessary to find or develop
new alternative products that offer both better quality and a
greater quantity of proteins.
Flaxseed has been consumed throughout the world for
centuries. Today, flaxseed is used as a good source of soluble
and insoluble fiber to reduce blood cholesterol and promote
laxation [6]. However, flaxseed is one of the oilseeds that
have not yet been widely exploited as a source of
protein for human consumption. High meat prices have
prompted the food industry to produce nonmeat proteins. An
important reason for the increased acceptance of vegetable
proteins, such as texturized soy protein (TSP), is their low cost
[7]. In addition to retexturing and restructuring vegetable food
proteins, the extrusion cooking system performs several other
important functions. Denaturation of protein lowers solubility,
renders it digestible and destroys the biological activity of
enzymes and toxic proteins [8].
Traditionally used oil extraction machinery in India results
into poor oil extraction and oilseed cake contains substantial
amount of residual oil. This oilseed cake which is generally
used in animal feeds could be exploited for use in food
products of the proper processing. Extrusion technology had a
potential to process this large of byproducts. It may improve
the property of oil, protein denaturation and texturization of
along with starch gelatinization. Extrusion of flaxseed
modifies texture and causes complex physicochemical
changes. Under conditions of high temperature, high pressure
and high shear force proteins were denatured, dietary fibre
was broken down and cyanogenic glucoside was removed.
Amino acid and soluble dietary fibre increased, fat and water
content decreased, starch is gelatinized and degraded and the
texture became loose and uniform [9].
The potential usefulness of plant protein concentrates depends
on the versatility of their functional properties, which are
influenced by several intrinsic factors, such as protein
composition and conformation, as well as by environmental
factors, such as the composition of the model system of food
[10]. Functional properties affect processing applications, food
quality, acceptance, and use in formulating food products [11].
The objective of the present study was to obtain a texturized
protein from defatted flaxseed meal by extrusion, optimize the
process using response surface methodology and evaluate the](https://image.slidesharecdn.com/optimizationofextrusionprocessforproductionof-140805055340-phpapp01/75/Optimization-of-extrusion-process-for-production-of-1-2048.jpg)
![IJRET: International Journal of Research in Engineering and Technology eISSN: 2319-1163 | pISSN: 2321-7308
__________________________________________________________________________________________
Volume: 02 Issue: 10 | Oct-2013, Available @ http://www.ijret.org 303
functional properties of the product produced.
2. MATERIALS AND METHODS
2.1. Raw Material
The flaxseed (LC 2063) used in this study was procured from
Directorate of Seeds, Punjab Agricultural University,
Ludhiana, India.
2.2. Chemical Composition
The moisture, fat, fiber, carbohydrates and protein content
were determined [12].
2.3. Oil Extraction
The flaxseed was cleaned and defatted using laboratory oil
expeller. The meal was dried and milled into grits using Super
Mill (Perten Instruments, Sweeden). After that, the sample
was sieved using 200 mesh screen to separate out the large
particles of the seed coat.
2.4. Extrusion Process for Flaxseed
Texturization of flaxseed was carried out by using Clextral BC
21 twin screw extruder (Clextral, Firminy, France). RSM was
used to optimize the texturization conditions. Operating
condition of extruder were 14-17 per cent feed moisture, 300-
500 rpm screw speed and 120-180oC barrel temperature.
Texturized samples were was milled into flour using cyclotec
mill ( Newport Scientific, Australia) and packed in suitable
packaging material for further study.
2.5. Experimental Design
Central composite design is generally used for experiments
where zone of experimentation can be well defined through
initial test runs. Extrusion process variables (feed moisture
content, screw speed and temperature) were coded to the level
of -1, 0, +1 such that one factor at a time of experimental
design was as follow [13].
Extrusion
parameters
-1.682 -1 0 +1 +1.682
Moisture
content (%)
11.954 14 17 20 22.046
Screw
speed (rpm)
231.800 300 400 500 568.200
Barrel
temperature
(o
C)
99.54 120 150 180 200.460
2.6. Functional Properties
2.6.1. Water Absorption Index (WAI), Water
Solubility Index (WSI) and Fat Absorption Capacity
(FAC)
Water absorption index (WAI) was measured [14]. First, 1g of
protein flour was placed in a previously weighed 50 ml
centrifuge tube. Then, 10 ml of distilled water was added and
stirred homogeneously with a glass rod and centrifuged at
3000 rpm for 10 min at room temperature (22°C) using a
Model T-8BL LabyTM
centrifuge (Laby Laboratory
Instruments, Ambala Cantt, India). The residue was weighed
together with the centrifuge tube. The WAI values were
expressed as gram of water absorbed/g of protein. The
supernatant was transferred to previously weighed dish and
put in hot air oven for evaporation of water. The residue was
weighed. A similar method was used to measure fat absorption
capacity (FAC), although a 0.5 g sample was used [15].
WAI (g/g) = Weight of residue/ sample taken (1)
WSI (per cent) = Weight of dry matter in supernatant x100 (2)
Dry weight of sample
FAC (per cent) = Weight of fat absorbed by sample x100 (3)
Weight of sample
2.6.2. Foaming Capacity
One gram of protein flour was dissolved in 100 ml of distilled
water. Then the suspensions were whipped at a low speed in
blender for 1 min at room temperature (22°C) and poured into
a 100 ml cylinder. To determine foam stability (FS), foam
volume was recorded 30 min after whipping and
calculated [16].
FS = Foam volume after 30 min/initial foam volume x 100
2.6.3. Water Holding Capacity (WHC)
Five gram of protein flour was placed in a previously weighed
50 ml centrifuge tube. Then, 10 ml of distilled water was
added and stirred homogeneously with a glass rod and
centrifuged at 2000 rpm for 10 min at room temperature
(22°C). The supernatant was decanted and the residue was](https://image.slidesharecdn.com/optimizationofextrusionprocessforproductionof-140805055340-phpapp01/85/Optimization-of-extrusion-process-for-production-of-2-320.jpg)
![IJRET: International Journal of Research in Engineering and Technology eISSN: 2319-1163 | pISSN: 2321-7308
__________________________________________________________________________________________
Volume: 02 Issue: 10 | Oct-2013, Available @ http://www.ijret.org 304
weighed together with the centrifuge tube [12].
WHC (ml/g) = (weight of tube + sediment) – (weight of tube +5.0)
5 (4)
2.6.5. Bulk Density (BD)
The Bulk densities (g/ml) of defatted flour were determined by
volumetric method. The volume of the expanded sample was
measured by using a 25 ml graduated cylinder and gently
tapped for 5 times. The volume of 10 g randomized samples
was measured for each test. The ratio of sample weight and
the replaced volume in the cylinder was calculated as bulk
density (w/v) [17].
Bulk density (g/ml) = Weight of sample (5)
Volume displaced by sample
3. RESULTS AND DISCUSSION
3.1. Chemical Composition
The moisture, fat, fibre and protein content were 2.61 per cent,
2.707 per cent, 12.24 per cent, and 38.24 per cent,
respectively.
3.2. Functional Properties
3.2.1. Fat Absorption Capacity
The quadratic model obtained from regression analysis for fat
absorption capacity (FAC) in terms of coded levels of the
variables was developed as follows.
FAC = + 73.08 + 4.84 × A - 0.43 × B - 0.31×C - 2.90×A×B –
1.59×A×C- 2.42×B×C + 3.54×A2 +0.74×B2 + 5.39×C2
(6)
The analysis of variance (ANOVA) for FAC of quadratic
model is given in Table 3. There was only a 0.01 per cent
chance that a Model F-Value this large could occur due to
noise. If there are many insignificant model terms, model
reduction might improve model. Non-significant lack of fit
was good for the model to fit.
The P-value for Lack of fit 0.30 implies that it was not
significant. The value of R2
was found to be 0.99. Regression
analysis results (Table 3) showed the significant positive
linear influence of moisture, while negative influence of screw
speed and temperature (P<0.05) was recorded. There was
significant quadratic terms effects (P<0.01) of moisture
content and temperature on FAC. There was also reported
significant interaction of feed moisture with screw speed, feed
moisture with temperature and screw speed with temperature
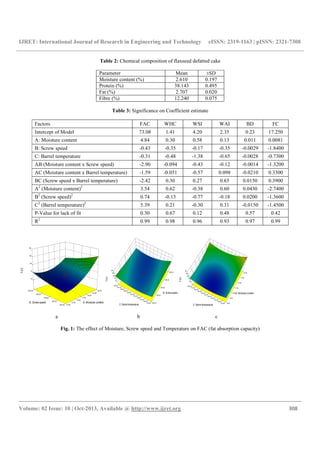
(P<0.01) on FAC. The FAC varied from 71.07 to 91.48 per
cent protein flour (Table 1). It was observed from regressions
analysis that during extrusion-cooking, higher moisture
contents increase FAC of protein flour (Fig. 1a). The increase
in FAC with increasing screw speed was consistent. Defatting
increases the protein solubility and water and oil absorption
capacities of the meals. The capacity of protein to absorb
water and oil is determined by its polar and non polar amino
acids composition, respectively [18]. FAC of the flaxseed
protein concentrate was higher than that of amaranth protein
concentrate [19].
3.2.2. Water Holding Capacity
Water holding capacity is the ability to retain water against
gravity, and includes bound water, hydrodynamic water,
capillary water and physically entrapped water [20]. The
quadratic model obtained from regression analysis for water
holding capacity (WHC) in terms of coded levels of the
variables was developed as follows.
WHC = + 1.41+0.30×A -0.35×B - 0.48×C- 0.094×A×B -
0.051×A×C+0.30×B×C+0.62×A2-0.13×B2+0.21×C2
(7)
The Model F-value of 56.19 implies that model was
significant. In this case A, B, C, BC, A2, B2, C2 are
significant model terms. Non significant lack of fit was good
for the model to fit. Model ratio of 28.25 indicates an adequate
signal. This model could be used to navigate the design space.
The P-value for Lack of fit 0.67 implies that it was not
significant. The value of R2
was found to be 0.98. The analysis
of variance (ANOVA) for WHC of quadratic model is given
in Table 3. Regression analysis results showed that the
significant positive linear influence of moisture, while
negative influence of screw speed and temperature (P<0.05)
was recorded. There was significant quadratic terms effect
(P<0.01) of moisture content, screw speed and temperature on
WHC. There was also reported significant interaction of screw
speed with barrel temperature (P<0.01) on WHC. The WHC
varied from 0.469 to 3.501 ml/g protein flour (Table 1). It was
observed from regressions analysis that during extrusion-
cooking, higher moisture contents increase WHC of protein
flour (Fig. 2a). Water holding capacity of protein is very
important as it affects the texture, juiciness, and taste of food
products. The capacity of protein to absorb water was
determined by its polar and non polar amino acids
composition [18]. The amount of water associated to proteins
is closely related with its amino acids profile and increases
with the number of charged residues, [21] conformation,
hydrophobicity, pH, temperature, ionic strength and protein
concentration [22].](https://image.slidesharecdn.com/optimizationofextrusionprocessforproductionof-140805055340-phpapp01/85/Optimization-of-extrusion-process-for-production-of-3-320.jpg)
![IJRET: International Journal of Research in Engineering and Technology eISSN: 2319-1163 | pISSN: 2321-7308
__________________________________________________________________________________________
Volume: 02 Issue: 10 | Oct-2013, Available @ http://www.ijret.org 305
3.2.3. Water Solubility Index
WSI, often used as an indicator of degradation of molecular
components [23]. WSI measures the amount of soluble
components released from the protein and other molecules
after extrusion. High WSI is an in vitro indicator of good
digestibility [24]. The quadratic model obtained from
regression analysis for water solubility index (WSI) in terms
of coded levels of the variables was developed as follows.
WSI = + 4.20 + 0.58 ×A- 0.17×B- 1.38×C- 0.43×A×B –
0.57×A×C + 0.27×B×C - 0.38×A2 - 0.77×B2 - 0.30×C2
(8)
Regression model fitted to experimental results. The P-value
for Lack of fit 0.12 implies that it was significant. The value
of R2
was found to be 0.96. Regression analysis results
showed the significant positive linear influence of moisture,
while negative influence of screw speed and temperature
(P<0.05) was recorded. There was significant quadratic terms
effect (P<0.01) of moisture content and temperature on WSI.
There was also significant interaction of moisture and
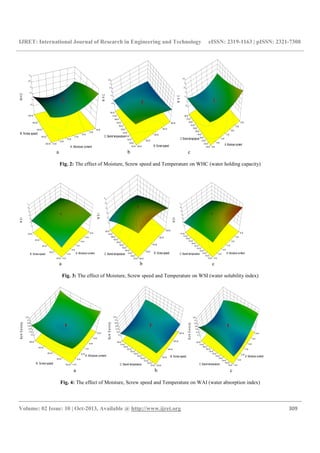
temperature (P<0.01) on WSI. The WSI varied from 0.70 to
6.35 per cent protein flour (Table 1). It was observed from
regressions analysis that during extrusion-cooking, higher
moisture contents increase WSI of protein flour (Fig. 3a). The
high mechanical shear caused breakdown of macromolecules
to small molecules with higher solubility. The increase in WSI
with increasing screw speed was consistent with the results
reported by other researchers [25]. Also increasing
temperature would result in degradation of molecule resulting
in an increase in WSI [26].
3.2.4. Water Absorption Index
High WAI is an in vitro indicator of good digestibility of
protein starch and other molecules [24]. The WAI measures
the amount of water absorbed by starch and can be used as an
index of gelatinization [27]. WAI depends on the availability
of hydrophilic groups that bind water molecules. The
quadratic model obtained from regression analysis for water
absorption index in terms of coded levels of the variables was
developed as fallows.
WAI = + 2.35 + 0.13×A - 0.35×B - 0.65×C - 0.12×A×B +
0.098×A×C + 0.65×B×C + 0.60×A2 - 0.18×B2 +
0.31×C2 (9)
The P-value for Lack of fit 0.48 implies that it was not
significant. The value of R2
is found to be 0.93. Regression
analysis results showed that screw speed and temperature had
significant negative and moisture had positive linear
(P<0.001) effect and significant quadratic effect on WAI.
Interaction of screw speed with temperature had significant
influence (P<0.01). The WAI of protein flour ranges from
1.35 to 4.85 g/g (Table 1). Increases in moisture content
reduce the water absorption index. Moisture content, acting as
a plasticizer during extrusion cooking, reduces the degradation
of starch granules, this result in an increased capacity for
water absorption [28]. WAI was higher for lower screw speed
and lower temperature as shown in response surface plot (Fig.
4b and 4c). It could be expected that more undamaged
polymer chains and a greater availability of hydrophilic
groups, which could bind more water resulted in higher values
of WAI under low shear conditions with lower screw speed
[29].
3.2.5. Bulk Density
Bulk density is a very important parameter in the production
of texturized products. Density is a measure of how much
expansion has occurred as a result of extrusion. The heat
developed during extrusion can increase the temperature of the
moisture above the boiling point so that when the extrudate
exits from the die, a part of the moisture would quickly flash
off as steam and result in an expanded structure with large
alveoli and low density. The quadratic model obtained from
regression analysis for bulk density (BD) in terms of coded
levels of the variables was developed as follows.
Bulk Density = + 0.23 +0.011× A -0.00288×B -0.00287× C
+0.00136×A× B -0.021×A×C + 0.015×B×C
+0.043 × A2+0.020× B2-0.015 ×C2 (10)
The analysis of variance (ANOVA) for bulk density of
quadratic model is given in Table 3. Regression model fitted
to experimental results of bulk density showed The P-value for
Lack of fit 0.57 implies that it was not significant. The value
of R2
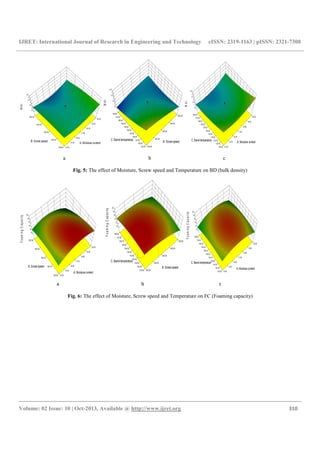
is found to be 0.97. The bulk density of protein flour
ranges from 0.189 to 0.359 g/ml (Table 1). Regression
analyses indicate that bulk density decreases with decrease in
moisture (Fig. 5a).The high dependence of bulk density and
expansion on feed moisture would reflect its influence on
elasticity characteristics of the starch- based material.
Increased feed moisture content during extrusion may reduce
the elasticity of the material through plasticization of the melt,
resulting in reduced SME and lower bulk density was
observed at high screw speed and decreasing the expansion
and increasing the density of extrudate. Bulk density low at
high screw speed (Fig. 5b). Bulk density increased with
decrease in moisture as higher water content produced
extrudates denser than those produced with low water content.
Similar results were reported [30] in study of effect of
extrusion condition on the soya rice extrudates and effect of
extrusion variables on waxy hull less barley [31].
3.2.6. Foaming Capacity
Foams were gaseous droplets encapsulated by a liquid film
containing soluble surfactant protein resulting in reduced
interfacial tension between gas and water. The quadratic](https://image.slidesharecdn.com/optimizationofextrusionprocessforproductionof-140805055340-phpapp01/85/Optimization-of-extrusion-process-for-production-of-4-320.jpg)
![IJRET: International Journal of Research in Engineering and Technology eISSN: 2319-1163 | pISSN: 2321-7308
__________________________________________________________________________________________
Volume: 02 Issue: 10 | Oct-2013, Available @ http://www.ijret.org 306
model obtained from regression analysis for foaming capacity
(FC) in terms of coded levels of the variables was developed
as follows.
Foaming Capacity = +17.25 + 0.00805×A - 1.84×B
- 0.73×C - 1.32×A×B + 0.33×A×C + 0.39×B×C – 2.74×A2 -
1.36×B2 - 1.45×C2 (11)
The analysis of variance (ANOVA) for foaming capacity of
quadratic model is given in Table 3. Regression model fitted
to experimental results of foaming capacity showed. The P-
value for Lack of fit 0.42 implies that it was not significant.
The value of R2
is found to be 0.99. Interaction (P<0.05) of all
independent variables were found significant. The foaming
capacity of protein flour ranges from 9.23 to 17.81 percent
(Table 1). Regression analyses indicate that foaming capacity
decreases with decrease in moisture (Fig. 6a). Foaming
capacity was low at high screw speed (Fig. 6b).
CONCLUSIONS
There was also reported significant interaction of feed
moisture with screw speed, feed moisture with temperature
and screw speed with temperature on FAC. The increase in
FAC with increasing screw speed was consistent. Defatting
increases the protein solubility and water and oil absorption
capacities of the meals. Significant positive linear influence of
feed moisture, while negative influence of screw speed and
temperature on WHC was recorded. Screw speed with
temperature had significant interaction on WHC. Feed
moisture had positive effect, while screw speed and
temperature had negative effect on WSI was recorded. There
was also reported significant interaction of moisture and
temperature (P<0.01) on WSI. Higher moisture contents
increased WSI of protein flour during extrusion. Screw speed
and temperature had significant negative and moisture had
positive linear effect and significant quadratic effect on WAI.
Interaction of screw speed with temperature had significant
influence. Bulk density decreases with decrease in moisture.
Foaming capacity decreases with decrease in moisture.
Foaming capacity was low at high screw speed.
REFERENCES
[1] Hagan RO, Dhal SR, Villota R (1986) Texturization of
co precipitated soybean and peanut protein by twin
screw extrusion. J Food Sci 51:367.
[2] Bhat R, Karim AA (2009) Exploring the nutritional
potential of wild and underutilized legumes. Comp Rev
Food Sci Food Safety 8:305-331.
[3] Boye J, Zare F, Pletch A (2010) Pulse proteins:
Processing, characterization, functional properties and
applications in food and feed. Food Res Intl 43:414-
431.
[4] Salcedo-Chávez B, Osuna-Castro JA, Guevara-Lara F,
Domínguez-Domínguez J, Paredes-López O (2002)
Optimization of the isoelectric precipitation method to
obtain protein isolates from amaranth (Amaranthus
cruentus) seeds. J Agric Food Chem 50: 6515-6520.
[5] Shils ME, Olson JA, Shike M, Ross AC (2002)
Nutrición en salud y enfermedad, Volumen II 9 A
edition, McGrawHill Interamericana Editores, S.A. de
C.V. México, D.F. 1103-133.
[6] Payne TJ (2000) Promoting better health with flaxseed
in bread. Cereal Foods World 45:102-104.
[7] Singh P, Kumar R, Sabapathy SN, Bawa AS (2008)
Functional and edible uses of soy protein products.
Comp Rev Food Sci Food Safety 7:14-28.
[8] Altschul A M (1965) In proteins: Their chemistry and
politics. Basic Books. New York.
[9] Li-Ci-Li, Miao-Ming (2007) Influence of extrusion on
chemical components and texture of flaxseed meal.
Food Sci Tech 10:77-80.
[10] Fernández-Quintela A, Macarulla MT, Barrio AS,
Martínez JA (1997) Composition and functional
properties of protein isolates obtained from commercial
legumes grown in northern Spain. Plant foods Human
Nut 51:331-342.
[11] Mahajan A, Dua S (2002) Salts and pH induced
changes in functional properties of amaranth
(Amaranthus tricolor L.) seed meal. Cereal chem
79:834-837.
[12] AOAC (2000) Official methods of
Analysis.Association of Official Analytical Chemists,
Guthersburg, Maryland, USA.17th
edition.
[13] Myers RH (1971) Response surface methodology. 1st
edition. Boston, Mass: Allyn and Bacon, 247.
[14] Stojceska V, Ainsworth P, Plunkett A, Ibanoglu S
(2009) The effect of extrusion cooking using different
water feed rates on the quality of ready-to-eat snacks
made from food by-products. Food Chem 114:226-232.
[15] Lin MJY, Humbert ES, Sosulski FW (1974) Functional
properties of sunflower meal product. J Food Sci
39:368-370.
[16] Kabirullah M, Wills RBH (1983) Characterization of
sunflower protein. J Agri Food Chem 31:953-956.
[17] Pan Z, Zhang S, Jane J (1998) Effects of extrusion
variables and chemicals on the properties of starch-
based binders and processing conditions. Cereal chem
75:541-546.
[18] Sathe SK, Salunkhe DK (1981) Functional properties of
the great Northern bean proteins: emulsion, foaming,
viscosity, and gelation properties. J Food Sci 46:71-81.
[19] De Luquez N, Fernandez S, Arellano M, Mucciarelli S
(1997) Concentrado proteico de Amaranthus
mantegazzianus: Caracterización físico-químico-
biológica. Archivos Latinoamericanos de Nutrición
47:359-361.
[20] Moure A, Sineiro J, Domınguez H, Parajo JC (2006)
Functionality of oilseed protein products: A review.
Food Res Intl 39:945-963.](https://image.slidesharecdn.com/optimizationofextrusionprocessforproductionof-140805055340-phpapp01/85/Optimization-of-extrusion-process-for-production-of-5-320.jpg)
![IJRET: International Journal of Research in Engineering and Technology eISSN: 2319-1163 | pISSN: 2321-7308
__________________________________________________________________________________________
Volume: 02 Issue: 10 | Oct-2013, Available @ http://www.ijret.org 307
[21] Kuntz ID Jr, Kauzmann W (1974) Hydration of
proteins and polypeptides. Adv protein Chem 28:239-
345.
[22] Damodaran S (1997) Food prtiens: An overview. In: S.
Damodaran and A. Paraf (Eds), Food prtiens and their
application New York: Marcel Dekker.
[23] Kirby AR, Ollett AL, Parker R, Smith AC (1988)
An experimental study of screw configuration effects
in the twin-screw extrusion-cooking of maize grits. J
Food Engg 8: 247-272.
[24] Guha M, Ali SZ and Bhattacharya S (1997) Twin-screw
extrusion of rice flour without a die: Effect of barrel
temperature and screw speed on extrusion and
extrudate characteristics. J Food Engg 32:251-267.
[25] Dogan H, Karwe MV (2003) Physicochemical
properties of quinoa extrudates. Food Sci Technol Int
Madrid 9:101-114.
[26] Ding QB, Ainsworth P, Tucker G, Marson H (2005)
The effect of extrusion conditions on the
physicochemical properties and sensory
characteristics of rice based expanded snacks. J Food
Engg 66:283-289.
[27] Anderson RA, Conway HF, Griffin EL (1969)
Gelatinization of corn grits by roll and extrusion
cooking. Cereal Sci Today 14:4-12.
[28] Hagenimana A, Ding X, Fang T (2006) Evaluation
of rice flour modified by extrusion cooking. J Cereal
Sci 43:38-46.
[29] Jin Z, Hsieh F, Huff HE (1995) Effects of soy
fiber, salt, sugar, and screw speed on physical
properties and microstructure of cornmeal extrudate. J
Cereal Sci 22:185-194.
[30] Patil RT, Singh DS, Tribelhorn RE (1990) Effect of
Processing Conditions on Extrusion Cooking of Soy-
Rice Blend with a Dry Extrusion Cooker. J Food
Sci Technol 27: 376-378.
[31] Koksel H, Ryu G H, Basman A and Demiralp H (2004)
Effects of extrusion variables on the properties of waxy
hulless barley extrudates. Nahrung Food 48:19-24.
Table 1: Effect of Extrusion condition on product responses (n=3)
Extrusion conditions Responses
Moisture
content
(%)
Screw
speed
(rpm)
Temperature
(0
C)
FAC
(%)
WHC
(ml/g)
WSI
(%)
WAI
(g/g)
BD
(g/ml)
FC
(%)
14 300 120 71.07 2.85 3.07 4.72 0.2549 13.86
20 300 120 90.21 3.5905 6.36 4.85 0.339 15.8
14 500 120 81.47 1.6 2.6 3.07 0.229 12
20 500 120 88.41 2.14 4.16 2.45 0.293 8.97
14 300 180 79.29 1.41 0.83 1.89 0.269 10.61
20 300 180 91.48 2.12 1.79 2.13 0.243 14.17
14 500 180 79.44 1.55 1.41 2.55 0.279 10.61
20 500 180 80.6 1.71 0.7 2.6 0.284 8.62
17 400 150 73.6 1.33 4.16 2.838 0.24 17.12
17 400 150 73.11 1.47 3.78 2.8 0.216 17.81
17 400 150 73.25 1.21 4.52 2.075 0.24 17
17 400 150 73.61 1.73 4.15 2.085 0.219 17
17 400 150 72.55 1.34 4.55 2.21 0.25 17.5
17 400 150 72.38 1.369 3.95 2.091 0.21 17.15
11.95 400 150 75.2 2.537 2.47 3.537 0.349 9.45
22.05 400 150 91.02 3.71 4.12 4.7 0.359 9.23
17 231.8 150 76.29 1.55 1.94 2.495 0.294 16.5
17 568.2 150 74.08 0.469 2.43 1.35 0.283 10
17 400 99.54 89.5 2.91 5.75 4.21 0.189 14
17 400 200.46 87.21 1.06 1.33 2.429 0.19 12](https://image.slidesharecdn.com/optimizationofextrusionprocessforproductionof-140805055340-phpapp01/85/Optimization-of-extrusion-process-for-production-of-6-320.jpg)

This study focuses on optimizing the extrusion process for producing texturized defatted flaxseed meal to enhance its nutritional and functional properties. Key findings show that the protein content was 38.24%, with optimal conditions including feed moisture of 14-20%, screw speed of 300-500 rpm, and barrel temperature of 120-180°C. The texturized meal shows potential as an ingredient in various food products, including noodles, cookies, and extruded snacks.


