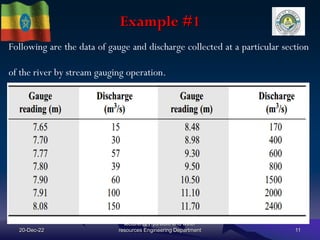
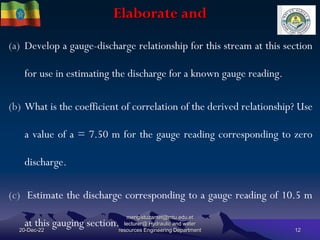
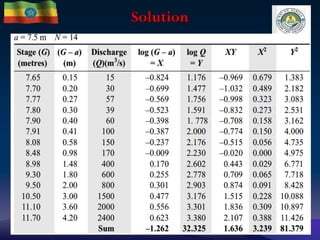
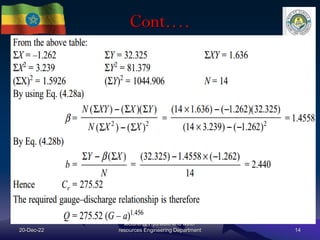
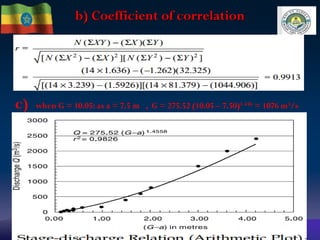
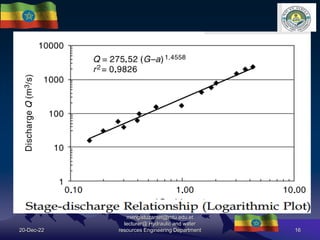
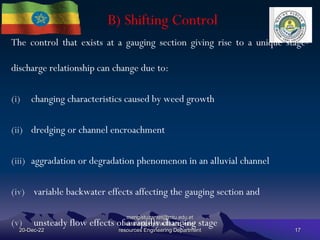
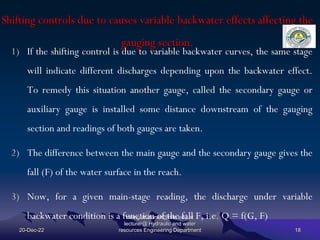
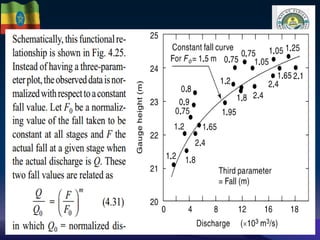
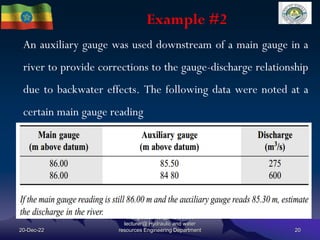
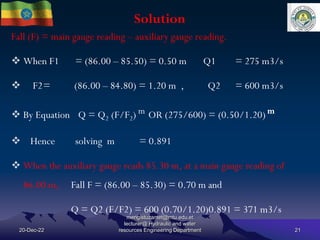
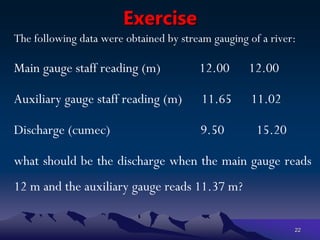
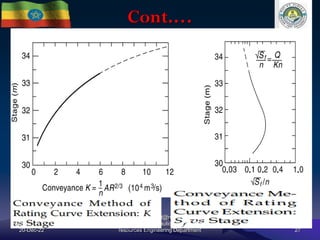
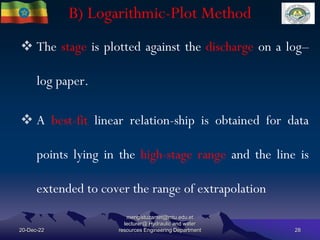
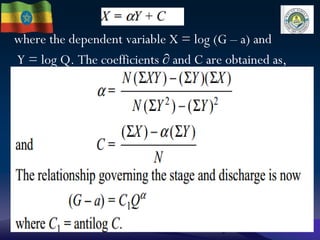
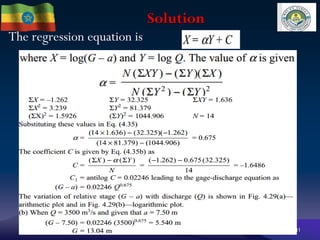
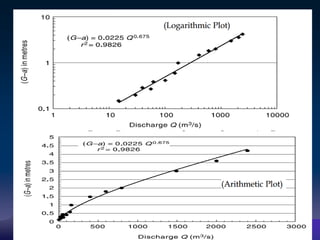
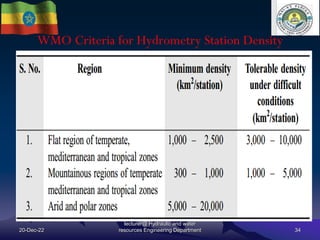
Discharge-stage relationship (Rating curve):
HWRE-3122
Mengistu .Z (MSc in Hydraulic Engineering )
Lecturer @ Hydraulic and Water Resources Engineering
department
Mizan Tepi university
Email: mengistu.zantet@gmail.com
mengistuzantet@mtu.edu.et
P.O.Box: 260
Tepi, Ethiopia
20-Dec-22 1
1) Techniques of Discharge-stage relationship ( rating curve )
A) permanent control Method
B) shifted control Method
2) Techniques of extending the rating curve
a) conveyance method
b) logarithmic – plot method
3) Hydrometry stations, .
2
General
20-Dec-22 3
Measurement of discharge by the direct method
involves a two step procedure;
The first step is development of the stage-discharge (G
– Q) relationship. Once the stage-discharge (G – Q)
relationship is established, the subsequent procedure
consists of measuring the stage (G) and reading the
discharge (Q) from the (G – Q) relationship.
Cont.…
20-Dec-22
mengistuzantet@mtu.edu.et
lecturer@ Hydraulic and water
resources Engineering Department 4
This second part is a Routine operation.
Thus the aim of all current-meter and other direct-
discharge measurements is to prepare a stage-discharge
relationship for the given channel gauging section.
The stage-discharge relationship is also known as the
rating curve
cont..
20-Dec-22
mengistuzantet@mtu.edu.et
lecturer@ Hydraulic and water
resources Engineering Department 5
The combined effect of these parameters is termed
control.
If the (G– Q) relationship for a gauging section is
constant and does not change with time, the control is
said to be permanent (G– Q) relationship.
If it changes with time, it is called shifting control (G– Q)
relationship.
A) Permanent Control
20-Dec-22
mengistuzantet@mtu.edu.et
lecturer@ Hydraulic and water
resources Engineering Department 6
A majority of streams and rivers, especially no alluvial
rivers exhibit permanent control.
For such a case, the relationship between the stage and
the discharge is a single-valued relation which is
expressed as
cont.…
Where Q = stream discharge, G = gauge height (stage), a = a
constant which represent the gauge reading corresponding to zero
discharge, Cr and ß are rating curve constants.
This relationship can be expressed graphically by plotting
the observed relative stage (G – a) against the
corresponding discharge values in an arithmetic or
logarithmic plot
20-Dec-22 7
Cont..
20-Dec-22 8
Cont.…
20-Dec-22
mengistuzantet@mtu.edu.et
lecturer@ Hydraulic and water
resources Engineering Department 9
The best values of Cr and ß are obtained by the least-square-error method.
Cont..
20-Dec-22 10
 For a perfect correlation r = 1.0.
 If r is between 0.6 and 1.0 it is generally taken as a good
correlation.
 It should be noted that in the present case, as the discharge
Q increases with (G – a) the variables Y and X are
positively correlated and hence r is positive
Example #1
20-Dec-22
mengistuzantet@mtu.edu.et
lecturer@ Hydraulic and water
resources Engineering Department 11
Following are the data of gauge and discharge collected at a particular section
of the river by stream gauging operation.
Elaborate and
20-Dec-22
mengistuzantet@mtu.edu.et
lecturer@ Hydraulic and water
resources Engineering Department 12
(a) Develop a gauge-discharge relationship for this stream at this section
for use in estimating the discharge for a known gauge reading.
(b) What is the coefficient of correlation of the derived relationship? Use
a value of a = 7.50 m for the gauge reading corresponding to zero
discharge.
(c) Estimate the discharge corresponding to a gauge reading of 10.5 m
at this gauging section.
Solution
20-Dec-22 13
Cont.…
20-Dec-22
mengistuzantet@mtu.edu.et
lecturer@ Hydraulic and water
resources Engineering Department 14
b) Coefficient of correlation
20-Dec-22 15
c) when G = 10.05: as a = 7.5 m , G = 275.52 (10.05 – 7.50)1.456 = 1076 m3/s
20-Dec-22
mengistuzantet@mtu.edu.et
lecturer@ Hydraulic and water
resources Engineering Department 16
B) Shifting Control
20-Dec-22
mengistuzantet@mtu.edu.et
lecturer@ Hydraulic and water
resources Engineering Department 17
The control that exists at a gauging section giving rise to a unique stage-
discharge relationship can change due to:
(i) changing characteristics caused by weed growth
(ii) dredging or channel encroachment
(iii) aggradation or degradation phenomenon in an alluvial channel
(iv) variable backwater effects affecting the gauging section and
(v) unsteady flow effects of a rapidly changing stage
Shifting controls due to causes variable backwater effects affecting the
gauging section.
20-Dec-22
mengistuzantet@mtu.edu.et
lecturer@ Hydraulic and water
resources Engineering Department 18
1) If the shifting control is due to variable backwater curves, the same stage
will indicate different discharges depending upon the backwater effect.
To remedy this situation another gauge, called the secondary gauge or
auxiliary gauge is installed some distance downstream of the gauging
section and readings of both gauges are taken.
2) The difference between the main gauge and the secondary gauge gives the
fall (F) of the water surface in the reach.
3) Now, for a given main-stage reading, the discharge under variable
backwater condition is a function of the fall F, i.e. Q = f(G, F)
20-Dec-22
mengistuzantet@mtu.edu.et
lecturer@ Hydraulic and water
resources Engineering Department 19
Example #2
An auxiliary gauge was used downstream of a main gauge in a
river to provide corrections to the gauge-discharge relationship
due to backwater effects. The following data were noted at a
certain main gauge reading
20-Dec-22
mengistuzantet@mtu.edu.et
lecturer@ Hydraulic and water
resources Engineering Department 20
Solution
20-Dec-22
mengistuzantet@mtu.edu.et
lecturer@ Hydraulic and water
resources Engineering Department 21
Fall (F) = main gauge reading – auxiliary gauge reading.
 When F1 = (86.00 – 85.50) = 0.50 m Q1 = 275 m3/s
 F2= (86.00 – 84.80) = 1.20 m , Q2 = 600 m3/s
 By Equation Q = Q2 (F/F2) m OR (275/600) = (0.50/1.20)m
 Hence solving m = 0.891
 When the auxiliary gauge reads 85.30 m, at a main gauge reading of
86.00 m, Fall F = (86.00 – 85.30) = 0.70 m and
Q = Q2 (F/F2) = 600 (0.70/1.20)0.891 = 371 m3/s
Exercise
The following data were obtained by stream gauging of a river:
Main gauge staff reading (m) 12.00 12.00
Auxiliary gauge staff reading (m) 11.65 11.02
Discharge (cumec) 9.50 15.20
what should be the discharge when the main gauge reads
12 m and the auxiliary gauge reads 11.37 m?
22
2) Extrapolation of Rating Curve
20-Dec-22
mengistuzantet@mtu.edu.et
lecturer@ Hydraulic and water
resources Engineering Department 23
Most hydrological designs consider extreme flood flows
Example, in the design of hydraulic structures, such as
barrages, dams and bridges one needs maximum flood
discharges as well as maximum flood levels.
Before attempting extrapolation, it is necessary to
examine the site and collect relevant data on changes in
the river cross-section due to flood plains, roughness
and backwater effects.
Cont..
20-Dec-22
mengistuzantet@mtu.edu.et
lecturer@ Hydraulic and water
resources Engineering Department 24
The reliability of the extrapolated value depends on the
stability of the gauging section.
Extrapolation of the rating curve in an alluvial river
subjected to aggradation and degradation is unreliable and
the results should always be confirmed by alternate
methods
Techniques of extending the rating curve
20-Dec-22
mengistuzantet@mtu.edu.et
lecturer@ Hydraulic and water
resources Engineering Department 25
A) Conveyance Method
B) Logarithmic-Plot Method
A) Conveyance Method
20-Dec-22
mengistuzantet@mtu.edu.et
lecturer@ Hydraulic and water
resources Engineering Department 26
The conveyance of a channel in non uniform flow is
defined by the relation
Q = K * S f where
Q = discharge in the channel,
Sf = slope of the energy line and
K = conveyance. If Manning’s formula is used
Cont.…
20-Dec-22
mengistuzantet@mtu.edu.et
lecturer@ Hydraulic and water
resources Engineering Department 27
B) Logarithmic-Plot Method
20-Dec-22
mengistuzantet@mtu.edu.et
lecturer@ Hydraulic and water
resources Engineering Department 28
 The stage is plotted against the discharge on a log–
log paper.
 A best-fit linear relation-ship is obtained for data
points lying in the high-stage range and the line is
extended to cover the range of extrapolation
where the dependent variable X = log (G – a) and
Y = log Q. The coefficients ∂ and C are obtained as,
20-Dec-22
Example
20-Dec-22
mengistuzantet@mtu.edu.et
lecturer@ Hydraulic and water
resources Engineering Department 30
For the stage-discharge data of Example #1, fit a
regression equation for use in estimation of stage for a
known value of discharge. Use a value of 7.50 m as the
gauge reading corresponding to zero discharge.
Determine the stage for a discharge of 3500 m3/s.
Solution
The regression equation is
20-Dec-22
mengistuzantet@mtu.edu.et
lecturer@ Hydraulic and water
resources Engineering Department 31
20-Dec-22
mengistuzantet@mtu.edu.et
lecturer@ Hydraulic and water
resources Engineering Department 32
3) Hydrometry Stations
20-Dec-22
mengistuzantet@mtu.edu.et
lecturer@ Hydraulic and water
resources Engineering Department 33
As the measurement of discharge is of paramount
importance in applied hydrologic studies, considerable
expenditure and effort are being expended in every
country to collect and store this valuable historic data
WMO Criteria for Hydrometry Station Density
20-Dec-22
mengistuzantet@mtu.edu.et
lecturer@ Hydraulic and water
resources Engineering Department 34
General truth
20-Dec-22
mengistuzantet@mtu.edu.et
lecturer@ Hydraulic and water
resources Engineering Department 35
Hydrometry stations must be sited in adequate
number in the catchment area of all major streams so
that the water potential of an area can be assessed as
accurately as possible
20-Dec-22
mengistuzantet@mtu.edu.et
lecturer@ Hydraulic and water
resources Engineering Department 36
THE END
20-Dec-22
mengistuzantet@mtu.edu.et
lecturer@ Hydraulic and water
resources Engineering Department 37

Chapter 4.pdf

  • 1.
    Discharge-stage relationship (Ratingcurve): HWRE-3122 Mengistu .Z (MSc in Hydraulic Engineering ) Lecturer @ Hydraulic and Water Resources Engineering department Mizan Tepi university Email: mengistu.zantet@gmail.com mengistuzantet@mtu.edu.et P.O.Box: 260 Tepi, Ethiopia 20-Dec-22 1
  • 2.
    1) Techniques ofDischarge-stage relationship ( rating curve ) A) permanent control Method B) shifted control Method 2) Techniques of extending the rating curve a) conveyance method b) logarithmic – plot method 3) Hydrometry stations, . 2
  • 3.
    General 20-Dec-22 3 Measurement ofdischarge by the direct method involves a two step procedure; The first step is development of the stage-discharge (G – Q) relationship. Once the stage-discharge (G – Q) relationship is established, the subsequent procedure consists of measuring the stage (G) and reading the discharge (Q) from the (G – Q) relationship.
  • 4.
    Cont.… 20-Dec-22 mengistuzantet@mtu.edu.et lecturer@ Hydraulic andwater resources Engineering Department 4 This second part is a Routine operation. Thus the aim of all current-meter and other direct- discharge measurements is to prepare a stage-discharge relationship for the given channel gauging section. The stage-discharge relationship is also known as the rating curve
  • 5.
    cont.. 20-Dec-22 mengistuzantet@mtu.edu.et lecturer@ Hydraulic andwater resources Engineering Department 5 The combined effect of these parameters is termed control. If the (G– Q) relationship for a gauging section is constant and does not change with time, the control is said to be permanent (G– Q) relationship. If it changes with time, it is called shifting control (G– Q) relationship.
  • 6.
    A) Permanent Control 20-Dec-22 mengistuzantet@mtu.edu.et lecturer@Hydraulic and water resources Engineering Department 6 A majority of streams and rivers, especially no alluvial rivers exhibit permanent control. For such a case, the relationship between the stage and the discharge is a single-valued relation which is expressed as
  • 7.
    cont.… Where Q =stream discharge, G = gauge height (stage), a = a constant which represent the gauge reading corresponding to zero discharge, Cr and ß are rating curve constants. This relationship can be expressed graphically by plotting the observed relative stage (G – a) against the corresponding discharge values in an arithmetic or logarithmic plot 20-Dec-22 7
  • 8.
  • 9.
    Cont.… 20-Dec-22 mengistuzantet@mtu.edu.et lecturer@ Hydraulic andwater resources Engineering Department 9 The best values of Cr and ß are obtained by the least-square-error method.
  • 10.
    Cont.. 20-Dec-22 10  Fora perfect correlation r = 1.0.  If r is between 0.6 and 1.0 it is generally taken as a good correlation.  It should be noted that in the present case, as the discharge Q increases with (G – a) the variables Y and X are positively correlated and hence r is positive
  • 11.
    Example #1 20-Dec-22 mengistuzantet@mtu.edu.et lecturer@ Hydraulicand water resources Engineering Department 11 Following are the data of gauge and discharge collected at a particular section of the river by stream gauging operation.
  • 12.
    Elaborate and 20-Dec-22 mengistuzantet@mtu.edu.et lecturer@ Hydraulicand water resources Engineering Department 12 (a) Develop a gauge-discharge relationship for this stream at this section for use in estimating the discharge for a known gauge reading. (b) What is the coefficient of correlation of the derived relationship? Use a value of a = 7.50 m for the gauge reading corresponding to zero discharge. (c) Estimate the discharge corresponding to a gauge reading of 10.5 m at this gauging section.
  • 13.
  • 14.
  • 15.
    b) Coefficient ofcorrelation 20-Dec-22 15 c) when G = 10.05: as a = 7.5 m , G = 275.52 (10.05 – 7.50)1.456 = 1076 m3/s
  • 16.
    20-Dec-22 mengistuzantet@mtu.edu.et lecturer@ Hydraulic andwater resources Engineering Department 16
  • 17.
    B) Shifting Control 20-Dec-22 mengistuzantet@mtu.edu.et lecturer@Hydraulic and water resources Engineering Department 17 The control that exists at a gauging section giving rise to a unique stage- discharge relationship can change due to: (i) changing characteristics caused by weed growth (ii) dredging or channel encroachment (iii) aggradation or degradation phenomenon in an alluvial channel (iv) variable backwater effects affecting the gauging section and (v) unsteady flow effects of a rapidly changing stage
  • 18.
    Shifting controls dueto causes variable backwater effects affecting the gauging section. 20-Dec-22 mengistuzantet@mtu.edu.et lecturer@ Hydraulic and water resources Engineering Department 18 1) If the shifting control is due to variable backwater curves, the same stage will indicate different discharges depending upon the backwater effect. To remedy this situation another gauge, called the secondary gauge or auxiliary gauge is installed some distance downstream of the gauging section and readings of both gauges are taken. 2) The difference between the main gauge and the secondary gauge gives the fall (F) of the water surface in the reach. 3) Now, for a given main-stage reading, the discharge under variable backwater condition is a function of the fall F, i.e. Q = f(G, F)
  • 19.
    20-Dec-22 mengistuzantet@mtu.edu.et lecturer@ Hydraulic andwater resources Engineering Department 19
  • 20.
    Example #2 An auxiliarygauge was used downstream of a main gauge in a river to provide corrections to the gauge-discharge relationship due to backwater effects. The following data were noted at a certain main gauge reading 20-Dec-22 mengistuzantet@mtu.edu.et lecturer@ Hydraulic and water resources Engineering Department 20
  • 21.
    Solution 20-Dec-22 mengistuzantet@mtu.edu.et lecturer@ Hydraulic andwater resources Engineering Department 21 Fall (F) = main gauge reading – auxiliary gauge reading.  When F1 = (86.00 – 85.50) = 0.50 m Q1 = 275 m3/s  F2= (86.00 – 84.80) = 1.20 m , Q2 = 600 m3/s  By Equation Q = Q2 (F/F2) m OR (275/600) = (0.50/1.20)m  Hence solving m = 0.891  When the auxiliary gauge reads 85.30 m, at a main gauge reading of 86.00 m, Fall F = (86.00 – 85.30) = 0.70 m and Q = Q2 (F/F2) = 600 (0.70/1.20)0.891 = 371 m3/s
  • 22.
    Exercise The following datawere obtained by stream gauging of a river: Main gauge staff reading (m) 12.00 12.00 Auxiliary gauge staff reading (m) 11.65 11.02 Discharge (cumec) 9.50 15.20 what should be the discharge when the main gauge reads 12 m and the auxiliary gauge reads 11.37 m? 22
  • 23.
    2) Extrapolation ofRating Curve 20-Dec-22 mengistuzantet@mtu.edu.et lecturer@ Hydraulic and water resources Engineering Department 23 Most hydrological designs consider extreme flood flows Example, in the design of hydraulic structures, such as barrages, dams and bridges one needs maximum flood discharges as well as maximum flood levels. Before attempting extrapolation, it is necessary to examine the site and collect relevant data on changes in the river cross-section due to flood plains, roughness and backwater effects.
  • 24.
    Cont.. 20-Dec-22 mengistuzantet@mtu.edu.et lecturer@ Hydraulic andwater resources Engineering Department 24 The reliability of the extrapolated value depends on the stability of the gauging section. Extrapolation of the rating curve in an alluvial river subjected to aggradation and degradation is unreliable and the results should always be confirmed by alternate methods
  • 25.
    Techniques of extendingthe rating curve 20-Dec-22 mengistuzantet@mtu.edu.et lecturer@ Hydraulic and water resources Engineering Department 25 A) Conveyance Method B) Logarithmic-Plot Method
  • 26.
    A) Conveyance Method 20-Dec-22 mengistuzantet@mtu.edu.et lecturer@Hydraulic and water resources Engineering Department 26 The conveyance of a channel in non uniform flow is defined by the relation Q = K * S f where Q = discharge in the channel, Sf = slope of the energy line and K = conveyance. If Manning’s formula is used
  • 27.
  • 28.
    B) Logarithmic-Plot Method 20-Dec-22 mengistuzantet@mtu.edu.et lecturer@Hydraulic and water resources Engineering Department 28  The stage is plotted against the discharge on a log– log paper.  A best-fit linear relation-ship is obtained for data points lying in the high-stage range and the line is extended to cover the range of extrapolation
  • 29.
    where the dependentvariable X = log (G – a) and Y = log Q. The coefficients ∂ and C are obtained as, 20-Dec-22
  • 30.
    Example 20-Dec-22 mengistuzantet@mtu.edu.et lecturer@ Hydraulic andwater resources Engineering Department 30 For the stage-discharge data of Example #1, fit a regression equation for use in estimation of stage for a known value of discharge. Use a value of 7.50 m as the gauge reading corresponding to zero discharge. Determine the stage for a discharge of 3500 m3/s.
  • 31.
    Solution The regression equationis 20-Dec-22 mengistuzantet@mtu.edu.et lecturer@ Hydraulic and water resources Engineering Department 31
  • 32.
    20-Dec-22 mengistuzantet@mtu.edu.et lecturer@ Hydraulic andwater resources Engineering Department 32
  • 33.
    3) Hydrometry Stations 20-Dec-22 mengistuzantet@mtu.edu.et lecturer@Hydraulic and water resources Engineering Department 33 As the measurement of discharge is of paramount importance in applied hydrologic studies, considerable expenditure and effort are being expended in every country to collect and store this valuable historic data
  • 34.
    WMO Criteria forHydrometry Station Density 20-Dec-22 mengistuzantet@mtu.edu.et lecturer@ Hydraulic and water resources Engineering Department 34
  • 35.
    General truth 20-Dec-22 mengistuzantet@mtu.edu.et lecturer@ Hydraulicand water resources Engineering Department 35 Hydrometry stations must be sited in adequate number in the catchment area of all major streams so that the water potential of an area can be assessed as accurately as possible
  • 36.
    20-Dec-22 mengistuzantet@mtu.edu.et lecturer@ Hydraulic andwater resources Engineering Department 36
  • 37.
    THE END 20-Dec-22 mengistuzantet@mtu.edu.et lecturer@ Hydraulicand water resources Engineering Department 37