Downloaded 44 times

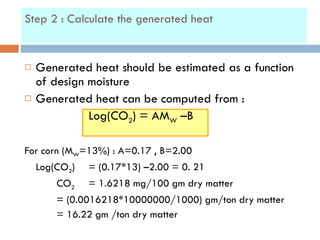


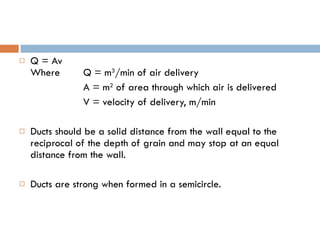
![Step 4 : Calculate equilibrium relative humidity Equilibrium relative humidity or reciprocally, grain moisture in equilibrium with air, may be computed using the information from Table with the following equations : M D = E – F * ln [-R*(T+C) ln(RH)] Where M D = decimal moisture, dry basis R = universal gas constant = 1.987 T = Temperature, °C RH = Relative humidity, decimal EXP = “e” to the power, “e” = 2.71828 A,B,C,E,F = equilibrium constants](https://image.slidesharecdn.com/storagedesignforcorn-yp-111223045551-phpapp02/85/Storage-design-for-corn-yp-9-320.jpg)
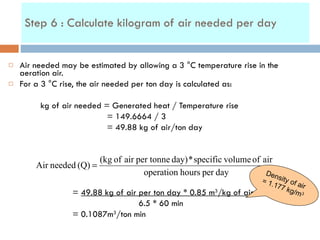
![M D =0.13/0.87 = 0.1494 From table : A = 620.56 , B = 16.958 , C = 30.205 T = 30 °C RH = 0.6625 or 66.25% 0.1494)] * 16.958 EXP( * 30.205) (30 * 1.987 620.56 EXP[ RH ](https://image.slidesharecdn.com/storagedesignforcorn-yp-111223045551-phpapp02/85/Storage-design-for-corn-yp-10-320.jpg)


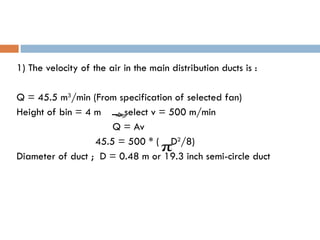


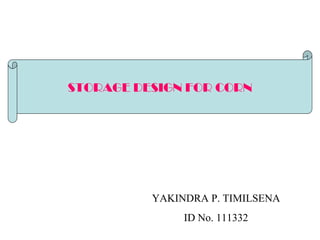
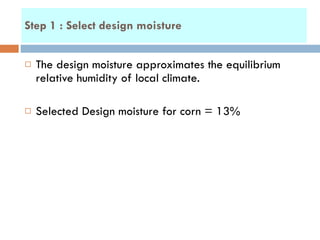
This document provides a 10 step design for aeration of bulk corn storage in a 6m x 5m x 4m bin. It involves: 1) Selecting a design moisture of 13% and calculating generated heat of 149.66 kJ/ton/day. 2) Determining the design day based on local weather data and calculating equilibrium relative humidity. 3) Determining hours of operation per day as 6.5 hours when RH is below equilibrium. 4) Calculating air needed as 49.88 kg/ton/day for a 3°C temperature rise. 5) Selecting a 20" diameter, 3HP fan that can deliver 45.5 m3/min of air


