This paper simulates natural air drying of maize in Argentina to evaluate two drying modes: ambient drying and near ambient drying. Ambient drying draws air through fans downstream of the grain bed, while near ambient drying blows air upstream and takes advantage of increased air temperature from passing through the fan. Simulation results found near ambient drying reduced drying time by 12% and energy consumption by up to 30% compared to ambient drying. Near ambient drying was also able to complete the drying process in April when ambient drying could not reach the target moisture content due to weather conditions.
The International Journal of Engineering and Science (The IJES)theijes
The International Journal of Engineering & Science is aimed at providing a platform for researchers, engineers, scientists, or educators to publish their original research results, to exchange new ideas, to disseminate information in innovative designs, engineering experiences and technological skills. It is also the Journal's objective to promote engineering and technology education. All papers submitted to the Journal will be blind peer-reviewed. Only original articles will be published.
The papers for publication in The International Journal of Engineering& Science are selected through rigorous peer reviews to ensure originality, timeliness, relevance, and readability
Effect of different Mulching Materials on the Yield of Quality Protein Maize ...Agriculture Journal IJOEAR
— Field research was conducted on the effects of different mulching materials on the yield of Quantity protein maize which include polythene sheet, dry grasses and control. The different mulching materials were tested on nine (9) ridges each measuring 10m. The research was laid out in a completely randomized block design each treatment replicated three times. The parameters measured include weight of cobs, weight of 100grain, and total grain, there was no statistical difference in the weight cobs among all the treatments, similarly, there was also no statistical different in the weight of 100 grain. As far the weight of grain per 5m 2 there was a significant difference among the treatments with polythene sheet covered plots that have 0.25kg, however, the grass-mulched plots 0.16kg was statistically similar to the control plots 0.15kg. And finally for store weight observed per 5m 2 , polythene sheet covered plots were significantly higher than grass-mulched plots which are also significantly different to control plots with the values of 1.23kg, 1.21kg and 0.71kg respectively.
Jatropha-based alley cropping system’s contribution to carbon sequestrationInnspub Net
The study was conducted to evaluate the total carbon stocks sequestered in a Jatropha – based alley cropping system treated with varying fertilizer applications. The study was laid out in Randomized Complete Block Design with three replications. The alley was planted with corn in two seasons Treatments include control (no fertilizer), organic fertilizer and inorganic fertilizer applied to the alley crops. Findings showed that the treatments with fertilizer applications had higher carbon stock in the jatropha hedges. The carbon content of the corn stover was also higher in organic and inorganic fertilizer-applied treatments. However, highest soil carbon content was shown in treatments applied with organic fertilizer (4.28 Ton ha-1). The inorganic fertilizer treatment had the lowest soil carbon content with a mean of 4.28 Ton ha-1. In terms of total carbon stock of the entire jatropha-based alley cropping system, there was a significant difference among treatments with organic fertilizer application having the highest mean of 7.79 Ton ha-1 while the inorganic treated plots had 6.53 Ton ha-1. The no fertilizer treatment had the least carbon stocks with 6.53 Ton ha-1. This recent study revealed that the jatropha-based alley cropping system is a potential land-use for carbon sequestration. This farming system needs to be promoted in upland areas to function not only as soil and water conservation measures but also as a possible remedy for global warming. Get the Abstract and full articles at: http://www.innspub.net/ijaar/jatropha-based-alley-cropping-systems-contribution-to-carbon-sequestration/
Microclimate Modification Using Eco-Friendly Nets & Floating Row Covers Improves Tomato Yield & Quality for Small Holder Farmers in East Africa; Gardening Guidebook for East Africa ~ Egerton University~ For more information, Please see websites below:
`
Organic Edible Schoolyards & Gardening with Children =
http://scribd.com/doc/239851214 ~
`
Double Food Production from your School Garden with Organic Tech =
http://scribd.com/doc/239851079 ~
`
Free School Gardening Art Posters =
http://scribd.com/doc/239851159 ~
`
Increase Food Production with Companion Planting in your School Garden =
http://scribd.com/doc/239851159 ~
`
Healthy Foods Dramatically Improves Student Academic Success =
http://scribd.com/doc/239851348 ~
`
City Chickens for your Organic School Garden =
http://scribd.com/doc/239850440 ~
`
Huerto Ecológico, Tecnologías Sostenibles, Agricultura Organica
http://scribd.com/doc/239850233
`
Simple Square Foot Gardening for Schools - Teacher Guide =
http://scribd.com/doc/239851110
The International Journal of Engineering and Science (The IJES)theijes
The International Journal of Engineering & Science is aimed at providing a platform for researchers, engineers, scientists, or educators to publish their original research results, to exchange new ideas, to disseminate information in innovative designs, engineering experiences and technological skills. It is also the Journal's objective to promote engineering and technology education. All papers submitted to the Journal will be blind peer-reviewed. Only original articles will be published.
The International Journal of Engineering & Science is aimed at providing a platform for researchers, engineers, scientists, or educators to publish their original research results, to exchange new ideas, to disseminate information in innovative designs, engineering experiences and technological skills. It is also the Journal's objective to promote engineering and technology education. All papers submitted to the Journal will be blind peer-reviewed. Only original articles will be published.
Investigation of the appropriate cooking temperature for freshly harvested ma...eSAT Journals
Abstract
The investigation of the appropriate cooking temperature for freshly harvested mature corn cobs is presented. The process of Combination cooking method was utilized in the experimentation to ensure the achievement of the appropriate temperature and duration for the cooking stage. The appropriate cooking temperature and duration was found to be 195oC and 30 minutes respectively. Variations in initial moisture content of the freshly harvested cobs (69.7 - 85.3% wb) did not affect the cooking temperature and duration. Cooking at the determined appropriate temperature and duration resulted in a properly cooked corn cob. Keywords: Browning; Fresh Corn; Cooking Temperature; moisture content
Comparative Heat Conduction Model of a Cold Storage with Puf & Eps Insulation...IJERA Editor
In this project work a mathematical heat conduction model of a cold storage (with the help of computer program; and multiple regression analysis) has been proposed which can be used for further development of cold storages in the upcoming future. In cold storage refrigeration system brings down the temperature initially during start up but thermal insulation maintains the temperature later on continuously. In this view, the simple methodology is presented to calculate heat transfer by analytical method also attempt has been made to minimize the energy consumption by replacing 150 mm Expanded polystyrene (EPS) by 100 mm Poly Urethane foam (PUF) insulation. The methodology is validated against actual data obtained from Penguin cold storage situated in Pune, India. Insulation thickness of the side walls (TW), area of the wall (AW), and insulation thickness of the roof (TR) have been chosen as predictor variables of the study.
International Journal of Computational Engineering Research(IJCER) is an intentional online Journal in English monthly publishing journal. This Journal publish original research work that contributes significantly to further the scientific knowledge in engineering and Technology.
IOSR Journal of Applied Physics (IOSR-JAP) is an open access international journal that provides rapid publication (within a month) of articles in all areas of physics and its applications. The journal welcomes publications of high quality papers on theoretical developments and practical applications in applied physics. Original research papers, state-of-the-art reviews, and high quality technical notes are invited for publications.
Design and Experimentation of Collector based Solar Dryer with Recirculation ...IJERA Editor
Sun drying system is very common method of preserving agricultural product. Solar energy is used for heating
of air and to dry food substance. In open sun drying food is unprotected from rain, wind-borne dirt and dust,
infestation by insects, rodents and other animal. This process is practically attractive and environmentally sound.
Shell life of agricultural product is improve by drying. This paper present design and construction of active solar
dryer with recirculation technique. It consists of solar collector, drying chamber with netted trays and
recirculation arrangement. Air is allowed through inlet and it is heated up in collector. Then it is circulated in
drying chamber where it is utilize for drying. The design based on geographical location Wardha and
meteorological data were obtained for proper design specification. Locally available materials were used for
construction such as polyurethane glass, mild steel metal sheet, plywood sheet and insulating material.
International Journal of Engineering Research and Development (IJERD)IJERD Editor
call for paper 2012, hard copy of journal, research paper publishing, where to publish research paper,
journal publishing, how to publish research paper, Call For research paper, international journal, publishing a paper, IJERD, journal of science and technology, how to get a research paper published, publishing a paper, publishing of journal, publishing of research paper, reserach and review articles, IJERD Journal, How to publish your research paper, publish research paper, open access engineering journal, Engineering journal, Mathemetics journal, Physics journal, Chemistry journal, Computer Engineering, Computer Science journal, how to submit your paper, peer reviw journal, indexed journal, reserach and review articles, engineering journal, www.ijerd.com, research journals,
yahoo journals, bing journals, International Journal of Engineering Research and Development, google journals, hard copy of journal
Experiment Analysis of Open, Simple and Modified Greenhouse Dryers for Drying...RSIS International
The use of solar energy in open sun drying in
traditional way of drying crops, fruits, vegetables etc. The
greenhouse drying is one of the techniques which overcome the
problems associated with open sun drying. In the present work,
an effort is made to improve the drying rate of traditional
greenhouse dryer. An experimental investigation using tomato
flakes has been done to compare the drying rates of both
traditional as well as modified greenhouse dryers. Better drying
conditions- high temperature & low relative humidity are found
out to be for modified greenhouse dryer. Experiments were
performed in October 2016.
Determination of thin layer solar drying kinetics of cassava noodles (tapioca)eSAT Journals
Abstract
The aim of this study is to determine the thin-layer drying kinetics of cassava noodles (tapioca) using a solar dryer. To achieve this, an integral type forced convection solar dryer, equipped with rock storage, was developed. Drying kinetics of tapioca were determined using the solar dryer. The treatments in the experiment comprise of air flow velocities (V) of 1.5, 2.5, and 3.5 m/s; and drying layer thicknesses (B) of 0.48 and 0.72 cm. Tapioca samples were dried from an average initial moisture content of 297% (dry basis) to 9.8% (dry basis). Control experiments in the form of open air sun drying of similar quantity of tapioca were also set up and monitored. Graphical plots of moisture content versus drying time, exhibited the characteristic moisture desorption curve, characterized by initial high rate of moisture removal, followed by a slower rate of moisture removal. It was observed from drying rate curves plotted using the drying data, that the drying of the tapioca took place entirely in the falling rate period. The drying rate of the tapioca varied with the different combinations of velocity and drying layer thickness. The drying rate of the tapioca increased with increase in the air flow velocity until velocity of 2.5 m/s; beyond this velocity the drying rate reduced slightly. Also the drying rate of tapioca decreased with increase in drying layer thickness. A maximum drying rate of 39.2%/hr was obtained during the experiment. The maximum system drying efficiency of the dryer was determined as 47.14%, while the maximum dryer pick-up efficiency of 50% was determined during the drying test.
Keywords: Air Flow Velocity, Drying Rate, Forced Convection, Layer Thickness, Moisture Content, Solar Dryer
An Experimental Study on Drying Kinetics of Guava Fruit (Psidium Guajava L) B...iosrjce
The thin layer drying behavior of Psidium guajava L (guava fruit) cultivar Rayalaseema area AP,
India, were studied experimentally to examine the influence of drying air temperature, slice thickness, and air
velocity on the drying curves. Drying operation was carried out at 55oC, 60oC and 65oC temperatures, at slice
thickness of 2.5 mm, 4 mm and 6 mm at 1 and 1.5 m/sec velocities. The predominant falling rate drying regime
was observed. The analysis reveals that, the drying temperature and slice thickness has a significant effect and
velocity has a least effect on moisture removal. Drying rate is found to increase with the increase in air
temperature and thus reduced the drying time. Drying time increases with increase in slice thickness. The
various drying models in defining the suitability of drying behavior were examined by statistical analysis. The
analysis reveals, that the Henderson and Pabis model is better model that explains the drying behavior of
Guava Fruit (R2=0.993).
Performance Evaluation of a Developed Multipurpose Solar Dryerijtsrd
Post harvest losses in developing countries have contributed to the unavailability of foodstuff. Estimation of these losses is generally cited to be of the order of 4 but under very adverse conditions, it is estimated as high as 100 . A significant percentage of these losses are related to improper and or untimely preservation of foodstuffs. This research work is therefore aimed at developing a multipurpose solar dryer. The solar dryer consists mainly of solar collector and dryer chamber compartment. The materials used in this research work include based frame, transparent fiberglass cover, an absorber oven baked Aluminium , thermometer, wire gauze, etc. The frame was constructed from a wood bars with a dimension of 900 mm x 900 mm x 600 mm. The dryer chamber is a truncated rectangle and it comprises of a double walls made up of a plain ply board measuring 800 mm x 800 mm x by 500 mm with a transparent fiberglass cover inclined at an angle of 15o. Three different samples namely sample A sliced plantains , sample B sliced yams , and sample C fish were used for test performance evaluation of the developed multipurpose solar dryer. The results obtained reveal that overall heat energy transfer coefficient of 4.91w m0C, dryer chamber rate of 0.654 kg hr., and dryer chamber area of 0.659 m2 were required by the solar dryer. Besides, the solar dryer dried the three samples used in this research work within duration of 8 hours i.e., 9am 5pm . The maximum solar chamber dryer temperature and ambient temperature were recorded as 55.00 oC and 35.46 oC respectively. Besides, the minimum lower temperature values recorded were obtained as 40.45 oC for solar chamber dryer temperature and 29.02 oC for ambient temperature. The improved results obtained with the multipurpose solar dryer were due to improved temperature obtained with the solar dryer chamber. Orhorhoro EK | Aregbe O | Tamuno RI "Performance Evaluation of a Developed Multipurpose Solar Dryer" Published in International Journal of Trend in Scientific Research and Development (ijtsrd), ISSN: 2456-6470, Volume-4 | Issue-4 , June 2020, URL: https://www.ijtsrd.com/papers/ijtsrd31195.pdf Paper Url :https://www.ijtsrd.com/engineering/mechanical-engineering/31195/performance-evaluation-of-a-developed-multipurpose-solar-dryer/orhorhoro-ek
The performance of a fluidized bed dryer integrated biomass furnace with air preheater (FBD with APH) and a fluidized bed dryer integrated biomass furnace without air preheater (FBD without APH) for drying of paddy have been evaluated. The FBD with APH and FBD without APH decreased the moisture of paddy from 24% (wet basis) to 14% (wet basis) within 43 and 47 minutes with average temperatures and relative humidities of 59.58 oC and 59.14oC, and 18.81% and 18.68%, respectively. The drying rate of paddy varied in the range of 0.11 kg/min-0.32 kg/min and 0.10 kg/min- 0.30 kg/min for FBD with APH and FBD without APH, with average values of 0.18kg/min and 0.17kg/min, respectively. The minimum, maximum, and average value specific moisture evaporation rate (SMER) was 0.20 kg/kWh, 0.57 kg/kWh, and 0.31 kg/kWh, respectively for FBD with APH, as well as 0.149 kg/kWh, 0.448 kg/kWh, and 0.252 kg/kWh, respectively, for FBD without APH. The specific energy consumption (SEC), the specific electrical energy consumption (SEEC), and the specific thermal energy consumption (STEC) were varied from 1.749 kWh/kg to 5.076 kWh/kg, 0.090 kWh/kg to 2.872 kWh/kg, and 0.760 kWh/kg to 2.204 kWh/kg, with average values of 3.528 kWh/kg, 1.96 kWh/kg, and 1.532 kWh/kg, respectively for FBD with APH, as well as from 2.234 kWh/kg to 6.702 kWh/kg, 1.056 kWh/kg to 3.167 kWh/kg, and 1.179 kWh/kg to 3.536 kWh/kg, with average values of 4.391 kWh/kg, 2.075 kWh/kg, and 2.316 kWh/kg, respectively, for FBD without APH. The thermal efficiencies of the FBD with APH and FBD without APH were varied between 12.4% and 37.93%, and 9.78% and 29.82%, resvectively, with average values of 20.78% and 16.61%. The thermal efficiency of FBD with APH was higher compared to FBD without APH.
Effect of conservation agriculture on soil moisture content and biomass water...Innspub Net
One of the important principles of Conservation Agriculture is the permanent soil cover with crop residues which enhances soil and water productivity that leads to improved agricultural productivity. The effect of crop residues on soil moisture content, relative growth rate and biomass water productivity were examined in a completely randomized design at the University of Reading, Berkshire district, England. Straw treatment was significant on moisture content and water use efficiency at (p< 0.01) respectively while there is no significant difference on mean relative growth rate and dry final biomass weights. The study concluded that soil moisture content is conserved with increased use of crop residues as soil cover. The study therefore recommended that project based research on Conservation Agriculture should be carried out by governments and NGO’s that will involve farmers; also they should provide support for the knowledge diffusion of Conservation Agriculture to local farmers since it will improve yield and productivity. Extension agents and other agencies that work with farmers should also be properly trained to be able to disseminate this technology to farmers.
The aonla (Phyllanthus emblica), a fruit rich in vitamin-C, has high medicinal importance in
human life. Drying of aonla in the form of flakes and powder is one of the widely used methods of
its preservation. Thermal kinetics during drying a hygroscopic material in thin layer, the moisture
ratio is calculated by the Half Life Time Method. The experiment was conducted at an average
velocity of 0.48m/s, relative humidity 35% and temperature in the range from 40 to 750C. Comparing
the experimental values with the predicted values using Newton’s Model, Page Model, Modified
Page Model on the basis of Root Mean Square Error (RMSE), chi-square(χ
2
) and Efficiency (EF),
RMSE and χ
2 were found lowest and EF .RMSE lay between 0.0382 and 0.0094, reduced χ
2
between 0.000132 and 0.00761 and EF between 0.9598 and 0.9985.Thus, this thermal kinetic model
can be used to predict the moisture of the aonla at any drying instant during thin layer drying
process with reasonable accuracy.
In order to predict or control the behavior of a drying system, drying conditions were investigated by computer simulation and fieldwork activities. Test runs with dryers were carried out
over a long period of time at many locations across the country. Drying conditions for rice and tomato are proposed
Similar to Simulation of natural air drying of maize in a typical location of argentina influence of air heating through the fa (20)
Implicitly or explicitly all competing businesses employ a strategy to select a mix
of marketing resources. Formulating such competitive strategies fundamentally
involves recognizing relationships between elements of the marketing mix (e.g.,
price and product quality), as well as assessing competitive and market conditions
(i.e., industry structure in the language of economics).
Tata Group Dials Taiwan for Its Chipmaking Ambition in Gujarat’s DholeraAvirahi City Dholera
The Tata Group, a titan of Indian industry, is making waves with its advanced talks with Taiwanese chipmakers Powerchip Semiconductor Manufacturing Corporation (PSMC) and UMC Group. The goal? Establishing a cutting-edge semiconductor fabrication unit (fab) in Dholera, Gujarat. This isn’t just any project; it’s a potential game changer for India’s chipmaking aspirations and a boon for investors seeking promising residential projects in dholera sir.
Visit : https://www.avirahi.com/blog/tata-group-dials-taiwan-for-its-chipmaking-ambition-in-gujarats-dholera/
LA HUG - Video Testimonials with Chynna Morgan - June 2024Lital Barkan
Have you ever heard that user-generated content or video testimonials can take your brand to the next level? We will explore how you can effectively use video testimonials to leverage and boost your sales, content strategy, and increase your CRM data.🤯
We will dig deeper into:
1. How to capture video testimonials that convert from your audience 🎥
2. How to leverage your testimonials to boost your sales 💲
3. How you can capture more CRM data to understand your audience better through video testimonials. 📊
Affordable Stationery Printing Services in Jaipur | Navpack n PrintNavpack & Print
Looking for professional printing services in Jaipur? Navpack n Print offers high-quality and affordable stationery printing for all your business needs. Stand out with custom stationery designs and fast turnaround times. Contact us today for a quote!
Business Valuation Principles for EntrepreneursBen Wann
This insightful presentation is designed to equip entrepreneurs with the essential knowledge and tools needed to accurately value their businesses. Understanding business valuation is crucial for making informed decisions, whether you're seeking investment, planning to sell, or simply want to gauge your company's worth.
Improving profitability for small businessBen Wann
In this comprehensive presentation, we will explore strategies and practical tips for enhancing profitability in small businesses. Tailored to meet the unique challenges faced by small enterprises, this session covers various aspects that directly impact the bottom line. Attendees will learn how to optimize operational efficiency, manage expenses, and increase revenue through innovative marketing and customer engagement techniques.
"𝑩𝑬𝑮𝑼𝑵 𝑾𝑰𝑻𝑯 𝑻𝑱 𝑰𝑺 𝑯𝑨𝑳𝑭 𝑫𝑶𝑵𝑬"
𝐓𝐉 𝐂𝐨𝐦𝐬 (𝐓𝐉 𝐂𝐨𝐦𝐦𝐮𝐧𝐢𝐜𝐚𝐭𝐢𝐨𝐧𝐬) is a professional event agency that includes experts in the event-organizing market in Vietnam, Korea, and ASEAN countries. We provide unlimited types of events from Music concerts, Fan meetings, and Culture festivals to Corporate events, Internal company events, Golf tournaments, MICE events, and Exhibitions.
𝐓𝐉 𝐂𝐨𝐦𝐬 provides unlimited package services including such as Event organizing, Event planning, Event production, Manpower, PR marketing, Design 2D/3D, VIP protocols, Interpreter agency, etc.
Sports events - Golf competitions/billiards competitions/company sports events: dynamic and challenging
⭐ 𝐅𝐞𝐚𝐭𝐮𝐫𝐞𝐝 𝐩𝐫𝐨𝐣𝐞𝐜𝐭𝐬:
➢ 2024 BAEKHYUN [Lonsdaleite] IN HO CHI MINH
➢ SUPER JUNIOR-L.S.S. THE SHOW : Th3ee Guys in HO CHI MINH
➢FreenBecky 1st Fan Meeting in Vietnam
➢CHILDREN ART EXHIBITION 2024: BEYOND BARRIERS
➢ WOW K-Music Festival 2023
➢ Winner [CROSS] Tour in HCM
➢ Super Show 9 in HCM with Super Junior
➢ HCMC - Gyeongsangbuk-do Culture and Tourism Festival
➢ Korean Vietnam Partnership - Fair with LG
➢ Korean President visits Samsung Electronics R&D Center
➢ Vietnam Food Expo with Lotte Wellfood
"𝐄𝐯𝐞𝐫𝐲 𝐞𝐯𝐞𝐧𝐭 𝐢𝐬 𝐚 𝐬𝐭𝐨𝐫𝐲, 𝐚 𝐬𝐩𝐞𝐜𝐢𝐚𝐥 𝐣𝐨𝐮𝐫𝐧𝐞𝐲. 𝐖𝐞 𝐚𝐥𝐰𝐚𝐲𝐬 𝐛𝐞𝐥𝐢𝐞𝐯𝐞 𝐭𝐡𝐚𝐭 𝐬𝐡𝐨𝐫𝐭𝐥𝐲 𝐲𝐨𝐮 𝐰𝐢𝐥𝐥 𝐛𝐞 𝐚 𝐩𝐚𝐫𝐭 𝐨𝐟 𝐨𝐮𝐫 𝐬𝐭𝐨𝐫𝐢𝐞𝐬."
RMD24 | Debunking the non-endemic revenue myth Marvin Vacquier Droop | First ...BBPMedia1
Marvin neemt je in deze presentatie mee in de voordelen van non-endemic advertising op retail media netwerken. Hij brengt ook de uitdagingen in beeld die de markt op dit moment heeft op het gebied van retail media voor niet-leveranciers.
Retail media wordt gezien als het nieuwe advertising-medium en ook mediabureaus richten massaal retail media-afdelingen op. Merken die niet in de betreffende winkel liggen staan ook nog niet in de rij om op de retail media netwerken te adverteren. Marvin belicht de uitdagingen die er zijn om echt aansluiting te vinden op die markt van non-endemic advertising.
Putting the SPARK into Virtual Training.pptxCynthia Clay
This 60-minute webinar, sponsored by Adobe, was delivered for the Training Mag Network. It explored the five elements of SPARK: Storytelling, Purpose, Action, Relationships, and Kudos. Knowing how to tell a well-structured story is key to building long-term memory. Stating a clear purpose that doesn't take away from the discovery learning process is critical. Ensuring that people move from theory to practical application is imperative. Creating strong social learning is the key to commitment and engagement. Validating and affirming participants' comments is the way to create a positive learning environment.
Discover the innovative and creative projects that highlight my journey throu...dylandmeas
Discover the innovative and creative projects that highlight my journey through Full Sail University. Below, you’ll find a collection of my work showcasing my skills and expertise in digital marketing, event planning, and media production.
Falcon stands out as a top-tier P2P Invoice Discounting platform in India, bridging esteemed blue-chip companies and eager investors. Our goal is to transform the investment landscape in India by establishing a comprehensive destination for borrowers and investors with diverse profiles and needs, all while minimizing risk. What sets Falcon apart is the elimination of intermediaries such as commercial banks and depository institutions, allowing investors to enjoy higher yields.
Attending a job Interview for B1 and B2 Englsih learnersErika906060
It is a sample of an interview for a business english class for pre-intermediate and intermediate english students with emphasis on the speking ability.
What is the TDS Return Filing Due Date for FY 2024-25.pdfseoforlegalpillers
It is crucial for the taxpayers to understand about the TDS Return Filing Due Date, so that they can fulfill your TDS obligations efficiently. Taxpayers can avoid penalties by sticking to the deadlines and by accurate filing of TDS. Timely filing of TDS will make sure about the availability of tax credits. You can also seek the professional guidance of experts like Legal Pillers for timely filing of the TDS Return.
Unveiling the Secrets How Does Generative AI Work.pdfSam H
At its core, generative artificial intelligence relies on the concept of generative models, which serve as engines that churn out entirely new data resembling their training data. It is like a sculptor who has studied so many forms found in nature and then uses this knowledge to create sculptures from his imagination that have never been seen before anywhere else. If taken to cyberspace, gans work almost the same way.
Premium MEAN Stack Development Solutions for Modern BusinessesSynapseIndia
Stay ahead of the curve with our premium MEAN Stack Development Solutions. Our expert developers utilize MongoDB, Express.js, AngularJS, and Node.js to create modern and responsive web applications. Trust us for cutting-edge solutions that drive your business growth and success.
Know more: https://www.synapseindia.com/technology/mean-stack-development-company.html
Simulation of natural air drying of maize in a typical location of argentina influence of air heating through the fa
1. Research Paper
Simulation of natural air drying of maize in a typical location
of Argentina: Influence of air heating through the fan
M. Martinello a,
*, S. Giner b,c
a
Universidad Nacional de Rı´o Cuarto, Ruta 36 Km 601, (5800) Rı´o Cuarto, Argentina
b
Investigador CICPBA, Lugar de Trabajo, CIDCA-Universidad Nacional de La Plata, Calle 47 y 116, (1900) La Plata, Argentina
c
A´ rea Departamental Ingenierı´a Quı´mica, Facultad de Ingenierı´a, UNLP, Argentina
a r t i c l e i n f o
Article history:
Received 13 April 2009
Received in revised form
15 February 2010
Accepted 11 June 2010
Published online xxx
Current demand for the near ambient dried grains is growing, because this slow process
tends to produce less fissures. This is especially important in flint maize. Near ambient
drying may also use less energy and reduce greenhouse emissions. It is also called low-
temperature or natural air drying can be considered as an alternative process to produce
high-quality dried corn. Two operational modes for the low-temperature drying of maize
produced in a typical location Argentina were evaluated using simulation: (1) ambient
drying, which operates by drawing the air using fans located downstream the grain bed
and (2) near ambient drying, which, by blowing the air upstream the grain bed, takes
advantage of the air temperature rise through the fan. Drying time and specific energy
consumption were calculated by using a simulation program.
Air heating through the fan in near ambient drying is a beneficial effect which reduces
energy expenditure and process duration The specific energy consumption varied from 0.3
up to 2.6 MJ kgÀ1
water evaporated. Savings of energy consumption of up to 30% were
predicted for the near ambient mode with respect to the ambient mode, and the reductions
in drying time were of about 12%. At the location tested (Junı´n, Province of Buenos Aires,
Argentina) ambient drying may not be able to reach the target moisture content in April,
unlike near ambient drying, which allows the process to be completed.
ª 2010 IAgrE. Published by Elsevier Ltd. All rights reserved.
1. Introduction
Food industry uses hard red flint maize as raw material to
manufacture “corn flakes”. The grain quality parameter
required is the ability to produce a high proportion of coarse
fractions of maize, called flaking grits, during dry milling.
This characteristic depends on grain hardness and size
(Robutti, Borra´s, & Eyherabide, 1997; Robutti, Borra´s, Ferrer,
& Bietz, 2000; Robutti, Borra´s, Ferrer, Percibaldi, & Knutson,
2000) and, particularly, depends on the predominance of
horny over floury endosperm (Watson, 1988). Unlike flint
maize, dent maize endosperm is predominantly floury and
less suitable for processing into corn flakes. In order to
obtain coarse dry milling fractions, the development of
fissures must be avoided. For instance the limit between
horny and floury endosperms is a fault line that may break
under stress, though this may not become apparent to the
naked eye because the pericarp is opaque and holds the two
types of endosperm together. However, the mechanised
transport of fissured grain in augers, or free-fall inside bins
may produce a high percentage of broken grains in the final
product.
* Corresponding author. Fax: þ54 358 4676246.
E-mail addresses: mmartinello@ing.unrc.edu.ar (M. Martinello), saginer@ing.unlp.edu.ar (S. Giner).
Available at www.sciencedirect.com
journal homepage: www.elsevier.com/locate/issn/15375110
b i o s y s t e m s e n g i n e e r i n g x x x ( 2 0 1 0 ) 1 e1 0
Please cite this article in press as: Martinello, M., Giner, S., Simulation of natural air drying of maize in a typical location of
Argentina: Influence of air heating through the fan, Biosystems Engineering (2010), doi:10.1016/j.biosystemseng.2010.06.010
1537-5110/$ e see front matter ª 2010 IAgrE. Published by Elsevier Ltd. All rights reserved.
doi:10.1016/j.biosystemseng.2010.06.010
2. Grain postharvest handling often results in a decrease in
grain quality, in particular in fissuring. Gunasekaran,
Deshpande, Paulsen, and Shove (1985) when studying stress
cracks in four different varieties of maize kernels dried at high
temperatures, found fissures between 35 and 90 mm long with
depths varying between 1.5 and 2 mm (i.e., almost half the
grain thickness). Also, Davidson, Noble, and Brown (2000)
observed an increase in stress cracking and breakage
susceptibility with drying temperature.
Current demand for near ambient of dried flint grains is
growing, because this slow process tend to produce less
fissured, or checked kernels, whilst also reducing energy use
and greenhouse emissions. Near ambient drying, also called
low-temperature/natural air drying produces less fissures in
flint maize and is therefore a suitable alternative for the
production of high-quality grain (Bartosik & Maier, 2004).
Near ambient drying is a process where the air is heated by
up to 5
C over ambient temperature. Specific airflows used in
this type of drying, vary from 1.0 to 2.2 m3
minÀ1
tonneÀ1
which, considering a maize bulk density of 0.75 tonne mÀ3
is
equivalent to 0.013e0.028 m3
[air] sÀ1
mÀ3
[bed]. This allows
for gentle drying that takes several days and even weeks to
complete. Though the specific production rate is low, the
process is inherently energy-efficient and, provided the
moistureetemperatureetime control program is well
managed, will produce high-quality grain. Near ambient
drying can be applied both to small and large production
scales, but its limitations are set by weather conditions, har-
vesting speed and the possible development of mould during
drying (Bartosik Maier, 2004).
It was observed (Lamond, 1982) that the energy received
by ambient air on passing through the fan produces as
a temperature increase (DT ) in the air entering the grain
bed. As a general rule, fans produce an air temperature rise
of about 1e2
C which also decreases the relative humidity
of the air.
Smith and Bailey (1983) have considered this DT when
studying several strategies for drying barley as did Sun,
Pantelides, and Chalabi (1995), who developed a mathe-
matical model and carried out dynamic simulations of
low-temperature drying, comparing the predictions with
experimental data measured on barley. Schoenau, Arinze, and
Sokhansanj (1995) optimised various methods for drying
rapeseed and, when considering near ambient drying,
included the air temperature increase through the fan. Morey,
Cloud, Gustafson, and Petersen (1979) evaluated the drying
performance for several locations in the USA, using weather
conditions and employing different management strategies at
two different airflow rates. They assumed that the drying fan
supplied a total temperature rise of 1.1
C for all conditions.
No assessment has been found on the effect of the air
temperature rise through the fan on the environmentally
important parameter: the specific energy consumption, or on
drying time. To this end a historical series of weather data
(2000e2006) for the city of Junı´n, Province of Buenos Aires,
a typical maize growing area in Argentina, was utilised using
an equilibrium drying model inspired by the work of
Thompson (1972), but modified with a novel version of the
modified ChungePfost equilibrium isotherm equation devel-
oped by Sun (1998), and solved throughout the bed. An explicit
finite difference scheme (Constantinides Mostoufi, 1999)
which did not require iterative calculations in each layer of
the bed was used. The objective of this work was to evaluate
two operation modes of low-temperature drying: (1) ambient
drying, which operates by drawing the air by fans located
downstream the grain bed and (2) near ambient drying, where
air is blown upstream the grain bed, to take advantage of the
air temperature rise through the fan.
Drying calculations were carried out at three specific
volumetric airflows: 0.010, 0.020 and 0.030 m3
[air] mÀ3
[bed]
sÀ1
, accompanied by the prediction of a quality parameter
such as % dry matter loss (DML) by respiration, being the
Nomenclature
Cps maize specific heat, kJ kgÀ1
dry solids
C
Cpa air specific heat, kJ kgÀ1
dry air
C
Dpu pressure drop of air per unit of bed height, Pa mÀ1
Dp total pressure drop in the bed, Pa
Ga air mass flow rate, kg [dry air] sÀ1
mÀ2
Y air absolute humidity, kg [water vapour] kgÀ1
[dry
air]
rh air relative humidity, decimal
Zmax bed depth, m
z coordinate along bed height, m
Psat saturation vapour pressure of water, Pa
Pvap partial pressure of vapour in the drying air, Pa
P absolute pressure of drying air, Pa
Powerfan fan power, W
Qvv specific volumetric airflow, m3
[air] sÀ1
mÀ3
[bed]
Qv volumetric airflow, m3
sÀ1
S cross-sectional area of the bed, m2
Ta air temperature,
C
Ts grain temperature (average value in the grain),
C
t time, s
X grain moisture content (average value in the
grain), kg [water] kgÀ1
[dry matter]
Lw latent heat of desorption of water from maize,
kJ kgÀ1
rs ratio of grain dry matter to grain volume, kg [dry
matter] mÀ3
3 bed void fraction
Superscripts and subscripts
av average
0 initial
in inlet
f final
e equilibrium
i index denoting discrete values of the coordinate
along bed height
j index denoting discrete values of time
b i o s y s t e m s e n g i n e e r i n g x x x ( 2 0 1 0 ) 1 e1 02
Please cite this article in press as: Martinello, M., Giner, S., Simulation of natural air drying of maize in a typical location of
Argentina: Influence of air heating through the fan, Biosystems Engineering (2010), doi:10.1016/j.biosystemseng.2010.06.010
3. maximum allowable value of 0.50% (Bartosik Maier, 2004;
Steele, Saul, Hukill, 1969; Thompson, 1972).
2. Materials and methods
2.1. Model development
The model was developed using macroscopic balances, Eqs.
(1) and (2), where air and grain exchange water and energy at
time t in a grain layer placed between the bed depths z and
z þ Dz. The water balance predicts
rs0ð1 À 30ÞSDzðXtþDt À XtÞ ¼ ÀGaSðYzþDz À YzÞDt (1)
where z and t, express the coordinate in the bed depth direc-
tion and time direction respectively; Ta and Ts are the air and
grain temperatures in
C, X is the grain moisture content, Y is
air absolute humidity, Ga is air mass flow rate rs0 and 30 denote
the density relationship of grain and bed void fraction,
respectively. The product of rs0 and 1 À 30 indicates the bulk
ratio of the bed, while the symbol Lw is the average latent heat
of desorption of water from maize.
In turn, the energy balance is written as follows
rs0ð1 À 30ÞSDzCpsðTs tþDt À TstÞ ¼ ÀGaSDt
À
CpaðTa zþDz À Ta zÞ
þ LwðYzþDz À YzÞ
Á
(2)
by cancelling factors and taking limits for Dt and Dz / 0, the
following expressions are reached.
rs0ð1 À 30Þ
vX
vt
¼ ÀGa
vY
vz
(3)
rs0ð1 À 30ÞCps
vTs
vt
¼ ÀGa
Cpa
vTa
vz
þ Lw
vY
vz
(4)
The accumulation terms in the air phase were compared to the
convective contributions and were neglected (Brooker, Bakker-
Arkema, Hall, 1992). The enthalpy reference was taken at 0
C
with water in liquid state. Thermal and physical properties
were considered constant for this comparative study
(Cps ¼ 2.000 kJ kgÀ1
[dry solids]
CÀ1
; Cpa ¼ 1020 kJ kgÀ1
[dry air]
CÀ1
; rs0 (1 À 30) ¼ 750 kg [dry matter] mÀ3
; Lw ¼ 2.5 Â 103
kJ kgÀ1
).
To relate grain moisture content X and air relative humidity rh
at equilibrium, the modified ChungePfost equation was uti-
lised, with parameters determined for flint maize from a rela-
tively given by Sun (1998)
X ¼ À
1
100C3
ln À
lnðrhÞðTa þ C2Þ
C1
!
(5)
where C1 ¼ 486.1, C2 ¼ 56.98 and C3 ¼ 0.1807.
The following correlation was employed to predict the
saturation water vapour pressure above 0
C as a function of
air temperature (Giner, Mascheroni, Nellist, 1996)
Psat ¼ exp 54:119 À
6547
Ta þ 273:16
À 4:23 LnðTa þ 273:16Þ
!
(6)
The initial condition of grain moisture and temperature in the
bed, and the inlet air temperature and humidity were as follows
t ¼ 0 X ¼ X0 Ts ¼ Ts0 0 z Zmax
z ¼ 0 Y ¼ Yin Ta ¼ Ta in t 0
(7)
where Ta in and Yin may change with time, as this is common
in this weather-dependent drying method.
2.2. Numerical solution of the drying equations for the
equilibrium model
The discrete coordinate in the direction of bed depth is z ¼
(i À 1)Dz, being the total bed depth Zmax ¼ (I À 1)Dz. The
discrete value of time is predicted by t ¼ ( j À 1)Dt.
Given the slow nature of near ambient drying, it can be
assumed that air temperature at the layer exit (subscript i þ 1, j )
is in thermal equilibrium with grain temperature in the layer
(subscripts i, j )
Ta iþ1;jyTs i;j (8)
For the calculation of absolute humidity it can be assumed
(Thompson, 1972) that mass transfer through the layer
proceeds up to reaching practical equilibrium conditions.
After this, the air exiting the layer (subscript i þ 1, j ) would be
in hygroscopic equilibrium with the grain moisture content
and temperature in the layer at time t (subscripts i, j ). On
these grounds, the modified ChungePfost equation (Eq. (5))
can be rearranged to compute the relative humidity at posi-
tion i þ 1 using the air temperature value at the same position
and moisture content at time j and position i.
A psychrometric relationship is utilised to link absolute
humidity and partial pressure of vapour in the drying air
Pvap iþ1;j ¼ rhiþ1;jPsat iþ1;j (9)
Yiþ1;j ¼
Pvap iþ1;j
À
P À Pvap iþ1;j
Á
18
29
(10)
After calculation of Eqs. (8)e(10), the index i is increased using
the computationally valid expression i ¼ i þ 1. Automatically,
the exhaust airconditions fromthe previous layerbecome inlet
conditions for the next. Calculation of air variables through the
bed proceeds until it reaches the index I. With these values, the
derivatives of air variables can be approximated by
vY
vz
y
DY
Dz
¼
Yiþ1;j À Yi;j
Dz
(11)
vTa
vz
y
DTa
Dz
¼
Ta iþ1;j À Ta i;j
Dz
(12)
Replacing the derivatives of grain moisture and temperature
with time by finite differences in Eqs. (3) and (4), the discrete
form of the model is found
rs0ð1 À 30Þ
Xi;jþ1 À Xi;j
Dt
¼ ÀGa
Yiþ1;j À Yi;j
Dz
(13)
rs0ð1 À 30ÞCps
Ts i;jþ1 À Ts i;j
Dt
¼ ÀGa Cpa
Ta iþ1;j À Ta i;j
Dz
þ Lw
Yiþ1;j À Yi;j
Dz
!
(14)
By solving Eqs. (13) and (14) for the unknowns Xi, jþ1 and Ts,i,
jþ1, we have
Xi;jþ1 ¼ Xi;j À
Ga
rs0ð1 À 30Þ
Dt
Dz
À
Yiþ1:j À Yi;j
Á
(15)
b i o s y s t e m s e n g i n e e r i n g x x x ( 2 0 1 0 ) 1 e1 0 3
Please cite this article in press as: Martinello, M., Giner, S., Simulation of natural air drying of maize in a typical location of
Argentina: Influence of air heating through the fan, Biosystems Engineering (2010), doi:10.1016/j.biosystemseng.2010.06.010
4. Ts;i;jþ1 ¼Tsi;j À
Ga
rs0ð1À30ÞCps
Dt
Dz
Â
Cpa
À
Taiþ1;j ÀTai;j
Á
þLw
À
Yiþ1;j ÀYi;j
ÁÃ
(16)
The average bed moisture content at each time j þ 1 is calcu-
lated by
Xav
jþ1 ¼
1
I
XI
i¼1
Xijþ1 (17)
After updating the time index j ¼ j þ 1, a new calculation of the
whole bed is started in Eq. (8). Calculation is continued until
the moisture content at position i ¼ I, i.e., the top layer of the
bed is reduced below 14.5% w/w or 0.17 kg [water] kgÀ1
[dry
matter].
The numerical procedure is illustrated in the flowchart in
Fig. 1.
2.3. Calculation of dry matter loss
Dry matter loss (DML, %) was computed for each layer of the
bed (i.e., between z and z þ Dz) as a function of time, according
to the procedure described by Thompson (1972)
Dteq ¼
Dth
MMMTMD
(18)
where the time step Dth (used in the numerical integration,
but expressed here in h) means “a reference storage interval”
(representing conditions at 15.6
C, 0.333 kg [water] kgÀ1
[dry
matter] and 30% damage) and is converted to an equivalent
time interval Dteq by using the moisture, temperature and
damage multipliers MM, MT, and MD, respectively (Steele et al.,
1969; Thompson, 1972) that account for the measured condi-
tions in the bed at the position analysed. The equivalent time,
teq is then calculated by accumulating the values of Dteq, and is
utilised in Eq. (19) to calculate CO2 production by the grain
yeq ¼ 1:3
À
exp
À
0:006teq
Á
À 1
Á
þ 0:015teq (19)
Symbol yeq represents the grams of CO2 produced per kg of dry
matter, and, as 14.7 g is equivalent to 1% loss of dry matter
(Thompson, 1972), the percentage of dry matter loss by
respiration can be computed by
DML ¼
y
14:7
(20)
As all layers have initially the same moisture and therefore,
the same dry matter content, the average value of DML in the
bed is thus the arithmetic mean of the DML values calculated
for all the layers. This index represents a quality parameter of
special interest.
2.4. Calculation of the specific energy consumption
The pressure drop per unit of bed depth (Dpu) was calculated
using the Hukill and Ives equation with parameters for maize
published by Brooker et al. (1992).
The fan power requiredby the dryingsystem was calculated
on the basis of the product of total pressure drop Dp ¼ DpuZmax
and volumetric airflow Qv ¼ QvvSZmax. Symbols Qvv, S and Zmax
stand for specific volumetric airflow in m3
[air] sÀ1
mÀ3
[bed],
where the cross-sectional area of the drying bin is in m2
and the
bed depth is in m. However, a factor of f1 ¼ 1.5 was utilised to
allow for increased resistance to airflow caused by bed packing
and fines, together with another factor f2 ¼ 1.3 that allowed for
pressure losses in the air distribution system. Furthermore, to
compute the electric power supply to the fan, a combined fan
plus motor efficiency of 50% was taken, so that another factor
f3 ¼ 2 must be incorporated. The resulting equation is
Powerfan ¼ f1f2f3DpuZ2
maxQvvS (21)
The energy expenditure during drying was calculated by
multiplying the fan power of Eq. (21) by the drying time. In
turn, the specific energy consumption Sec was calculated by
dividing the energy expenditure by the mass of water evapo-
rated over the process (X0 is the initial moisture content in kg
[water] kgÀ1
[dry matter]). The value of Sec is inversely
proportional to the energy efficiency of drying.
Sec ¼
Powerfantd
X0 À Xav
f
rs0ð1 À 30ÞSZmax
(22)
2.5. Calculation of the air temperature rise through the
fan
In order to calculate the increase in air temperature on
passing through the fan for the near ambient drying mode,
a macroscopic energy balance in steady state (Bird, Steward,
Lightfoot, 2007) was proposed using the fan as open thermo-
dynamical system. The resulting expression indicates that the
change of air enthalpy in J sÀ1
equals the energy received as
mechanical work W from the fan blades and heat from the fan
motor (considering an axial flow fan). This procedure, as
suggested by Lamond (1982), is represented by Eq. (23)
Powerfan ¼ D bHGaS (23)
The increase in inlet temperature is estimated with sufficient
accuracy by calculating the change in enthalpy, J kgÀ1
[air], as
the product of the specific heat and the temperature rise
D bH ¼ CpaDTa (24)
Then, the air temperature rise is calculated combining Eqs.
(21)e(24)
DTa ¼
f1f2f3DpuZ2
maxQvv
GaCpa
(25)
This temperature rise will also determine a decrease in rela-
tive humidity of the air entering the grain bed in the near
ambient drying mode.
The relevant performance parameters utilised to charac-
terise the drying process were specific energy consumption
(Sec) in MJ kgÀ1
[water evaporated] (Eq. (21)) and drying time (td)
in hours, which is obtained by solving Eqs. (7)e(15). Ambient
drying implies the use of natural air without addition of the air
temperature rise through the fan.
2.6. Simulation method applied to find the characteristic
response of the drying system for constant air conditions
As the drying simulation employs weather data, i.e., time-
varying temperature and relative humidity, the effect of the air
b i o s y s t e m s e n g i n e e r i n g x x x ( 2 0 1 0 ) 1 e1 04
Please cite this article in press as: Martinello, M., Giner, S., Simulation of natural air drying of maize in a typical location of
Argentina: Influence of air heating through the fan, Biosystems Engineering (2010), doi:10.1016/j.biosystemseng.2010.06.010
5. Initialise moisture content and temperature in the bed
Initialise time (t=0)
Increase depth coordinate(z=z+Δz)
Calculate air temperature and
humidity at z = z+ Δz by assuming
equilibrium with grain at z
Near ambient
drying?
Moisture in top layer
target value?
NO
YES
Read in physical and
thermal properties of
grain and air
Read weather
data at t
Compute air temperature rise
and relative humidity
decrease through the fan
Initialise coordinate along bed depth (z=0)
Top layer reached?
NO
YES
NO
Increase time,
t = t+Δt
YES
Update moisture content and temperature in the bed
Calculate
specific energy
consumption
End of simulation
Fig. 1 e Simplified flowchart describing the numerical solution of the drying model.
b i o s y s t e m s e n g i n e e r i n g x x x ( 2 0 1 0 ) 1 e1 0 5
Please cite this article in press as: Martinello, M., Giner, S., Simulation of natural air drying of maize in a typical location of
Argentina: Influence of air heating through the fan, Biosystems Engineering (2010), doi:10.1016/j.biosystemseng.2010.06.010
6. heating through the fan, and the influences of design parame-
ters as bed height and initial grain moisture content would be
difficult to assess. For this reason, a series of preliminary
simulationswere conducted for a constant air inlet temperature
of 20
C and relative humidity of 60% (rh ¼ 0.6). The corre-
sponding equilibrium moisture content of maize, calculated by
Eq. (5) was 0.139 kg [water] kgÀ1
[dry matter]. The use of this air,
without modifications, constitutes ambient drying.
Tables 1 and 2 show the after-fan air conditions, i.e., air
conditions at the bed inlet for near ambient drying, along with
the corresponding maize equilibrium moisture content. The air
temperature rise through the fan varies from 0.4
C to 2.8
C,
which determines a percentage relative humidity decrease
between 2 and 7%. The magnitude of the fan effect on air
conditions depends primarily on air mass flow rate and bed
height, because the two variables determine the air pressure
drop through the bed and therefore the fan power. The base
conditions were Qvv ¼ 0.020 m3
sÀ1
mÀ3
and Zmax ¼ 4 m.
2.7. Simulation method encompassing weather data
A historical series of weather data (ambient temperature,
relative humidity and barometric pressure) for the city of
Junı´n (34
310
S, 60
520
W), Province of Buenos Aires,
Argentina, was used in the simulation. The data were
provided by the Servicio Meteorolo´gico Nacional (National
Meteorological Service of Argentina, www.smn.gov.ar).
Hourly data for April (which corresponds to autumn in the
southern hemisphere) was averaged between years 2000
and 2006 and utilised in the simulations. Ambient and
near ambient drying were comparatively simulated using
these data.
3. Results and discussion
3.1. Characteristic response of the drying system at
constant drying conditions for ambient and near ambient
drying
Tables 3 and 4 give the operating conditions and simulation
results allowing comparison of ambient and near ambient
drying. Performance parameters as specific energy
consumption and drying time were studied at constant drying
conditions as affected by bed depth (Table 3) and specific
volumetric airflow (Table 4), at various initial moisture
contents.
With these data, the percentage decrease in drying time
and specific energy consumption of near ambient drying with
respect to ambient drying was calculated. The results are
shown in Figs. 2e5.
The decrease in both drying times and specific energy
consumptions observed for near ambient drying was more
pronounced at higher specific airflows and higher bed depths,
because both variables tend to produce higher pressure drop
and thus a larger temperature rise and a simultaneous
decrease in relative humidity in the drying air through the fan.
The criterion used to stop simulations, i.e., moisture content
of the top layer becoming less than 0.17 kg [water] kgÀ1
[dry
matter] allows a prudent comparison between the two drying
modes because, as near ambient drying finishes the process
for lower average moisture contents in the bed (which is
a consequence of the lower equilibrium moisture content in
the maize), the predicted reductions in drying time and
specific energy consumption (Sec) calculated here are smaller
than if simulations were stopped for the same final average
moisture content. An interesting feature drawn from Fig. 5 is
that savings in Sec were more substantial for lower initial
moisture contents (e.g., 0.18e0.20), which are the typical
values found in maize harvested in Argentina.
As indicated by Eq. (22), the specific energy consumption
is directly proportional to drying time td and inversely
proportional to the difference between the initial and final
average moisture contents. As near ambient drying reduces
the drying time in the numerator, and increases the moisture
content difference; in the denominator, its influence is
greater on Sec than it is on drying time. This is an interesting
characteristic, since the objective of an environmentally
sustainable method is more related to energy savings.
However, higher initial moisture contents hinder the benefit
of near ambient drying over ambient drying since, given the
criterion used to stop simulations, the former method leads
to a much lower average moisture content at the end of the
process, which reduces the commercial value of grains. More
importantly, both in near ambient and ambient drying, high
Table 1 e “After-fan” air conditions and corresponding
maize equilibrium moisture content as a function of the
specific volumetric airflow at a constant bed height of 4 m.
Ambient conditions: Temperature, 20
C; relative
humidity [ 60% (rh [ 0.6), with a maize equilibrium
moisture content of 0.139 kg [water] kgL1
[dry matter]
Qvv, m3
sÀ1
mÀ3
(Zmax ¼ 4 m)
0.010 0.020 0.030
Inlet air temperature,
C 20.40 21.05 21.89
Inlet air relative humidity,
decimal
0.58 0.56 0.53
Maize equilibrium moisture
content, kg [water] kgÀ1
[dry matter]
0.136 0.132 0.126
Table 2 e “After-fan” air conditions and corresponding
maize equilibrium moisture content as a function of bed
depth for a constant specific volumetric airflow of
0.020 m3
sL1
mL3
. Ambient conditions: Temperature,
20
C; relative humidity [ 60% (rh [ 0.6), with a maize
equilibrium moisture content of 0.139 kg [water] kgL1
[dry matter]
Zmax, m (Qvv ¼ 0.020
m3
sÀ1
mÀ3
)
3 4 5
Inlet air temperature,
C 20.52 21.05 21.80
Inlet air relative humidity,
decimal
0.58 0.56 0.54
Maize equilibrium moisture
content, kg [water] kgÀ1
[dry matter]
0.134 0.132 0.127
b i o s y s t e m s e n g i n e e r i n g x x x ( 2 0 1 0 ) 1 e1 06
Please cite this article in press as: Martinello, M., Giner, S., Simulation of natural air drying of maize in a typical location of
Argentina: Influence of air heating through the fan, Biosystems Engineering (2010), doi:10.1016/j.biosystemseng.2010.06.010
7. initial moisture contents lead to excessively long drying
process, which may allow microbial development and grain
spoilage (Fleurant-Lessard, 2002). Consequently, near
ambient drying must be limited to low to moderate initial
moisture contents.
3.2. Simulations of ambient and near ambient drying
conducted with historical series of weather data for Junı´n,
Province of Buenos Aires, Argentina
Fig. 6 shows the variation with time of air temperature for
ambient and near ambient drying at the bed inlet, while
Fig. 7 exhibits the corresponding relative humidity data. The
effect of the air heating by the fan can be observed in both
graphs. Average ambient temperature and relative humidity
over the period exhibited in the figures mentioned above
were 17.4
C and 76.9%, with an equilibrium maize moisture
content of 0.178 kg [water] kgÀ1
[dry matter]. In turn, the
corresponding average for near ambient conditions at the
bed inlet were 19.2
C and 68.4%, with an equilibrium maize
moisture content of 0.156 kg water/kg dry matter. Differ-
ences in inlet air conditions are reflected in drying behav-
iour. Using ambient drying, the criterion for stopping
simulation cannot be met, unlike for near ambient drying.
Fig. 8 shows the evolution of the average bed moisture
content as a function of time for both drying modes under
the air conditions of Figs. 6 and 7. Near ambient drying was
completed in 416.1 h (17 complete days) with a specific
energy consumption of 2.07 MJ kgÀ1
and an average moisture
content in the bed of 0.161 kg [water] kgÀ1
[dry matter].
Table 3 e Influence of bed depth on ambient and near ambient drying times and specific energy consumptions for various
maize initial moisture contents. Constant conditions: Ambient air temperature and relative humidity, 20
C and 60% (rh
[ 0.6); Specific volumetric airflow, Qvv [ 0.020 m3
sL1
mL3
. Symbols X0 and DTa stand for maize initial moisture content
and air temperature rise through the fan, respectively
Bed
depth, m
X0, kg [water]
kgÀ1
[dry matter]
DTa
C Final average moisture content in
the bed, kg [water] kgÀ1
[dry matter]
Drying time, h Specific energy consumption,
MJ kgÀ1
[water evaporated]
Ambient Near
ambient
Ambient Near
ambient
Ambient Near
ambient
3 0.18 0.52 0.143 0.137 298.3 288.8 0.715 0.633
3 0.20 0.52 0.139 0.137 342.2 330.2 0.549 0.499
3 0.22 0.52 0.139 0.136 384.7 370.6 0.471 0.433
3 0.24 0.52 0.139 0.136 428.9 412.4 0.427 0.396
4 0.18 1.05 0.140 0.133 298.3 280.2 1.426 1.134
4 0.20 1.05 0.139 0.133 342.2 319.4 1.097 0.915
4 0.22 1.05 0.139 0.132 384.7 357.6 0.938 0.802
4 0.24 1.05 0.139 0.132 428.9 397.6 0.852 0.737
5 0.18 1.80 0.143 0.129 298.3 268.8 2.460 1.705
5 0.20 1.80 0.139 0.128 342.2 305.3 1.893 1.408
5 0.22 1.80 0.139 0.129 384.7 341.2 1.621 1.251
5 0.24 1.80 0.139 0.128 428.7 378.3 1.469 1.156
Table 4 e Influence of specific volumetric airflow on ambient and near ambient drying times and specific energy
consumptions for various maize initial moisture contents Constant conditions: Ambient air temperature and relative
humidity, 20
C and 60% (rh [ 0.6); Bed depth, Zmax [ 4 m. Symbols X0 and DTa stand for maize initial moisture content and
air temperature rise through the fan, respectively
Specific volumetric
airflow, m3
[air]
sÀ1
mÀ3
[bed]
X0, kg
[water] kgÀ1
[dry matter]
DTa
C Final average moisture content in
the bed, kg [water] kgÀ1
[dry matter]
Drying time, h Specific energy
consumption, MJ kgÀ1
[water evaporated]
Ambient Near
ambient
Ambient Near
ambient
Ambient Near
ambient
0.010 0.18 0.40 0.140 0.137 596.6 581.7 0.552 0.502
0.010 0.20 0.40 0.139 0.137 684.3 665.6 0.425 0.394
0.010 0.22 0.40 0.139 0.137 769.4 742.3 0.364 0.341
0.010 0.24 0.40 0.139 0.137 857.8 832.0 0.330 0.311
0.020 0.18 1.05 0.140 0.133 298.3 280.2 1.426 1.134
0.020 0.20 1.05 0.139 0.133 342.2 319.4 1.097 0.915
0.020 0.22 1.05 0.139 0.132 384.7 357.6 0.938 0.802
0.020 0.24 1.05 0.139 0.132 428.9 397.6 0.852 0.737
0.030 0.18 1.89 0.140 0.128 198.9 178.4 2.575 1.759
0.030 0.20 1.89 0.139 0.127 228.1 202.5 1.981 1.457
0.030 0.22 1.89 0.139 0.127 256.5 226.3 1.697 1.296
0.030 0.24 1.89 0.139 0.127 285.9 250.8 1.539 1.200
b i o s y s t e m s e n g i n e e r i n g x x x ( 2 0 1 0 ) 1 e1 0 7
Please cite this article in press as: Martinello, M., Giner, S., Simulation of natural air drying of maize in a typical location of
Argentina: Influence of air heating through the fan, Biosystems Engineering (2010), doi:10.1016/j.biosystemseng.2010.06.010
8. The average dry matter loss, 0.01%, was much lower than
the accepted upper limit of 0.50%. As mentioned earlier,
ambient drying was unable to reduce moisture content in
the top layer below to 0.17 kg [water] kgÀ1
[dry matter] in
April (1st to 17th) for the Junı´n region. Process completion by
near ambient drying is reached by reducing bed rewetting at
night and allowing faster grain drying during the day.
A comparative simulation carried out with weather data
for February 1st to 16th, allowed both drying methods to
reach the target moisture content: the drying time and
specific energy consumption for ambient drying resulted
387.1 h and 1.77 MJ kgÀ1
, respectively while the corre-
sponding values in near ambient drying mode were 352.2 h
and 1.37 MJ kgÀ1
. This implies a considerable saving of
energy (22.6%), as well as shorter drying time (9.0%). In both
cases, average dry matter loss values were well below the
limit; 0.009% for ambient drying and 0.008% for near
ambient drying.
0
5
10
15
20
25
30
35
0.18 0.2 0.22 0.24
Initial moisture content, kg [water] kg-1
[dry matter], decimal
%,esaerced.snocygrenecificepS
Fig. 5 e Influence of bed depth on the percentage decrease
in specific energy consumption resulting from the
comparison of ambient and near ambient drying, at
various initial moisture contents. The specific volumetric
airflow was kept constant at 0.020 m3
sL1
mL3
. -
Zmax [ 3 m, , Zmax [ 4 m, Zmax [ 5 m.
0 50 100 150 200 250 300 350 400 450
10
12
14
16
18
20
22
24
26
28
Drying time, h
C°,erutarepmettelniriA
Fig. 6 e Air inlet temperature as a function of time during
drying, for 1e17th April in Junı´n, Province of Buenos Aires,
Argentina. Conditions for ambient (solid line) and near
ambient drying (dotted line) are shown.
0
5
10
15
20
25
30
35
0.18 0.2 0.22 0.24
Initial moisture content, kg [water] kg-1
[dry matter], decimal
%,esaerced.snocygrenecificepS
Fig. 4 e Influence of the specific volumetric airflows on the
percentage decrease in specific energy consumption
resulting from the comparison of ambient and near
ambient drying, at various initial moisture contents. Bed
depth was kept constant at 4 m. - Qvv [ 0.010 m3
sL1
mL3
,
, Qvv [ 0.020 m3
sL1
mL3
, Qvv [ 0.030 m3
sL1
mL3
.
0
2
4
6
8
10
12
14
0.18 0.20 0.22 0.24
Initial moisture content, kg [water] kg-1
[dry matter], decimal
%,esaercedemitgniyrD
Fig. 3 e Influence of bed depth on the percentage decrease
in drying time resulting from the comparison of ambient
and near ambient drying, for various initial maize
moisture contents. The specific volumetric airflow was
kept constant at 0.020 m3
sL1
mL3
. - Zmax [ 3 m, ,
Zmax [ 4 m, Zmax [ 5 m.
0
2
4
6
8
10
12
14
0.18 0.20 0.22 0.24
Initial moisture content, kg [water] kg-1
[dry matter], decimal
%,esaercedemitgniyrD
Fig. 2 e Influence of specific volumetric airflow on %
decrease in drying time resulting from the comparison of
ambient and near ambient drying, at various initial maize
moisture contents. Bed depth was kept constant at 4 m. -
Qvv [ 0.010 m3
sL1
mL3
, , Qvv [ 0.020 m3
sL1
mL3
,
Qvv [ 0.03 m3
sL1
mL3
.
b i o s y s t e m s e n g i n e e r i n g x x x ( 2 0 1 0 ) 1 e1 08
Please cite this article in press as: Martinello, M., Giner, S., Simulation of natural air drying of maize in a typical location of
Argentina: Influence of air heating through the fan, Biosystems Engineering (2010), doi:10.1016/j.biosystemseng.2010.06.010
9. 3.3. Comparison with a non-equilibrium model
Another version of the model was programmed using the
thin layer drying equation given by Misra and Brooker (1980).
The heat transfer equilibrium assumption was kept, because
heat transfer is faster than mass transfer. Using the
non-equilibrium version (Ta in ¼ 20
C, rh ¼ 60%, Zmax ¼ 4 m,
Xin ¼ 0.20 dec. d.b.) drying times were calculated to be 5%
longer at lowest specific volumetric airflow, (0.010 m3
sÀ1
mÀ3
)
and 13% longer for the higher value (0.030 m3
sÀ1
mÀ3
). These
differences are not meaningful, so that the equilibrium model
proved to be a fair tool for this comparative study.
4. Conclusions
An equilibrium drying model was developed for simulation of
ambient and near ambient drying of maize. The model has
new features: it utilises a recent version of the Modified
ChungePfost isotherm equation with parameters for flint
maize and employs a direct, non-iterative solution method
based on a finite difference scheme.
Specific energy consumption varied from 0.2 up to
2.6 MJ kgÀ1
, so that in most conditions, it was lower than the
heat of desorption of water from the grain (2.5 MJ kgÀ1
),
because of the inherent drying capacity of natural air.
Savings of the specific energy consumption up to 30% can be
achieved in the near ambient mode compared with ambient
drying, and the reductions in drying time were of about 12%.
Simulations carried out usinghourly weatherdata averaged
over 6 years from April 1st to 17th in Junı´n, Province of Buenos
Aires, Argentina, suggested that near ambient drying could
have completed the drying process, unlike ambient air drying.
The continuous fan operation was the only strategy simu-
lated in order to compare the performance of ambient and near
ambient drying. A more thorough assessment of predictions by
the drying equilibrium and non-equilibrium models in near
ambient conditionswillbecarriedout,alongwithavalidationof
themodels using experimentaldata for the dryingofflintmaize.
r e f e r e n c e s
Bartosik, R. E., Maier, D. E. (2004). Evaluation of three NA/LT in-
bin drying strategies in four corn belt locations. Transactions of
the ASAE, 47(84), 1195e1206.
Bird, R. V., Steward, W. E., Lightfoot, E. N. (2007). Transport
phenomena (2nd ed). New York: John Wiley Sons, Inc.
Brooker, D. B., Bakker-Arkema, F. W., Hall, C. W. (1992). Drying
and storage of grains and oilseeds. New York: Van Nostrand
Reinhold.
Constantinides, A., Mostoufi, N. (1999). Numerical methods for
chemical engineers with Matlab applications. New Jersey:
Prentice-Hall, Inc.
Davidson, V. J., Noble, S. D., Brown, R. B. (2000). Effects of drying
air temperature and humidity on stress cracks and breakage
of maize kernels. Journal of Agricultural Engineering Research, 77
(3), 303e308.
Fleurant-Lessard, F. (2002). Qualitative reasoning and integrated
management of the quality of stored grain in a promising new
approach. Journal of the Stored Products Research, 38, 191e218.
Giner, S. A., Mascheroni, R. H., Nellist, M. E. (1996). Cross-flow
drying of wheat. a simulation program with a diffusion-based
deep-bed model and a kinetic expression for viability loss
estimations. Drying Technology, 14(78), 1625e1672.
Gunasekaran, S., Deshpande, S. S., Paulsen, M. R., Shove, G. C.
(1985). Size characterization of stress cracks in corn kernels.
Transaction of the ASAE, 28(5), 1668e1672.
Lamond, W. J. (1982). Thermodynamics of air in deep bed drying
at near ambient temperature. Agricultural Engineering, 37,
91e93.
Misra, M. K., Brooker, D. B. (1980). Thin layer drying and
rewetting equations for shelled yellow corn. Transactions of the
ASAE, 23, 1254e1260.
Morey, R. V., Cloud, H. A., Gustafson, R. J., Petersen, D. W. (1979).
Management of ambient air drying systems. Transactions of the
ASAE, 22(6), 1418e1425.
0 50 100 150 200 250 300 350 400 450
0.16
0.165
0.17
0.175
0.18
0.185
0.19
0.195
0.2
0.205
Drying time, h
gk]retaw[gk,tnetnocerutsiomegarevA]rettamyrd[
Fig. 8 e Average moisture content in the bed as a function
of time during ambient (solid line) and near ambient drying
(dotted line) for air conditions of Figs. 6 and 7 and a bed
depth of 4 m.
0 50 100 150 200 250 300 350 400 450
0.4
0.5
0.6
0.7
0.8
0.9
1
Drying time, h
llamiced,ytidimuhevitalertelniriA
Fig. 7 e Inlet air relative humidity as a function of time
during drying, for 1e17th April in Junı´n, Province of
Buenos Aires, Argentina. Conditions for ambient (solid
line) and near ambient drying (dotted line) are shown.
b i o s y s t e m s e n g i n e e r i n g x x x ( 2 0 1 0 ) 1 e1 0 9
Please cite this article in press as: Martinello, M., Giner, S., Simulation of natural air drying of maize in a typical location of
Argentina: Influence of air heating through the fan, Biosystems Engineering (2010), doi:10.1016/j.biosystemseng.2010.06.010
10. Robutti, J. L., Borra´s, F. S., Eyherabide, G. H. (1997). Zein
composition of mechanically separated coarse and fine
portions of maize kernels. Cereal Chemistry, 74(1), 75e78.
Robutti, J. L., Borra´s, F. S., Ferrer, M. E., Bietz, J. A. (2000). Grouping
and identification of Argentine maize races by chemometric
analysis of zein RP-HPLC data. Cereal Chemistry, 77(2), 91e95.
Robutti, J. L., Borra´s, F. S., Ferrer, M. E., Percibaldi, M.,
Knutson, C. A. (2000). Evaluation of quality factors in
Argentine maize races. Cereal Chemistry, 77(1), 24e26.
Schoenau, G. J., Arinze, E. A., Sokhansanj, S. (1995). Simulation
and optimization of energy systems for in bin drying of canola
grain. Energy Conversion and Management, 36(1), 41e59.
Smith, E. A., Bailey, P. H. (1983). Simulation of near-ambient
grain drying. control strategies for drying barley in Northern
Britain. Journal of Agricultural Engineering Research, 28, 301e317.
Steele, J. L., Saul, R. A., Hukill, W. V. (1969). Deterioration of
shelled corn as measured by carbon dioxide production.
Transactions of the ASAE, 12(5), 685e689.
Sun, D. (1998). Selection of EMC/ERH isotherm equations for
shelled corn based on fitting available data. Drying Technology,
16(3e5), 779e797.
Sun, Y., Pantelides, C. C., Chalabi, Z. S. (1995). Mathematical
modelling and simulation of near-ambient grain drying.
Computers and Electronics in Agriculture, 13, 243e271.
Thompson, T. L. (1972). Temporary storage of high moisture
shelled corn using continuous aeration. Transactions of the
American Society Agricultural Engineers, 15(2), 333e337.
Watson, S. A. (1988). Corn marketing, processing and utilization.
In G. F. Sprague, J. W. Dudley (Eds.), Corn and corn
improvement. Madison, USA: ASA-CSSA-SSSA.
b i o s y s t e m s e n g i n e e r i n g x x x ( 2 0 1 0 ) 1 e1 010
Please cite this article in press as: Martinello, M., Giner, S., Simulation of natural air drying of maize in a typical location of
Argentina: Influence of air heating through the fan, Biosystems Engineering (2010), doi:10.1016/j.biosystemseng.2010.06.010
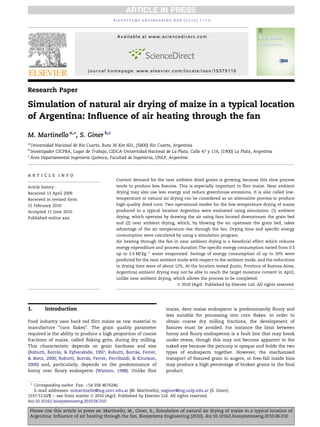
![Grain postharvest handling often results in a decrease in
grain quality, in particular in fissuring. Gunasekaran,
Deshpande, Paulsen, and Shove (1985) when studying stress
cracks in four different varieties of maize kernels dried at high
temperatures, found fissures between 35 and 90 mm long with
depths varying between 1.5 and 2 mm (i.e., almost half the
grain thickness). Also, Davidson, Noble, and Brown (2000)
observed an increase in stress cracking and breakage
susceptibility with drying temperature.
Current demand for near ambient of dried flint grains is
growing, because this slow process tend to produce less
fissured, or checked kernels, whilst also reducing energy use
and greenhouse emissions. Near ambient drying, also called
low-temperature/natural air drying produces less fissures in
flint maize and is therefore a suitable alternative for the
production of high-quality grain (Bartosik & Maier, 2004).
Near ambient drying is a process where the air is heated by
up to 5
C over ambient temperature. Specific airflows used in
this type of drying, vary from 1.0 to 2.2 m3
minÀ1
tonneÀ1
which, considering a maize bulk density of 0.75 tonne mÀ3
is
equivalent to 0.013e0.028 m3
[air] sÀ1
mÀ3
[bed]. This allows
for gentle drying that takes several days and even weeks to
complete. Though the specific production rate is low, the
process is inherently energy-efficient and, provided the
moistureetemperatureetime control program is well
managed, will produce high-quality grain. Near ambient
drying can be applied both to small and large production
scales, but its limitations are set by weather conditions, har-
vesting speed and the possible development of mould during
drying (Bartosik Maier, 2004).
It was observed (Lamond, 1982) that the energy received
by ambient air on passing through the fan produces as
a temperature increase (DT ) in the air entering the grain
bed. As a general rule, fans produce an air temperature rise
of about 1e2
C which also decreases the relative humidity
of the air.
Smith and Bailey (1983) have considered this DT when
studying several strategies for drying barley as did Sun,
Pantelides, and Chalabi (1995), who developed a mathe-
matical model and carried out dynamic simulations of
low-temperature drying, comparing the predictions with
experimental data measured on barley. Schoenau, Arinze, and
Sokhansanj (1995) optimised various methods for drying
rapeseed and, when considering near ambient drying,
included the air temperature increase through the fan. Morey,
Cloud, Gustafson, and Petersen (1979) evaluated the drying
performance for several locations in the USA, using weather
conditions and employing different management strategies at
two different airflow rates. They assumed that the drying fan
supplied a total temperature rise of 1.1
C for all conditions.
No assessment has been found on the effect of the air
temperature rise through the fan on the environmentally
important parameter: the specific energy consumption, or on
drying time. To this end a historical series of weather data
(2000e2006) for the city of Junı´n, Province of Buenos Aires,
a typical maize growing area in Argentina, was utilised using
an equilibrium drying model inspired by the work of
Thompson (1972), but modified with a novel version of the
modified ChungePfost equilibrium isotherm equation devel-
oped by Sun (1998), and solved throughout the bed. An explicit
finite difference scheme (Constantinides Mostoufi, 1999)
which did not require iterative calculations in each layer of
the bed was used. The objective of this work was to evaluate
two operation modes of low-temperature drying: (1) ambient
drying, which operates by drawing the air by fans located
downstream the grain bed and (2) near ambient drying, where
air is blown upstream the grain bed, to take advantage of the
air temperature rise through the fan.
Drying calculations were carried out at three specific
volumetric airflows: 0.010, 0.020 and 0.030 m3
[air] mÀ3
[bed]
sÀ1
, accompanied by the prediction of a quality parameter
such as % dry matter loss (DML) by respiration, being the
Nomenclature
Cps maize specific heat, kJ kgÀ1
dry solids
C
Cpa air specific heat, kJ kgÀ1
dry air
C
Dpu pressure drop of air per unit of bed height, Pa mÀ1
Dp total pressure drop in the bed, Pa
Ga air mass flow rate, kg [dry air] sÀ1
mÀ2
Y air absolute humidity, kg [water vapour] kgÀ1
[dry
air]
rh air relative humidity, decimal
Zmax bed depth, m
z coordinate along bed height, m
Psat saturation vapour pressure of water, Pa
Pvap partial pressure of vapour in the drying air, Pa
P absolute pressure of drying air, Pa
Powerfan fan power, W
Qvv specific volumetric airflow, m3
[air] sÀ1
mÀ3
[bed]
Qv volumetric airflow, m3
sÀ1
S cross-sectional area of the bed, m2
Ta air temperature,
C
Ts grain temperature (average value in the grain),
C
t time, s
X grain moisture content (average value in the
grain), kg [water] kgÀ1
[dry matter]
Lw latent heat of desorption of water from maize,
kJ kgÀ1
rs ratio of grain dry matter to grain volume, kg [dry
matter] mÀ3
3 bed void fraction
Superscripts and subscripts
av average
0 initial
in inlet
f final
e equilibrium
i index denoting discrete values of the coordinate
along bed height
j index denoting discrete values of time
b i o s y s t e m s e n g i n e e r i n g x x x ( 2 0 1 0 ) 1 e1 02
Please cite this article in press as: Martinello, M., Giner, S., Simulation of natural air drying of maize in a typical location of
Argentina: Influence of air heating through the fan, Biosystems Engineering (2010), doi:10.1016/j.biosystemseng.2010.06.010](data:image/gif;base64,R0lGODlhAQABAIAAAAAAAP///yH5BAEAAAAALAAAAAABAAEAAAIBRAA7)