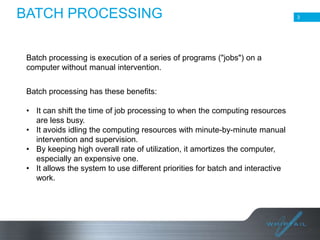
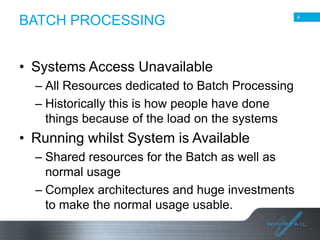
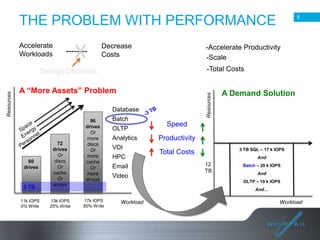
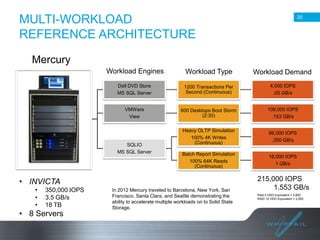
2

STORAGE and
PERFORMANCE

Batch Processing
Darren Williams
Technical Director, EMEA & APAC
BATCH PROCESSING
Batch processing is execution of a series of programs ("jobs") on a
computer without manual intervention.
Batch processing has these benefits:

• It can shift the time of job processing to when the computing resources
are less busy.
• It avoids idling the computing resources with minute-by-minute manual
intervention and supervision.
• By keeping high overall rate of utilization, it amortizes the computer,
especially an expensive one.
• It allows the system to use different priorities for batch and interactive
work.

3
BATCH PROCESSING
• Systems Access Unavailable
– All Resources dedicated to Batch Processing
– Historically this is how people have done
things because of the load on the systems

• Running whilst System is Available
– Shared resources for the Batch as well as
normal usage
– Complex architectures and huge investments
to make the normal usage usable.

4
THE PROBLEM WITH PERFORMANCE
Accelerate
Workloads

--------

Decrease
Costs

-Accelerate Productivity
-Scale
-Total Costs

A “More Assets” Problem

Resources

Resources

Storage Decisions

Database

60
drives

3 TB
11k IOPS
0% Write

72
drives
Or
discs
Or
cache
Or
arrays
13k IOPS
25% Write

96
drives
Or
more
discs
Or
more
cache
Or
more
arrays

5

Batch
OLTP
Analytics
VDI
HPC
Email

Video

A Demand Solution

Speed
Productivity
3 TB SQL – 17 k IOPS

Total Costs

And

12
TB

Batch – 20 k IOPS
And
OLTP – 10 k IOPS
And…

17k IOPS
80% Write

Workload

Workload
SINCE 1956, HDDS HAVE DEFINED
APPLICATION PERFORMANCE

Speed

Design

6

• 10s of MB/s Data
Transfer Rates
• 100s of Write / Read
operation per second
• .001s Latency (ms)
• Motors
• Spindles
• High Energy
Consumption
FLASH ENABLES APPLICATIONS TO
WRITE FASTER

Speed
Design

7

• 100s of MB/s data
transfer rates
• 1000s of Write or Read
operations per second
• .000001 Latency (µs)

• Silicon
• MLC/SLC NAND
• Low energy
consumption
USE OF FLASH – HOST SIDE – PCIE /
FLASH DRIVE DAS
• PCIe
–
–
–
–

Very fast and low latency
Expensive per GB
No redundancy
CPU/Memory stolen from host

• Flash SATA/SAS
– More cost effective
– Cant get more than 2 drives per blade
– Unmanaged can have perf / endurance issues

8

8
USE OF FLASH – ARRAY BASED
CACHE / TIERING

9

• Array flash cache
– Typically read only
– PVS already caches most reads
– Effectiveness limited by storage array designed for hard disks

• Automated storage tiering
– “Promotes” hot blocks into flash tier
– Only effective for READ
– Cache misses still result in “media” reads

9
USE OF FLASH – FLASH IN THE
TRADITIONAL ARRAY

10

• Flash in a traditional array
–
–
–
–
–

Typically uses SLC or eMLC media
High cost per GB
Array is not designed for flash media
Unmanaged will result in poor random write performance
Unmanaged will result in poor endurance

10
USE OF FLASH – FLASH IN THE ALL
FLASH ARRAY
•
•
•
•
•
•

Optimized to sustain High Write and Read throughput
High bandwidth and IOPS. Low latency.
Multi-protocol
LUN Tunable performance
Software designed to enhance lower cost NAND MLC
Flash by optimizing High Write throughput while
substantially reducing wear
• RAID protection and replication

11
12

RACERUNNER OS
NAND FLASH FUNDAMENTALS:

13

HDD WRITE PROCESS REVIEW

Rewritten data block
4K data blocks

A physical HDD is a bit-addressable medium!
Virtually limitless write and rewrite
capabilities.
STANDARD NAND FLASH ARRAY
WRITE I/O
Fabric

ISCSI

FC

SRP

1. Write request from host
passes over fabric through
HBAs.

2. Write request passes
through the transport stack
to RAID.

Unified Transport
RAID
HBA

NAND
Flash x 8

HBA

NAND
Flash x8

HBA

NAND
Flash x8

3. Request is written to
media.

14
NAND FLASH FUNDAMENTALS:
FLASH WRITE PROCESS

15

2MB NAND Page

1. NAND Page contents are
read to a buffer.
2. NAND Page is erased
(aka, “flashed”).
3. Buffer is written back
with previous data and any
changed or new blocks –
including zeroes.
UNDERSTANDING
ENDURANCE/RANDOM WRITE
PERFORMANCE

16

 Endurance





Each cell has physical limits (dielectric breakdown) 2K-5K PE’s
Time to erase a block is non-deterministic (2-6 ms)
Program time is fairly static based on geometry
Failure to control write amplification *will* cause wear out in a
short amount of time
 Desktop workload is one of the worst for write amplification
 Most writes are 4-8KB

• Random Write Performance
– Write amplification not only causes wear out issues, it also
creates unnecessary delays in small random write workloads.
– What is the point of higher cost flash storage with latency
between 2-5ms?

16
RACERUNNER OS:

17

DESIGN AND OPERATION

Fabric

iSCSI

FC

SRP

Unified Transport
RaceRunner
BlockTranslation Layer:
Alignment | Linearization

Enhanced RAID

NAND SSD
x8

HBA
NAND SSD
x8

2. Write request passes
through the transport stack to
BTL.
3. Incoming blocks are
aligned to native NAND page
size.

Data integrity Layer

HBA

1. Write request from host
passes over fabric through
HBAs.

HBA
NAND SSD
x8

4. Request is written to
media.
THE DATA WAITING DAYS ARE OVER

ACCELA
1.5TB – 12TB
250,000 IOPS
1.9 GB/s Bandwidth

Scalability Path

INVICTA
2-6 Nodes
6TB-72TB
650,000 IOPS
7GB/s Bandwidth

INVICTA – INFINITY (Q1/13)
7-30 Nodes
21TB-360TB
800,000 – 4 Million IOPS
40GB/s Bandwidth

18
THE DATA WAITING DAYS ARE OVER

19

ACCELA

INVICTA

INVICTA INFINITY

Height

2U

6U-14U

16U-64U

Capacity

1.5TB-12TB

6TB-72TB

21TB-360TB

IOPS

Up to 250K

250K – 650K

800K – 4M

Bandwidth

Up to 1.9GB/Sec

Up to 7GB/Sec

Up to 40GB/Sec

Latency

120µs

220µs

250µs

Interfaces

2/4/8 Gbit/Sec FC
1/10 GBE
Infiniband

Protocols

FC, ISCSI, NFS, QDR

Features

RAID Protection & Hot Sparing
Async Replication
VAAI
Write Protection Buffer

Options

vCenter Plugin/INVICTA Node
Kit

RAID Protection and Hot Sparing
LUN Mirroring and LUN Striping
Async Replication
VAAI
Write Protection Buffer
vCenter
Plugin/INFINITY Switch
Kit

vCenter Plugin
MULTI-WORKLOAD
REFERENCE ARCHITECTURE

20

Mercury
Workload Engines

Workload Type

Workload Demand

Dell DVD Store
MS SQL Server

1200 Transactions Per
Second (Continuous)

4,000 IOPS
.05 GB/s

VMWare
View

600 Desktops Boot Storm
(2:30)

109,000 IOPS
.153 GB/s

Heavy OLTP Simulation
100% 4K Writes
(Continuous)

86,000 IOPS
.350 GB/s

Batch Report Simulation
100% 64K Reads
(Continuous)

16,000 IOPS
1 GB/s

SQLIO
MS SQL Server

• INVICTA
•
•
•

350,000 IOPS
3.5 GB/s
18 TB

• 8 Servers

In 2012 Mercury traveled to Barcelona, New York, San
Francisco, Santa Clara, and Seattle demonstrating the
ability to accelerate multiple workloads on to Solid State
Storage.

215,000 IOPS
1.553 GB/s
Raid 5 HDD Equivalent = 3,800
RAID 10 HDD Equivalent = 2,000
FASTER GPS FLEET TRACKING

21

Tracks trucks 97% faster
Had to turn off Email systems to allow
extra resources to be allocated to
Batch Run which was taking longer
and longer and created massive
queue of messages
Replaced Hard Disk Drives with four
WHIPTAIL 3TB units and reclaimed
substantial datacenter space

Needed to improve workload
performance of write intensive
Oracle database supporting realtime truck fleet management
system

WHIPTAIL’s 1.9 GB/s WRITE
throughput and 250,000 WRITE IOPS
deliver dramatic performance
improvement in truck management
and monitoring
Workloads are now the fastest in the
enterprise. Query response times
decreased from 2:30 seconds to :05
seconds
WHAT WHIPTAIL CAN OFFER:

22

Throughput …..

1.9GB/s – 40GB/s
120µs

Power …………….

90% less

Floor Space …….

90% less

Cooling …………..

90% less

Endurance …….

7.5yrs Guaranteed

Making Decision faster ….

• Cost

250K – 4m

Latency ………….

• Performance

IOPS ………………

POA

Highly experienced - 250+ customers since 2009 for VDI, Database , Analytics etc…
Best in class performance at most competitive price
Q&A

23

Email: darren.williams@whiptail.com
24

THANKYOU
Darren Williams
Email Darren.williams@whiptail.com
Twitter @whiptaildarren

Storage and performance- Batch processing, Whiptail

  • 2.
    2 STORAGE and PERFORMANCE Batch Processing DarrenWilliams Technical Director, EMEA & APAC
  • 3.
    BATCH PROCESSING Batch processingis execution of a series of programs ("jobs") on a computer without manual intervention. Batch processing has these benefits: • It can shift the time of job processing to when the computing resources are less busy. • It avoids idling the computing resources with minute-by-minute manual intervention and supervision. • By keeping high overall rate of utilization, it amortizes the computer, especially an expensive one. • It allows the system to use different priorities for batch and interactive work. 3
  • 4.
    BATCH PROCESSING • SystemsAccess Unavailable – All Resources dedicated to Batch Processing – Historically this is how people have done things because of the load on the systems • Running whilst System is Available – Shared resources for the Batch as well as normal usage – Complex architectures and huge investments to make the normal usage usable. 4
  • 5.
    THE PROBLEM WITHPERFORMANCE Accelerate Workloads -------- Decrease Costs -Accelerate Productivity -Scale -Total Costs A “More Assets” Problem Resources Resources Storage Decisions Database 60 drives 3 TB 11k IOPS 0% Write 72 drives Or discs Or cache Or arrays 13k IOPS 25% Write 96 drives Or more discs Or more cache Or more arrays 5 Batch OLTP Analytics VDI HPC Email Video A Demand Solution Speed Productivity 3 TB SQL – 17 k IOPS Total Costs And 12 TB Batch – 20 k IOPS And OLTP – 10 k IOPS And… 17k IOPS 80% Write Workload Workload
  • 6.
    SINCE 1956, HDDSHAVE DEFINED APPLICATION PERFORMANCE Speed Design 6 • 10s of MB/s Data Transfer Rates • 100s of Write / Read operation per second • .001s Latency (ms) • Motors • Spindles • High Energy Consumption
  • 7.
    FLASH ENABLES APPLICATIONSTO WRITE FASTER Speed Design 7 • 100s of MB/s data transfer rates • 1000s of Write or Read operations per second • .000001 Latency (µs) • Silicon • MLC/SLC NAND • Low energy consumption
  • 8.
    USE OF FLASH– HOST SIDE – PCIE / FLASH DRIVE DAS • PCIe – – – – Very fast and low latency Expensive per GB No redundancy CPU/Memory stolen from host • Flash SATA/SAS – More cost effective – Cant get more than 2 drives per blade – Unmanaged can have perf / endurance issues 8 8
  • 9.
    USE OF FLASH– ARRAY BASED CACHE / TIERING 9 • Array flash cache – Typically read only – PVS already caches most reads – Effectiveness limited by storage array designed for hard disks • Automated storage tiering – “Promotes” hot blocks into flash tier – Only effective for READ – Cache misses still result in “media” reads 9
  • 10.
    USE OF FLASH– FLASH IN THE TRADITIONAL ARRAY 10 • Flash in a traditional array – – – – – Typically uses SLC or eMLC media High cost per GB Array is not designed for flash media Unmanaged will result in poor random write performance Unmanaged will result in poor endurance 10
  • 11.
    USE OF FLASH– FLASH IN THE ALL FLASH ARRAY • • • • • • Optimized to sustain High Write and Read throughput High bandwidth and IOPS. Low latency. Multi-protocol LUN Tunable performance Software designed to enhance lower cost NAND MLC Flash by optimizing High Write throughput while substantially reducing wear • RAID protection and replication 11
  • 12.
  • 13.
    NAND FLASH FUNDAMENTALS: 13 HDDWRITE PROCESS REVIEW Rewritten data block 4K data blocks A physical HDD is a bit-addressable medium! Virtually limitless write and rewrite capabilities.
  • 14.
    STANDARD NAND FLASHARRAY WRITE I/O Fabric ISCSI FC SRP 1. Write request from host passes over fabric through HBAs. 2. Write request passes through the transport stack to RAID. Unified Transport RAID HBA NAND Flash x 8 HBA NAND Flash x8 HBA NAND Flash x8 3. Request is written to media. 14
  • 15.
    NAND FLASH FUNDAMENTALS: FLASHWRITE PROCESS 15 2MB NAND Page 1. NAND Page contents are read to a buffer. 2. NAND Page is erased (aka, “flashed”). 3. Buffer is written back with previous data and any changed or new blocks – including zeroes.
  • 16.
    UNDERSTANDING ENDURANCE/RANDOM WRITE PERFORMANCE 16  Endurance     Eachcell has physical limits (dielectric breakdown) 2K-5K PE’s Time to erase a block is non-deterministic (2-6 ms) Program time is fairly static based on geometry Failure to control write amplification *will* cause wear out in a short amount of time  Desktop workload is one of the worst for write amplification  Most writes are 4-8KB • Random Write Performance – Write amplification not only causes wear out issues, it also creates unnecessary delays in small random write workloads. – What is the point of higher cost flash storage with latency between 2-5ms? 16
  • 17.
    RACERUNNER OS: 17 DESIGN ANDOPERATION Fabric iSCSI FC SRP Unified Transport RaceRunner BlockTranslation Layer: Alignment | Linearization Enhanced RAID NAND SSD x8 HBA NAND SSD x8 2. Write request passes through the transport stack to BTL. 3. Incoming blocks are aligned to native NAND page size. Data integrity Layer HBA 1. Write request from host passes over fabric through HBAs. HBA NAND SSD x8 4. Request is written to media.
  • 18.
    THE DATA WAITINGDAYS ARE OVER ACCELA 1.5TB – 12TB 250,000 IOPS 1.9 GB/s Bandwidth Scalability Path INVICTA 2-6 Nodes 6TB-72TB 650,000 IOPS 7GB/s Bandwidth INVICTA – INFINITY (Q1/13) 7-30 Nodes 21TB-360TB 800,000 – 4 Million IOPS 40GB/s Bandwidth 18
  • 19.
    THE DATA WAITINGDAYS ARE OVER 19 ACCELA INVICTA INVICTA INFINITY Height 2U 6U-14U 16U-64U Capacity 1.5TB-12TB 6TB-72TB 21TB-360TB IOPS Up to 250K 250K – 650K 800K – 4M Bandwidth Up to 1.9GB/Sec Up to 7GB/Sec Up to 40GB/Sec Latency 120µs 220µs 250µs Interfaces 2/4/8 Gbit/Sec FC 1/10 GBE Infiniband Protocols FC, ISCSI, NFS, QDR Features RAID Protection & Hot Sparing Async Replication VAAI Write Protection Buffer Options vCenter Plugin/INVICTA Node Kit RAID Protection and Hot Sparing LUN Mirroring and LUN Striping Async Replication VAAI Write Protection Buffer vCenter Plugin/INFINITY Switch Kit vCenter Plugin
  • 20.
    MULTI-WORKLOAD REFERENCE ARCHITECTURE 20 Mercury Workload Engines WorkloadType Workload Demand Dell DVD Store MS SQL Server 1200 Transactions Per Second (Continuous) 4,000 IOPS .05 GB/s VMWare View 600 Desktops Boot Storm (2:30) 109,000 IOPS .153 GB/s Heavy OLTP Simulation 100% 4K Writes (Continuous) 86,000 IOPS .350 GB/s Batch Report Simulation 100% 64K Reads (Continuous) 16,000 IOPS 1 GB/s SQLIO MS SQL Server • INVICTA • • • 350,000 IOPS 3.5 GB/s 18 TB • 8 Servers In 2012 Mercury traveled to Barcelona, New York, San Francisco, Santa Clara, and Seattle demonstrating the ability to accelerate multiple workloads on to Solid State Storage. 215,000 IOPS 1.553 GB/s Raid 5 HDD Equivalent = 3,800 RAID 10 HDD Equivalent = 2,000
  • 21.
    FASTER GPS FLEETTRACKING 21 Tracks trucks 97% faster Had to turn off Email systems to allow extra resources to be allocated to Batch Run which was taking longer and longer and created massive queue of messages Replaced Hard Disk Drives with four WHIPTAIL 3TB units and reclaimed substantial datacenter space Needed to improve workload performance of write intensive Oracle database supporting realtime truck fleet management system WHIPTAIL’s 1.9 GB/s WRITE throughput and 250,000 WRITE IOPS deliver dramatic performance improvement in truck management and monitoring Workloads are now the fastest in the enterprise. Query response times decreased from 2:30 seconds to :05 seconds
  • 22.
    WHAT WHIPTAIL CANOFFER: 22 Throughput ….. 1.9GB/s – 40GB/s 120µs Power ……………. 90% less Floor Space ……. 90% less Cooling ………….. 90% less Endurance ……. 7.5yrs Guaranteed Making Decision faster …. • Cost 250K – 4m Latency …………. • Performance IOPS ……………… POA Highly experienced - 250+ customers since 2009 for VDI, Database , Analytics etc… Best in class performance at most competitive price
  • 23.
  • 24.

Editor's Notes

  • #7 Disk drives were designed around capacity not speed. As a result write performance is poor. This poor performance has had a profound impact on how IT operates as a whole.
  • #8 1.       A NAND page is the minimal addressable write element a NAND page t 25nm geometry is between 4 and 8KB2.       An ERASE-BLOCK is a grouping of NAND pages that can range anywhere from 128KB on a single die to 2MB when multiple die are striped3.       You can write a NAND page individually, but you cannot RE-WRITE a page without bringing the entire block into a buffer modifying its contents, erasing the block and then re-writing the block
  • #9 This leads a lot of people down the road of deploying small footprint servers or blades. Physical constraints of these platforms don’t allow for the room to get enough hard disks in a host to deploy enough spindles to handle the load.
  • #10 Vendors who deploy Flash caching are aware of this and often deploy Flash as a READ only cache layer bypassing these challenges, but introduce two new ones: COST, and the dreaded cache miss.
  • #11 But, unfortunately, once you start putting Flash drives in a standard array, you end up staring right back in to the eyes of the dragons we mentioned before. Endurance, random write performance, and cost all rear their heads very quickly.
  • #16 1.       A NAND page is the minimal addressable write element a NAND page t 25nm geometry is between 4 and 8KB2.       An ERASE-BLOCK is a grouping of NAND pages that can range anywhere from 128KB on a single die to 2MB when multiple die are striped3.       You can write a NAND page individually, but you cannot RE-WRITE a page without bringing the entire block into a buffer modifying its contents, erasing the block and then re-writing the block
  • #17 First and foremost it has a physical endurance limit. You can only write to it X number of times, before error rates to unacceptable levels current MLS technology has a PE rating of 5,000. without managing the write cycle, it is very easy to exceed this limit due to what is called “write amplification.”
  • #21 In2012 Mercury traveled Barcelona, New York, San Francisco, Santa Clara, And Seattle demonstrating the advantages of consolidating workloads on to Solid State Storage.