Downloaded 2,505 times


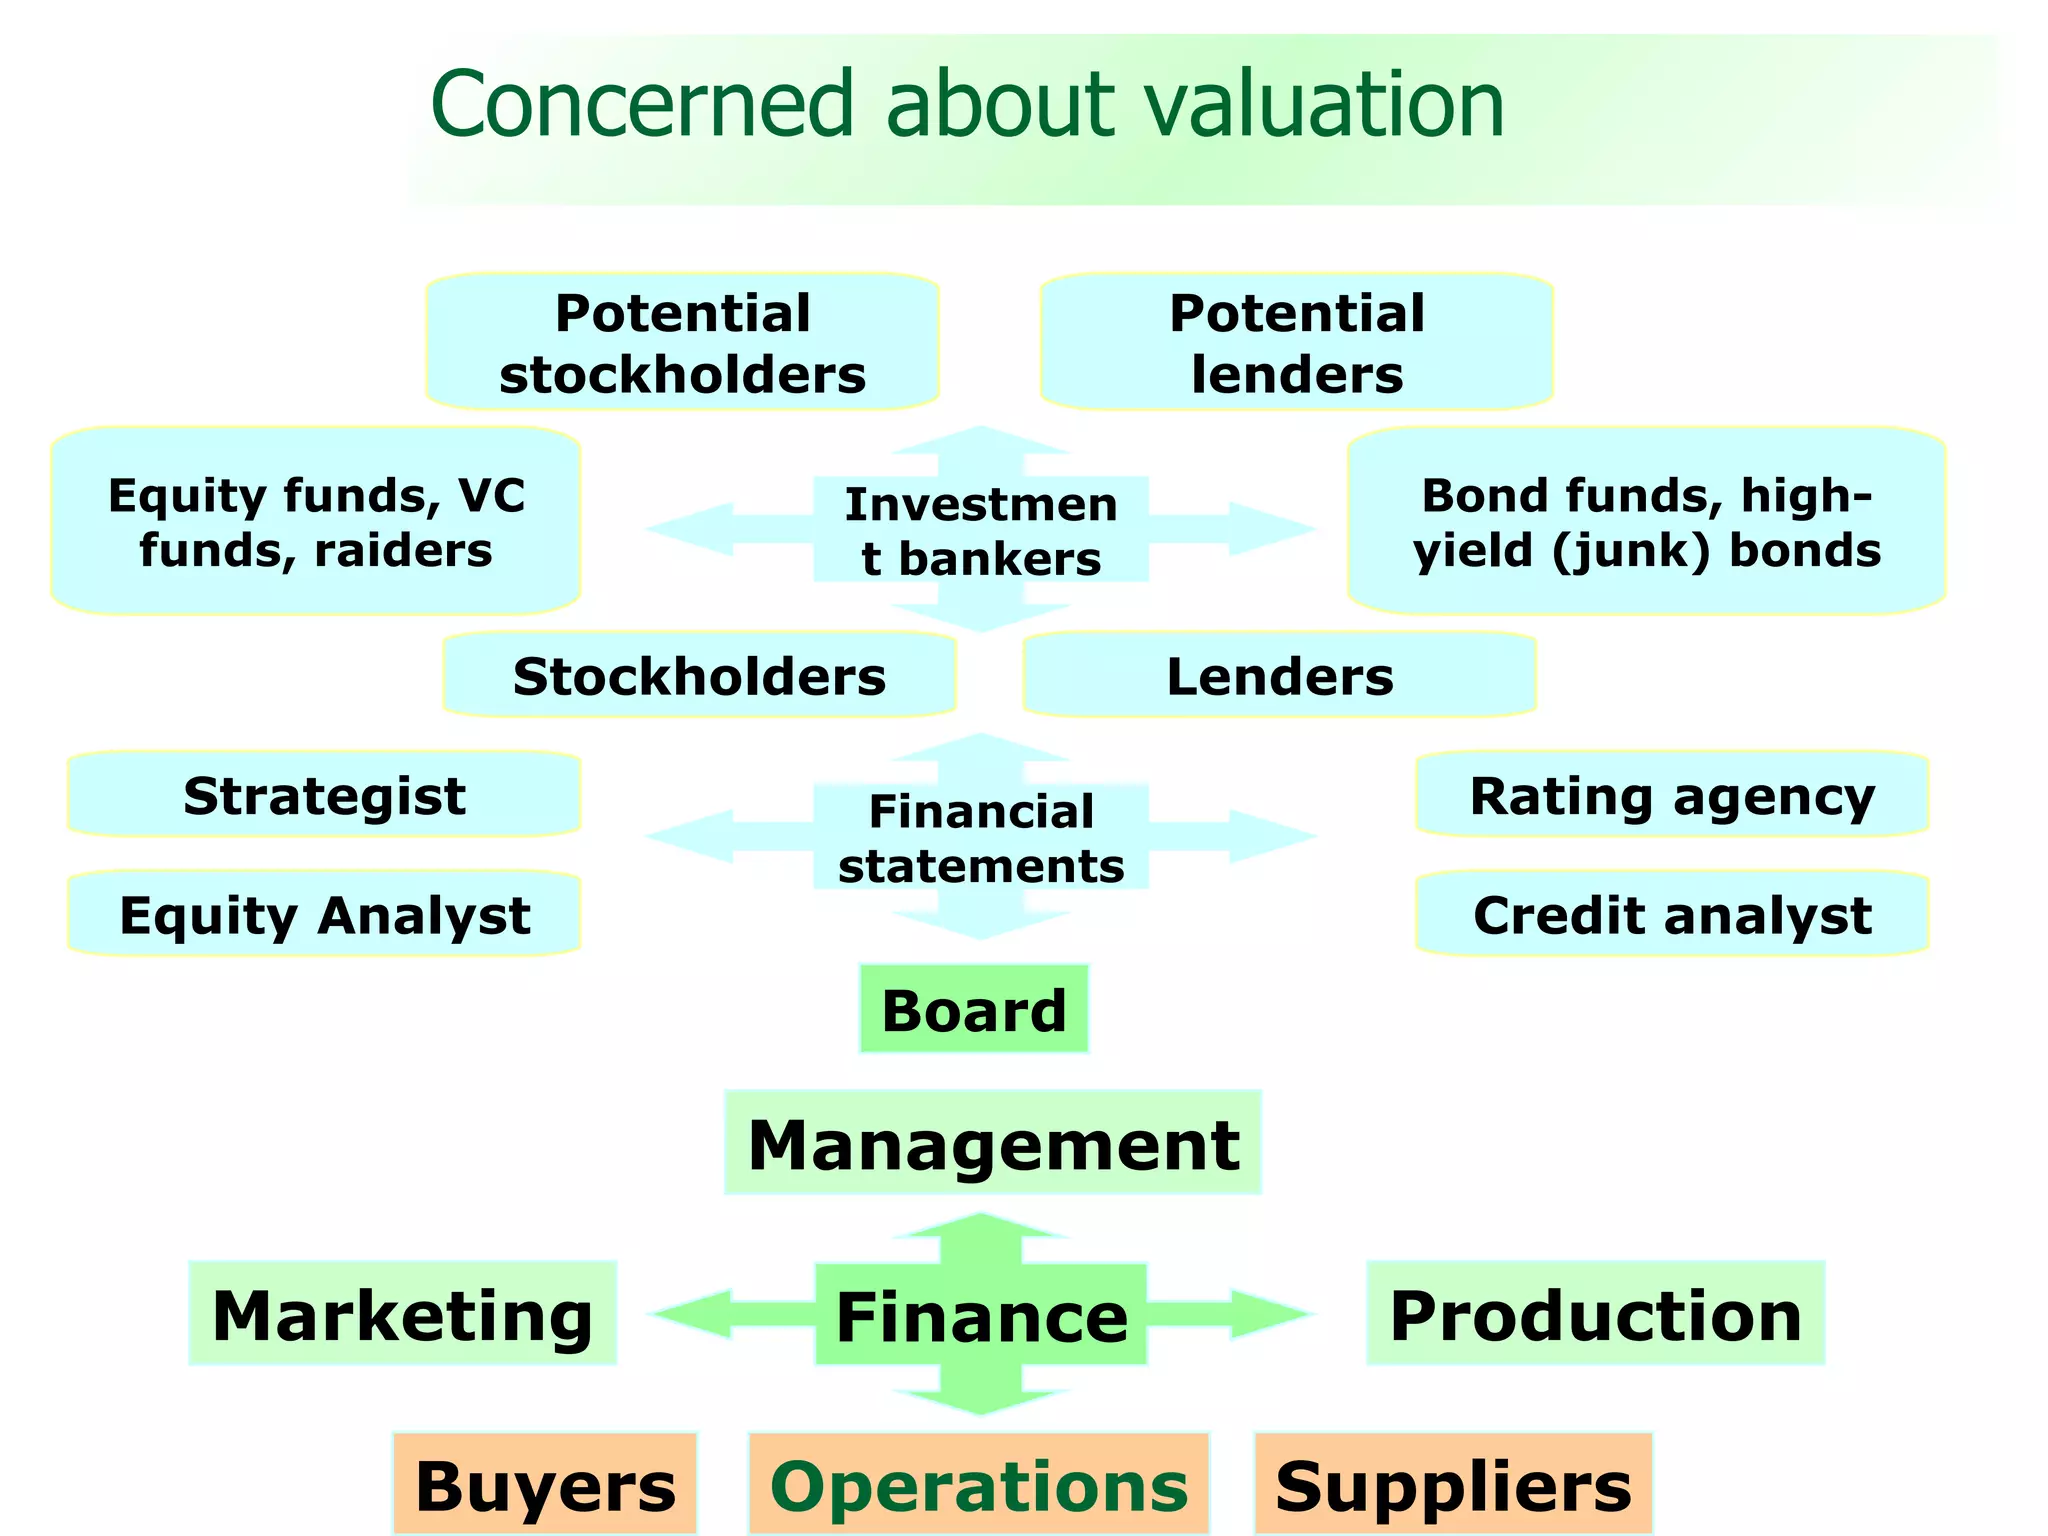
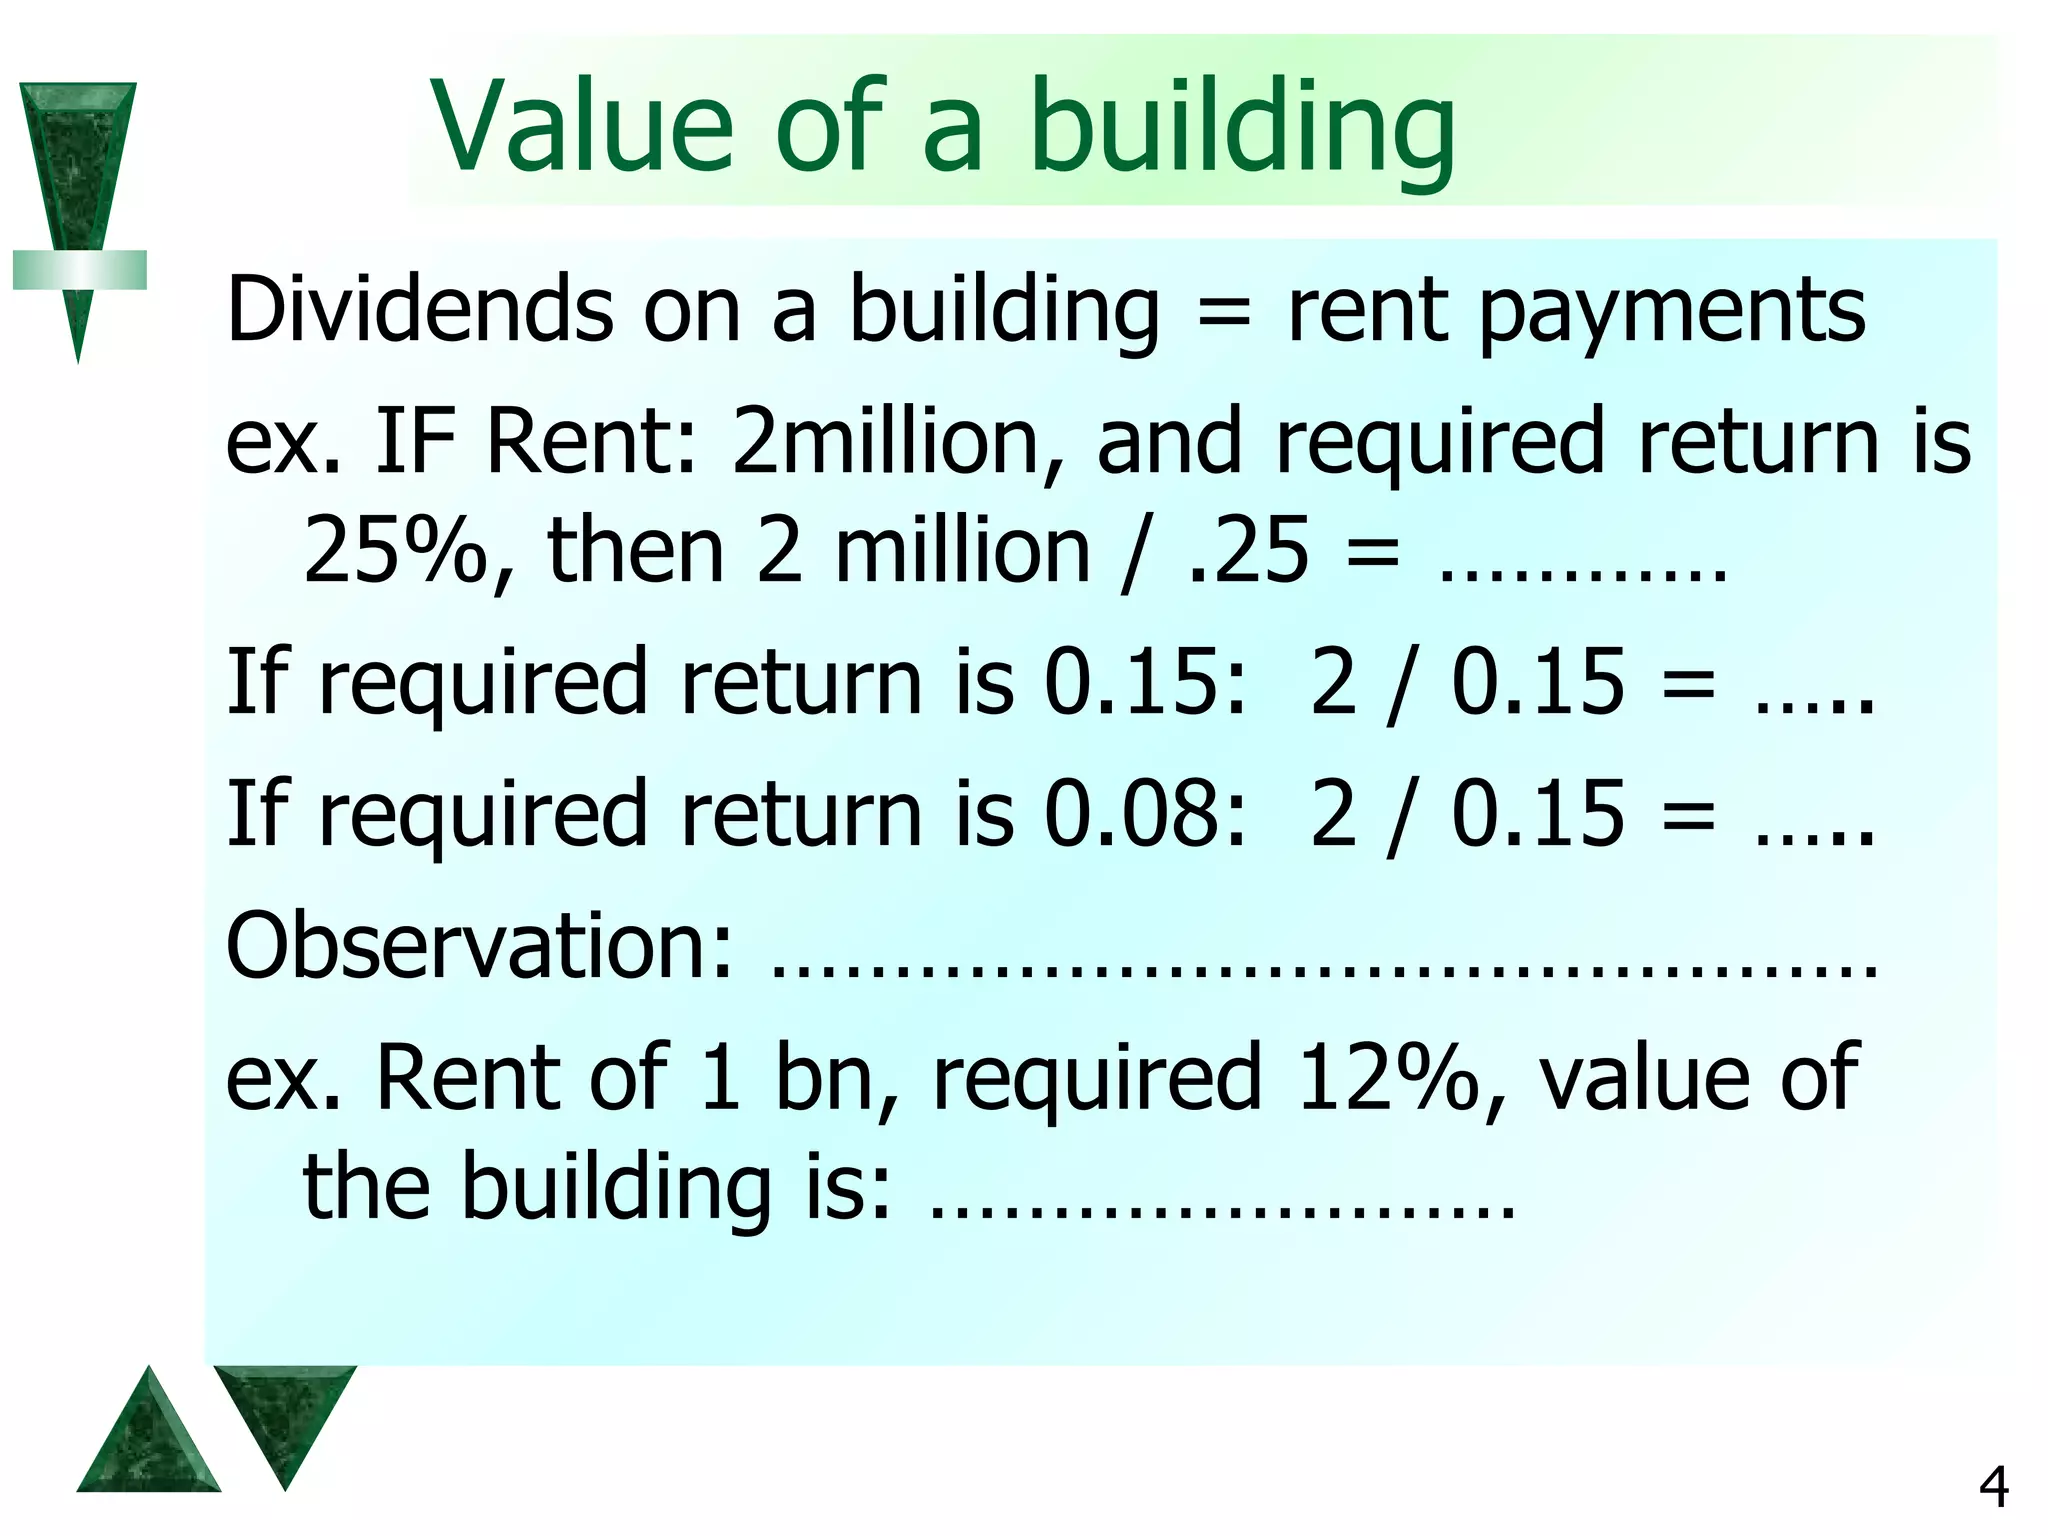
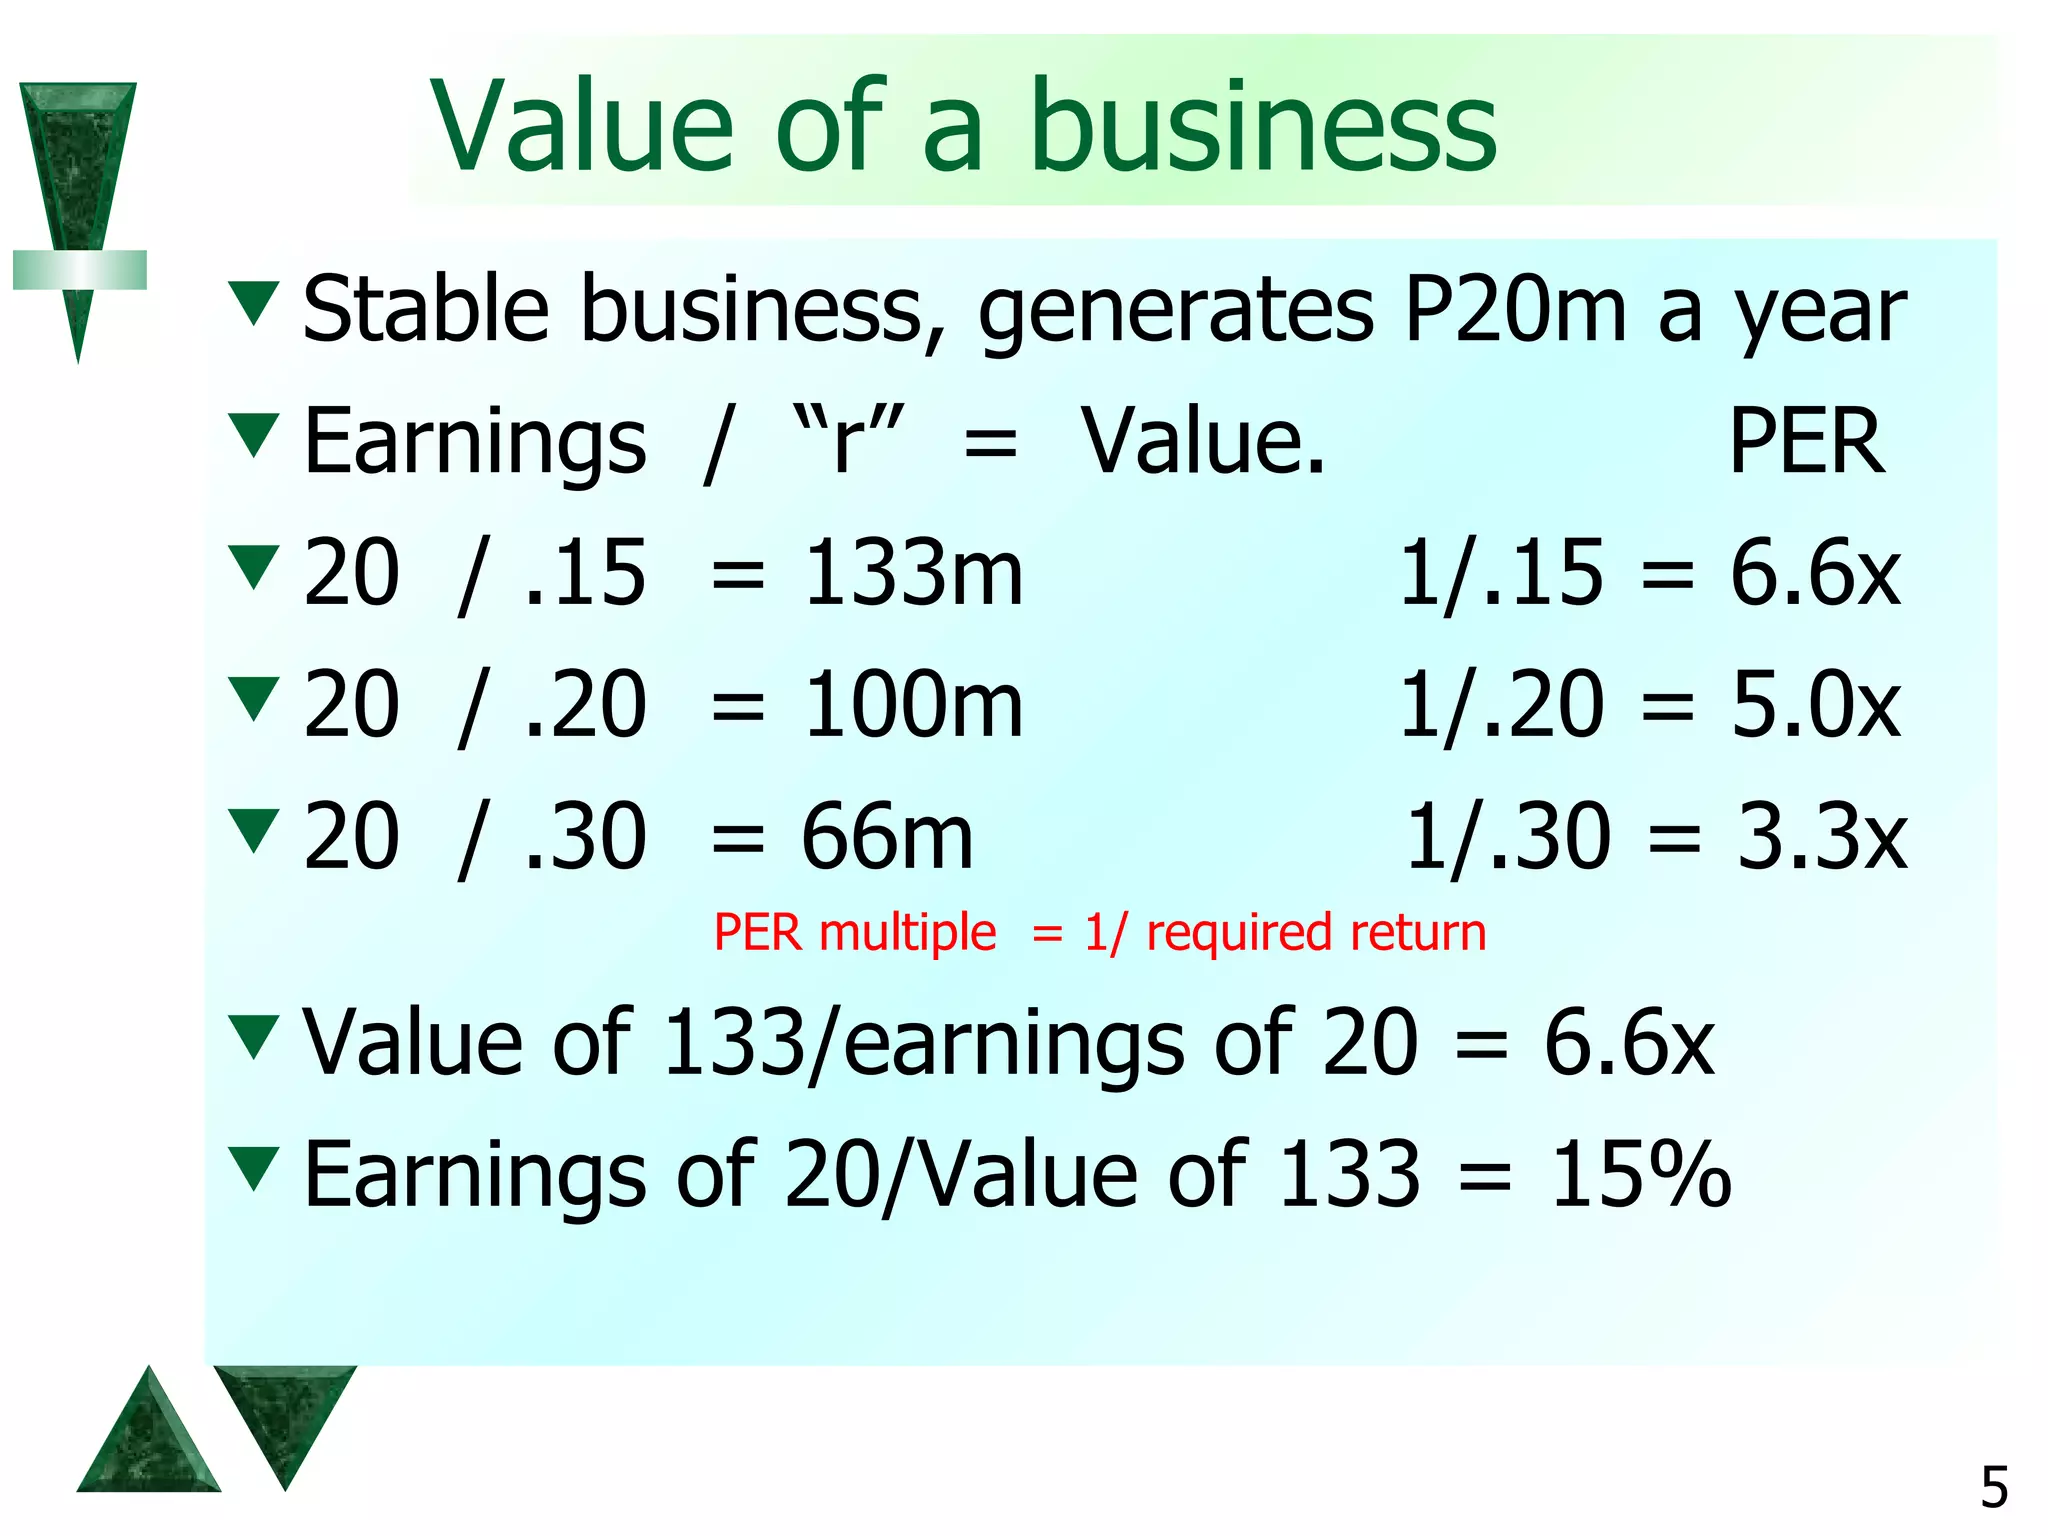
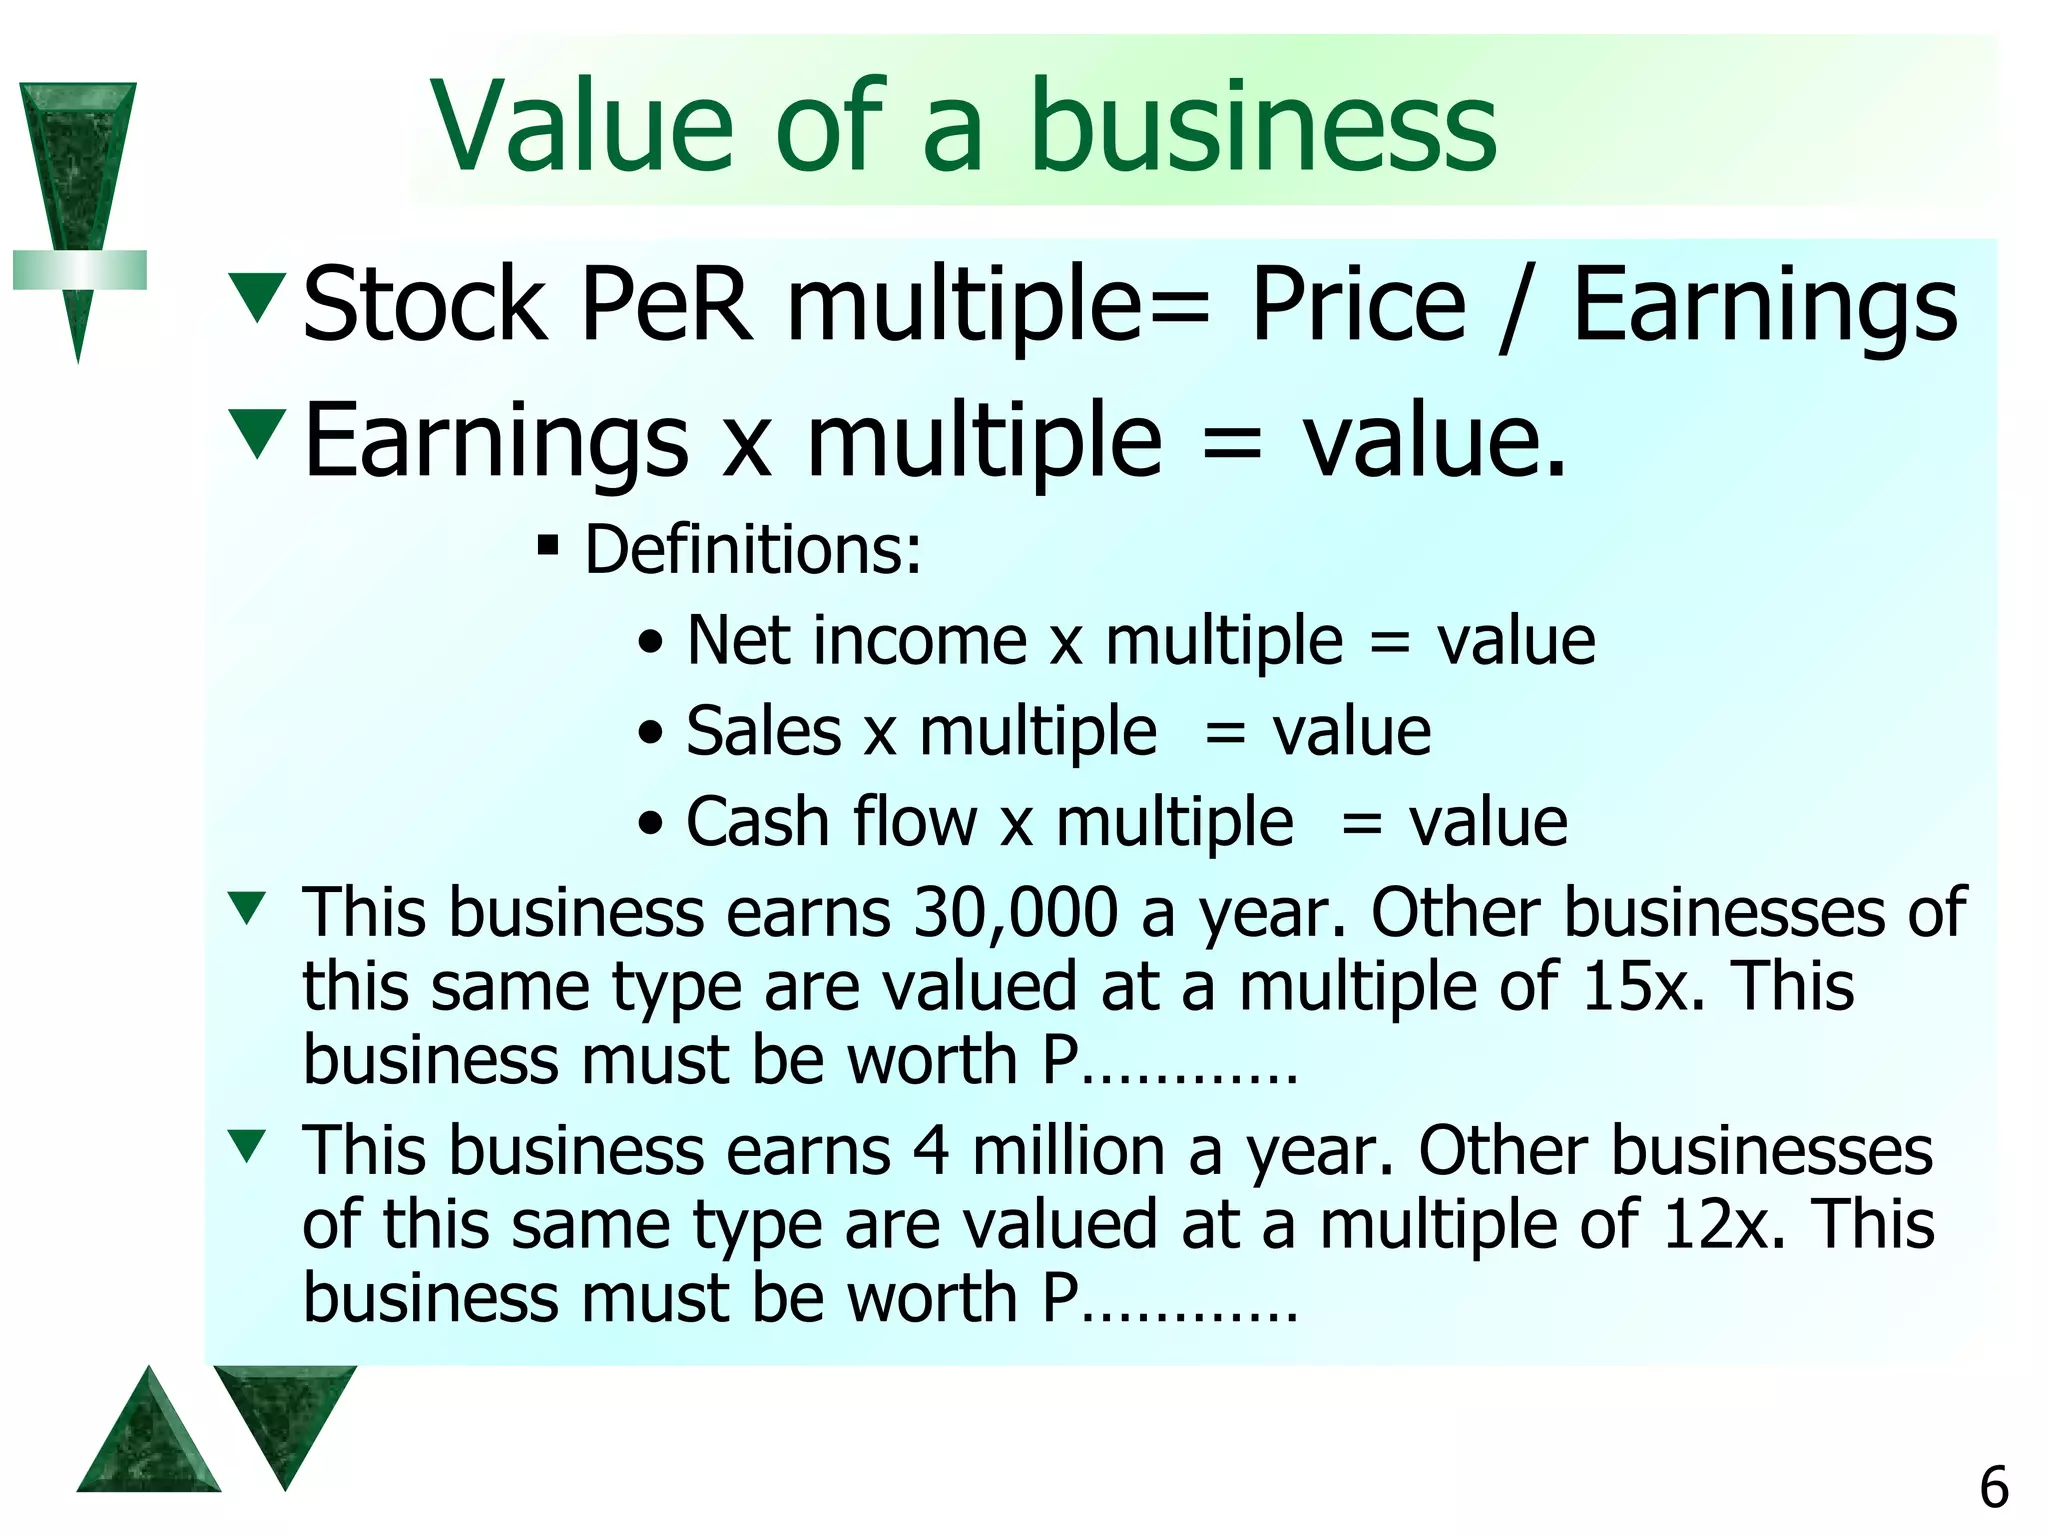
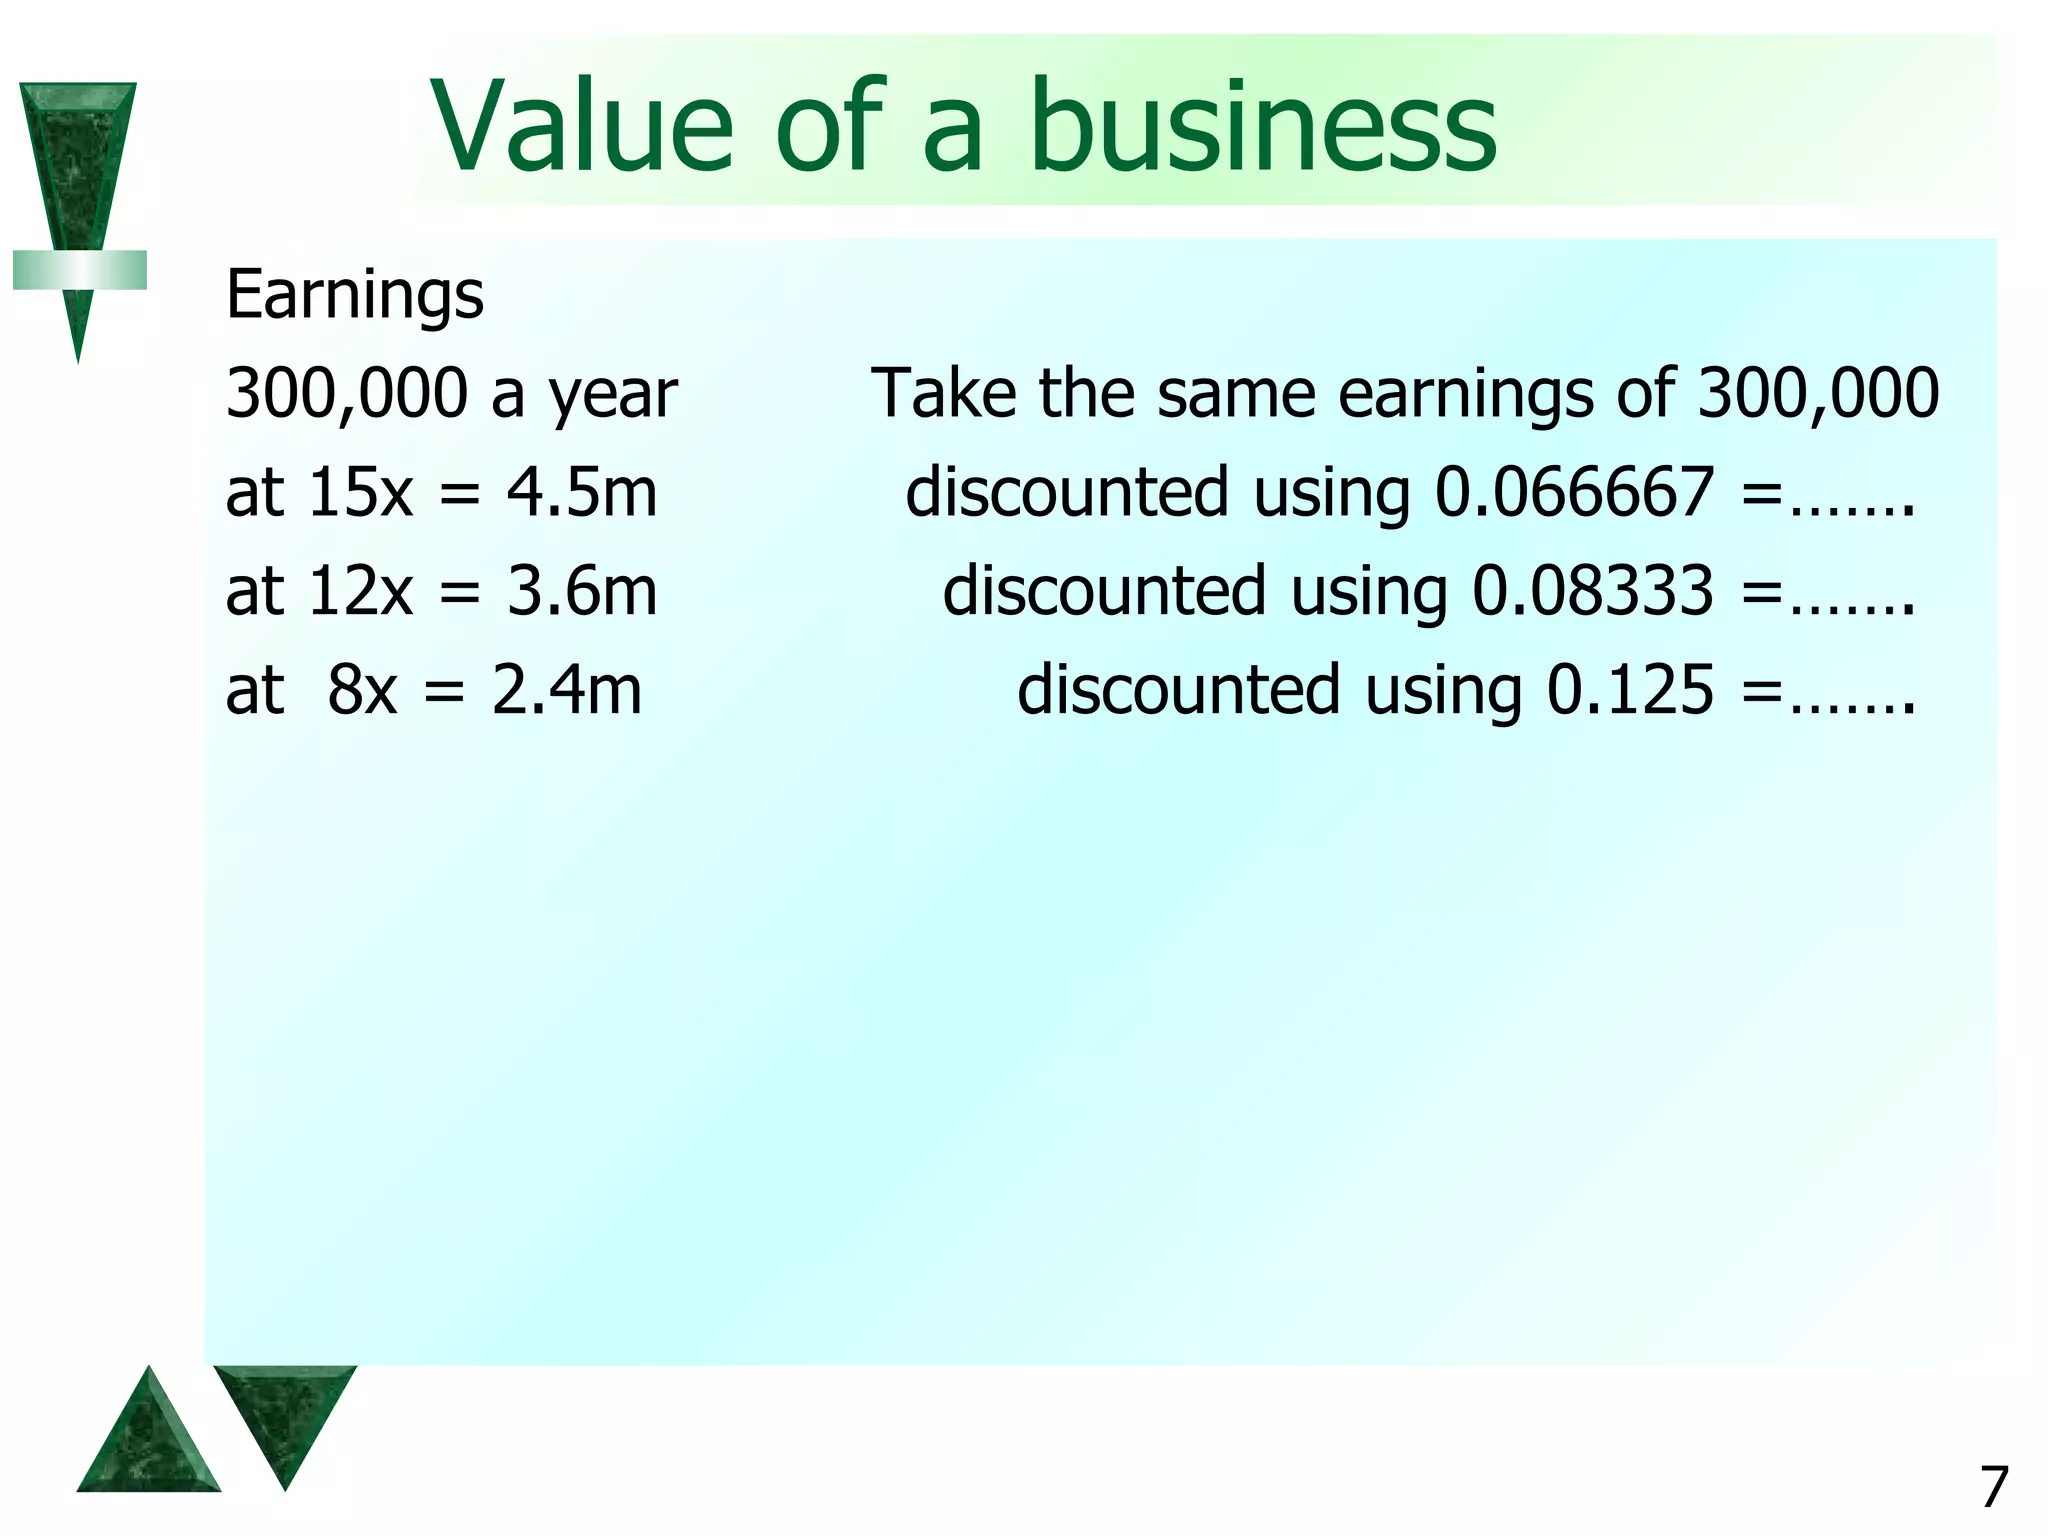
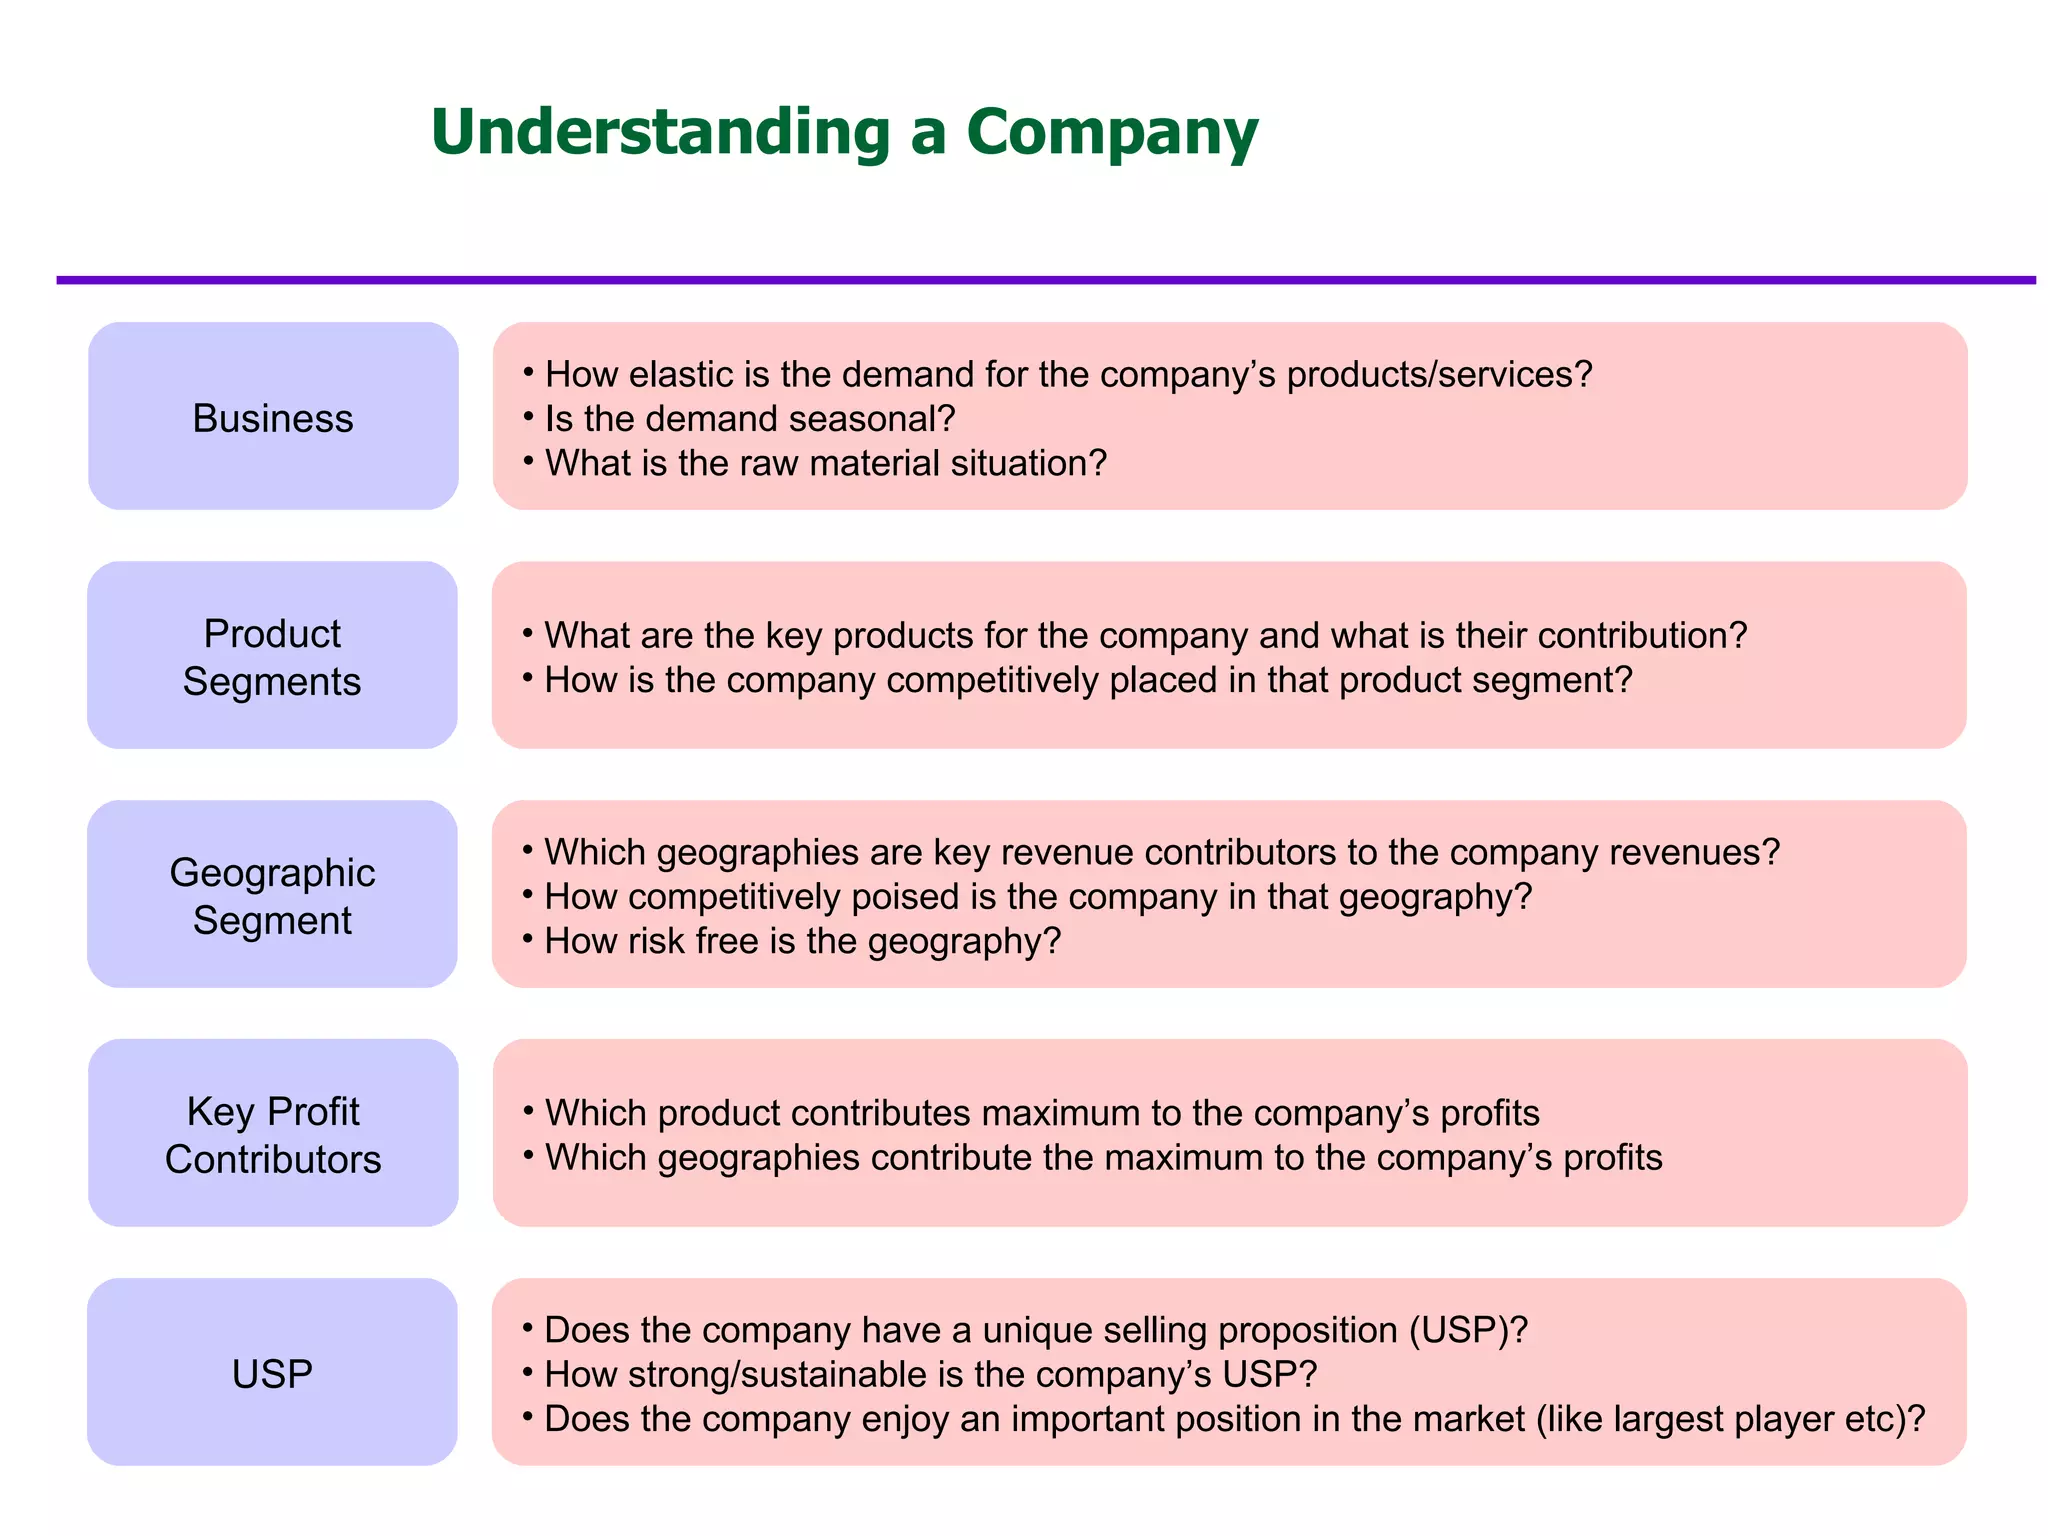
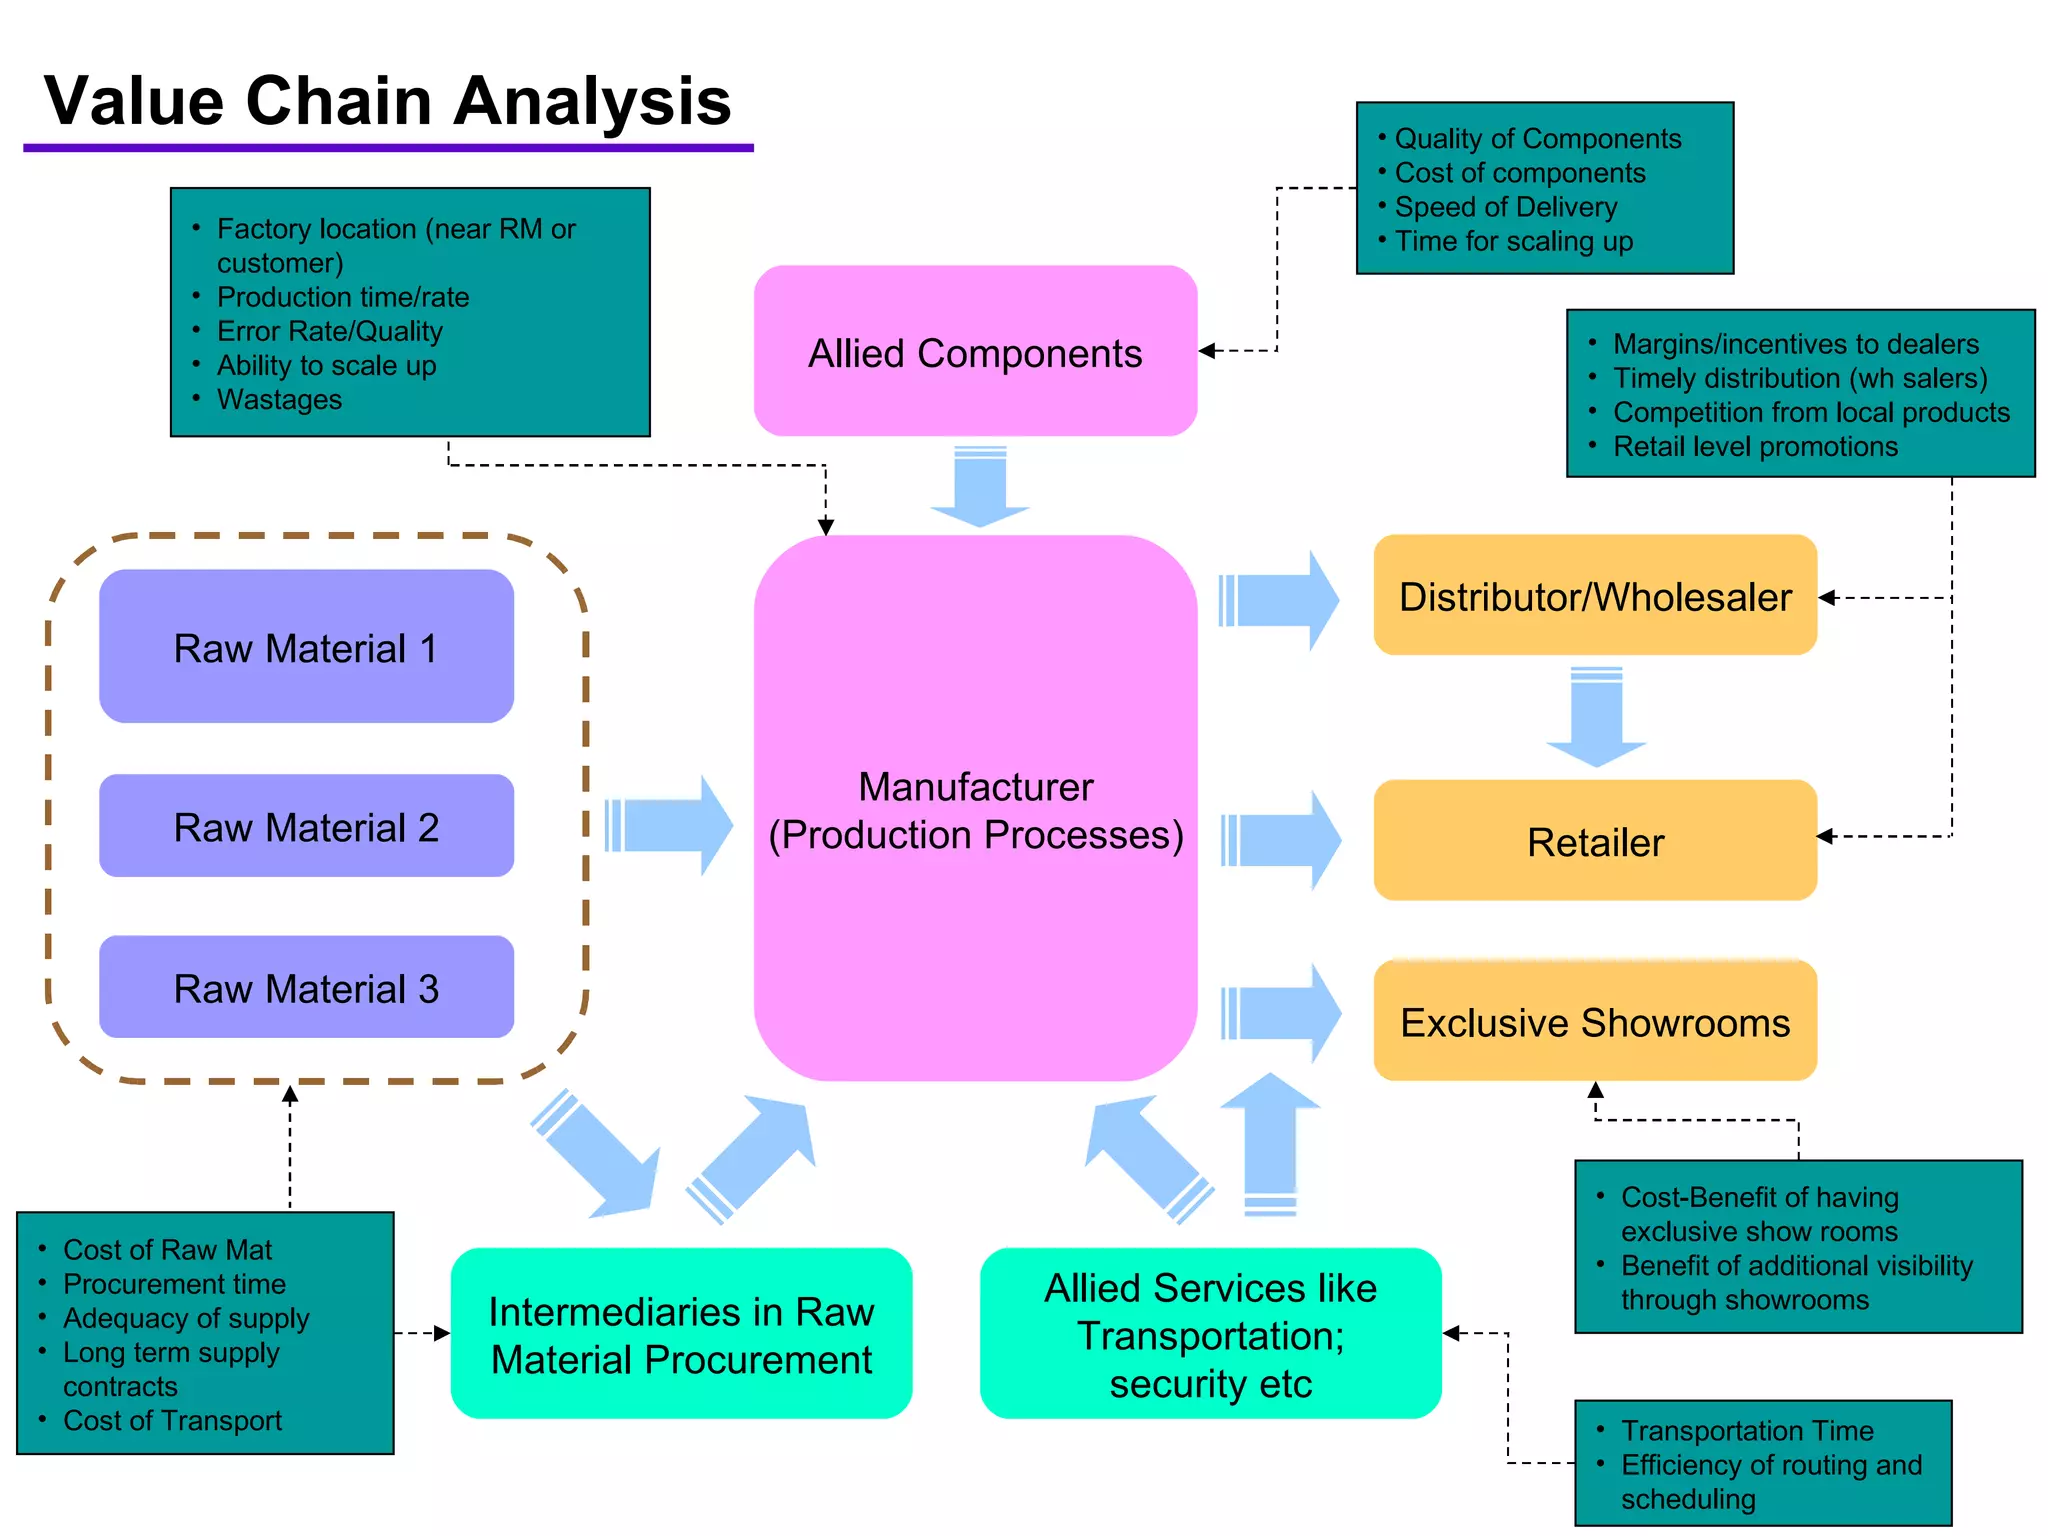
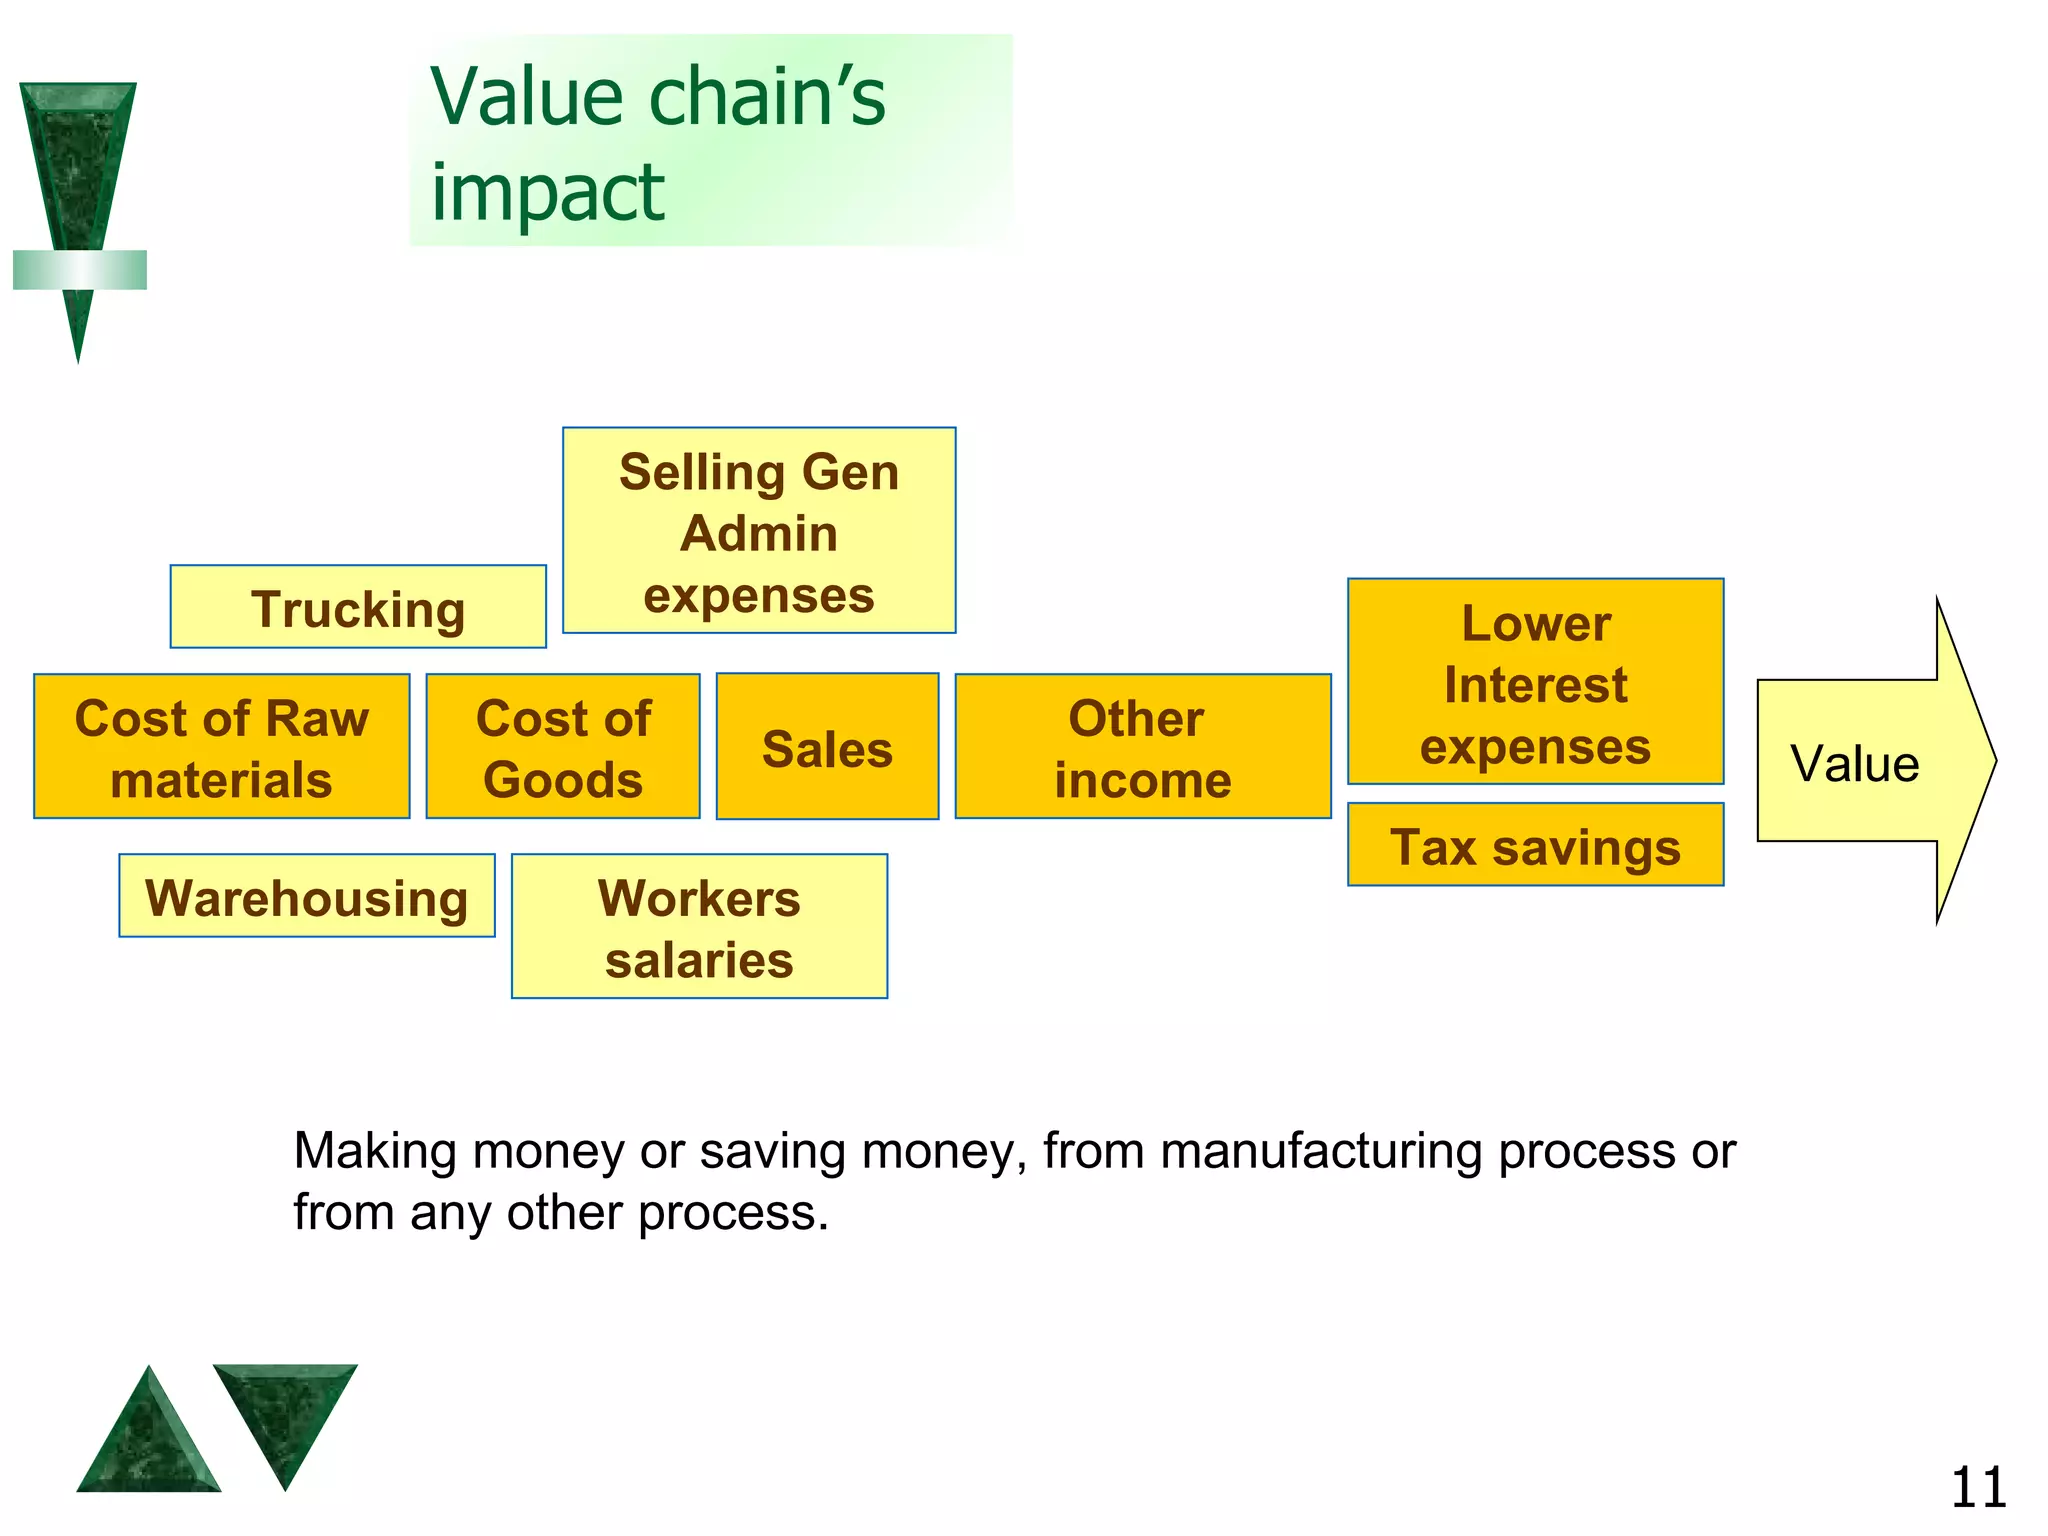
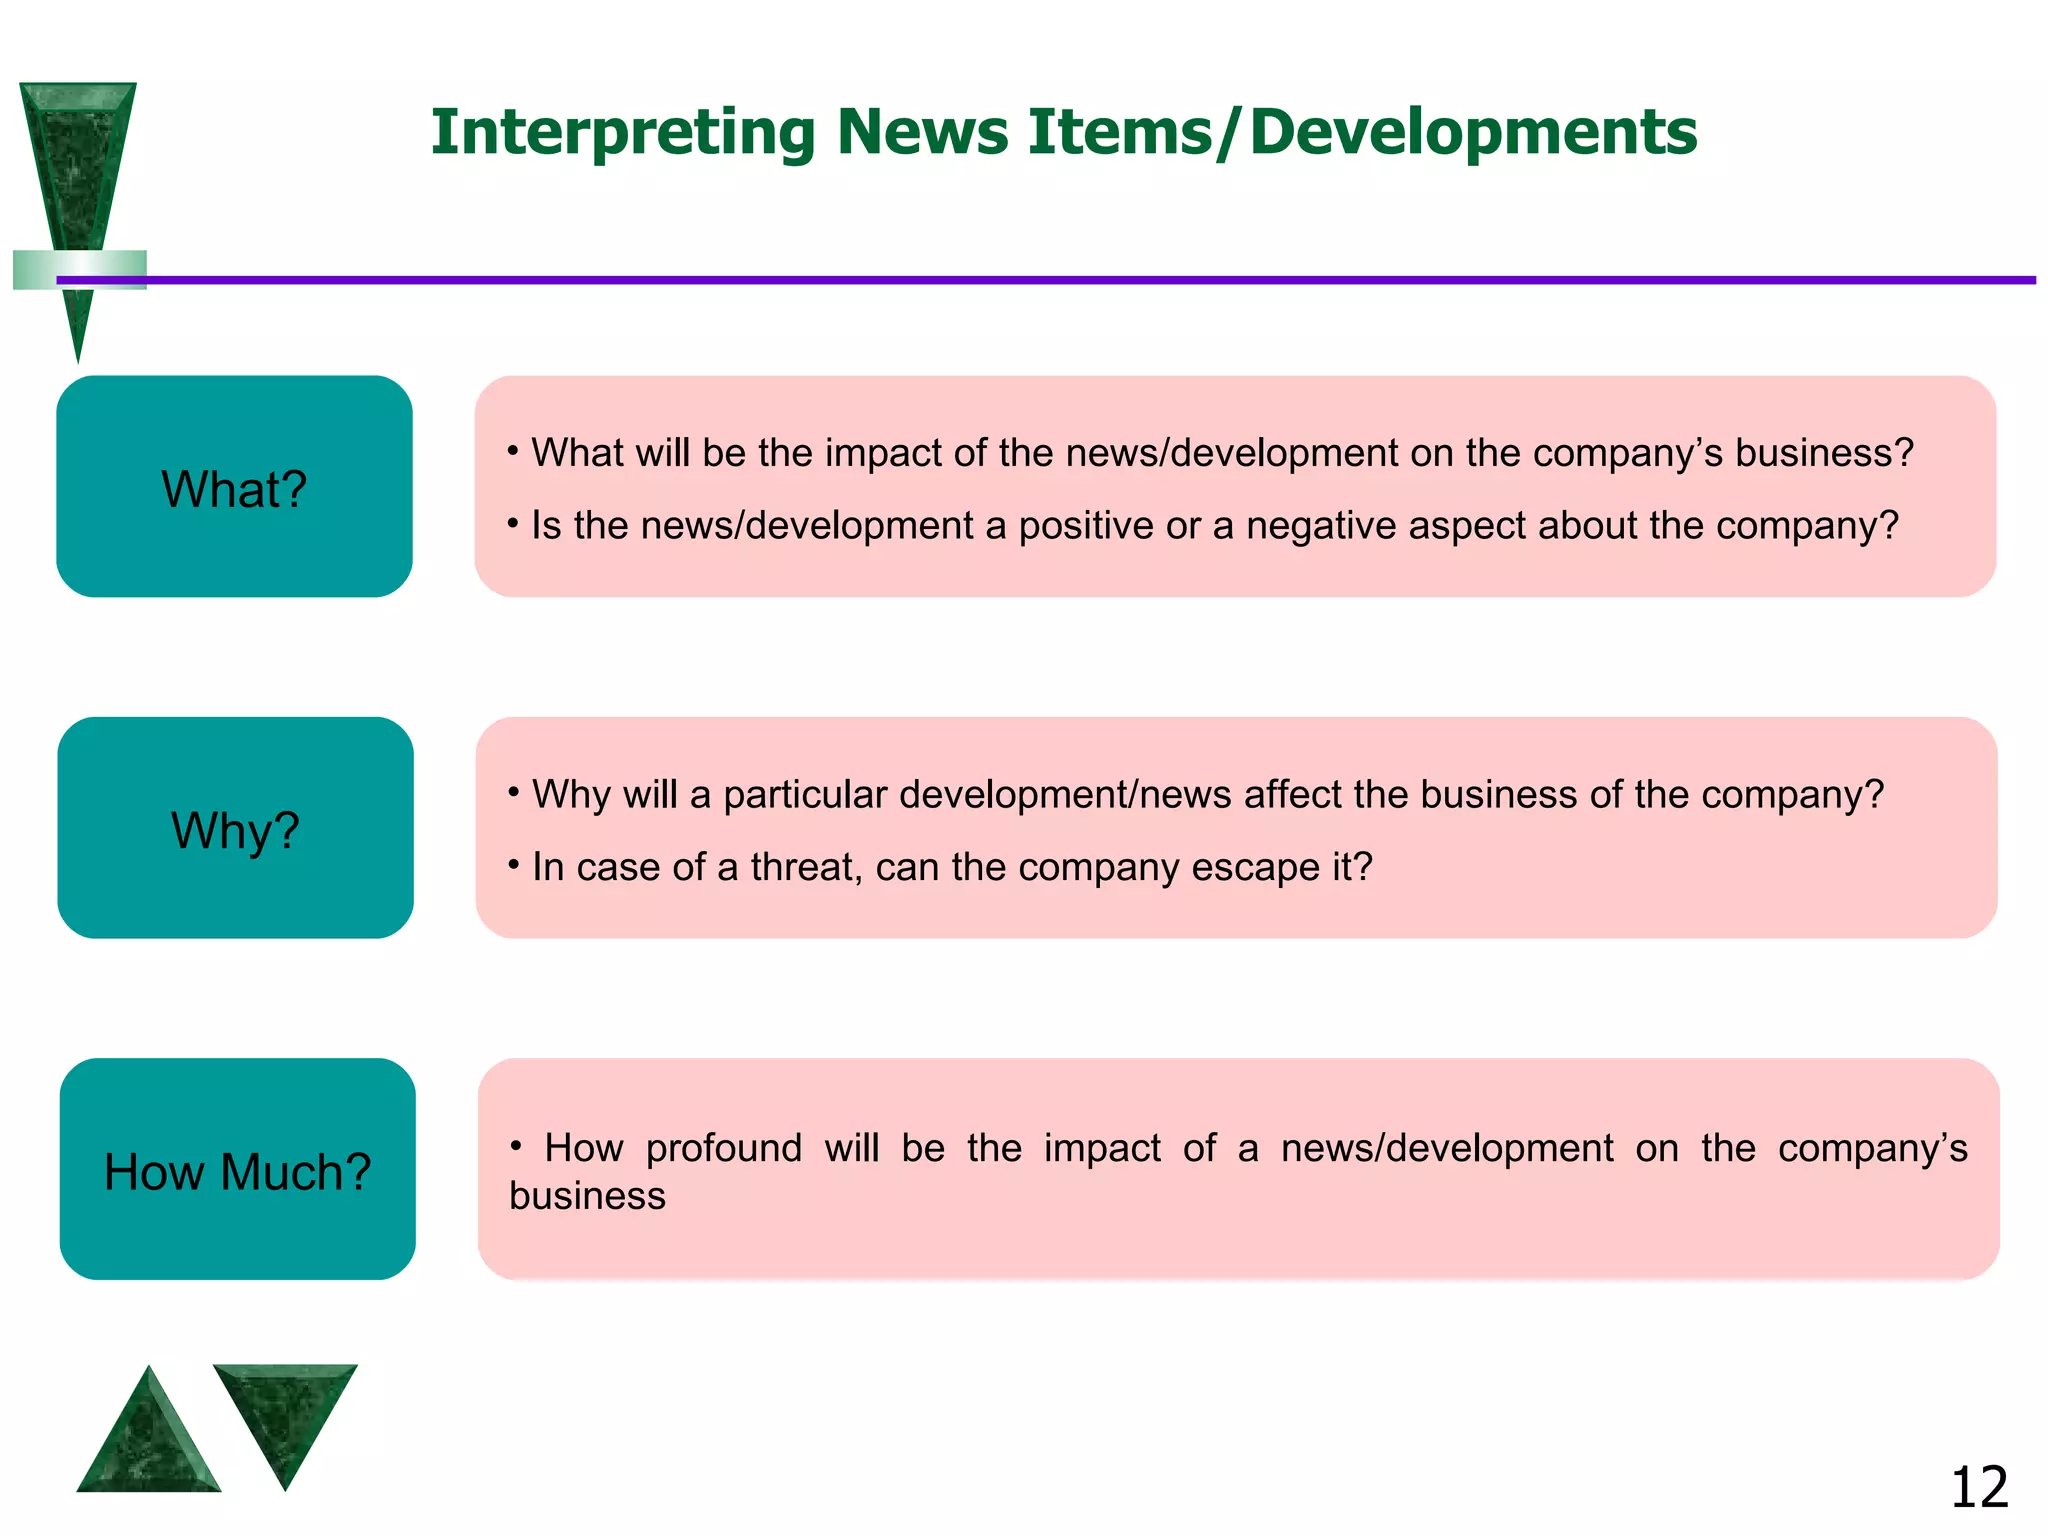

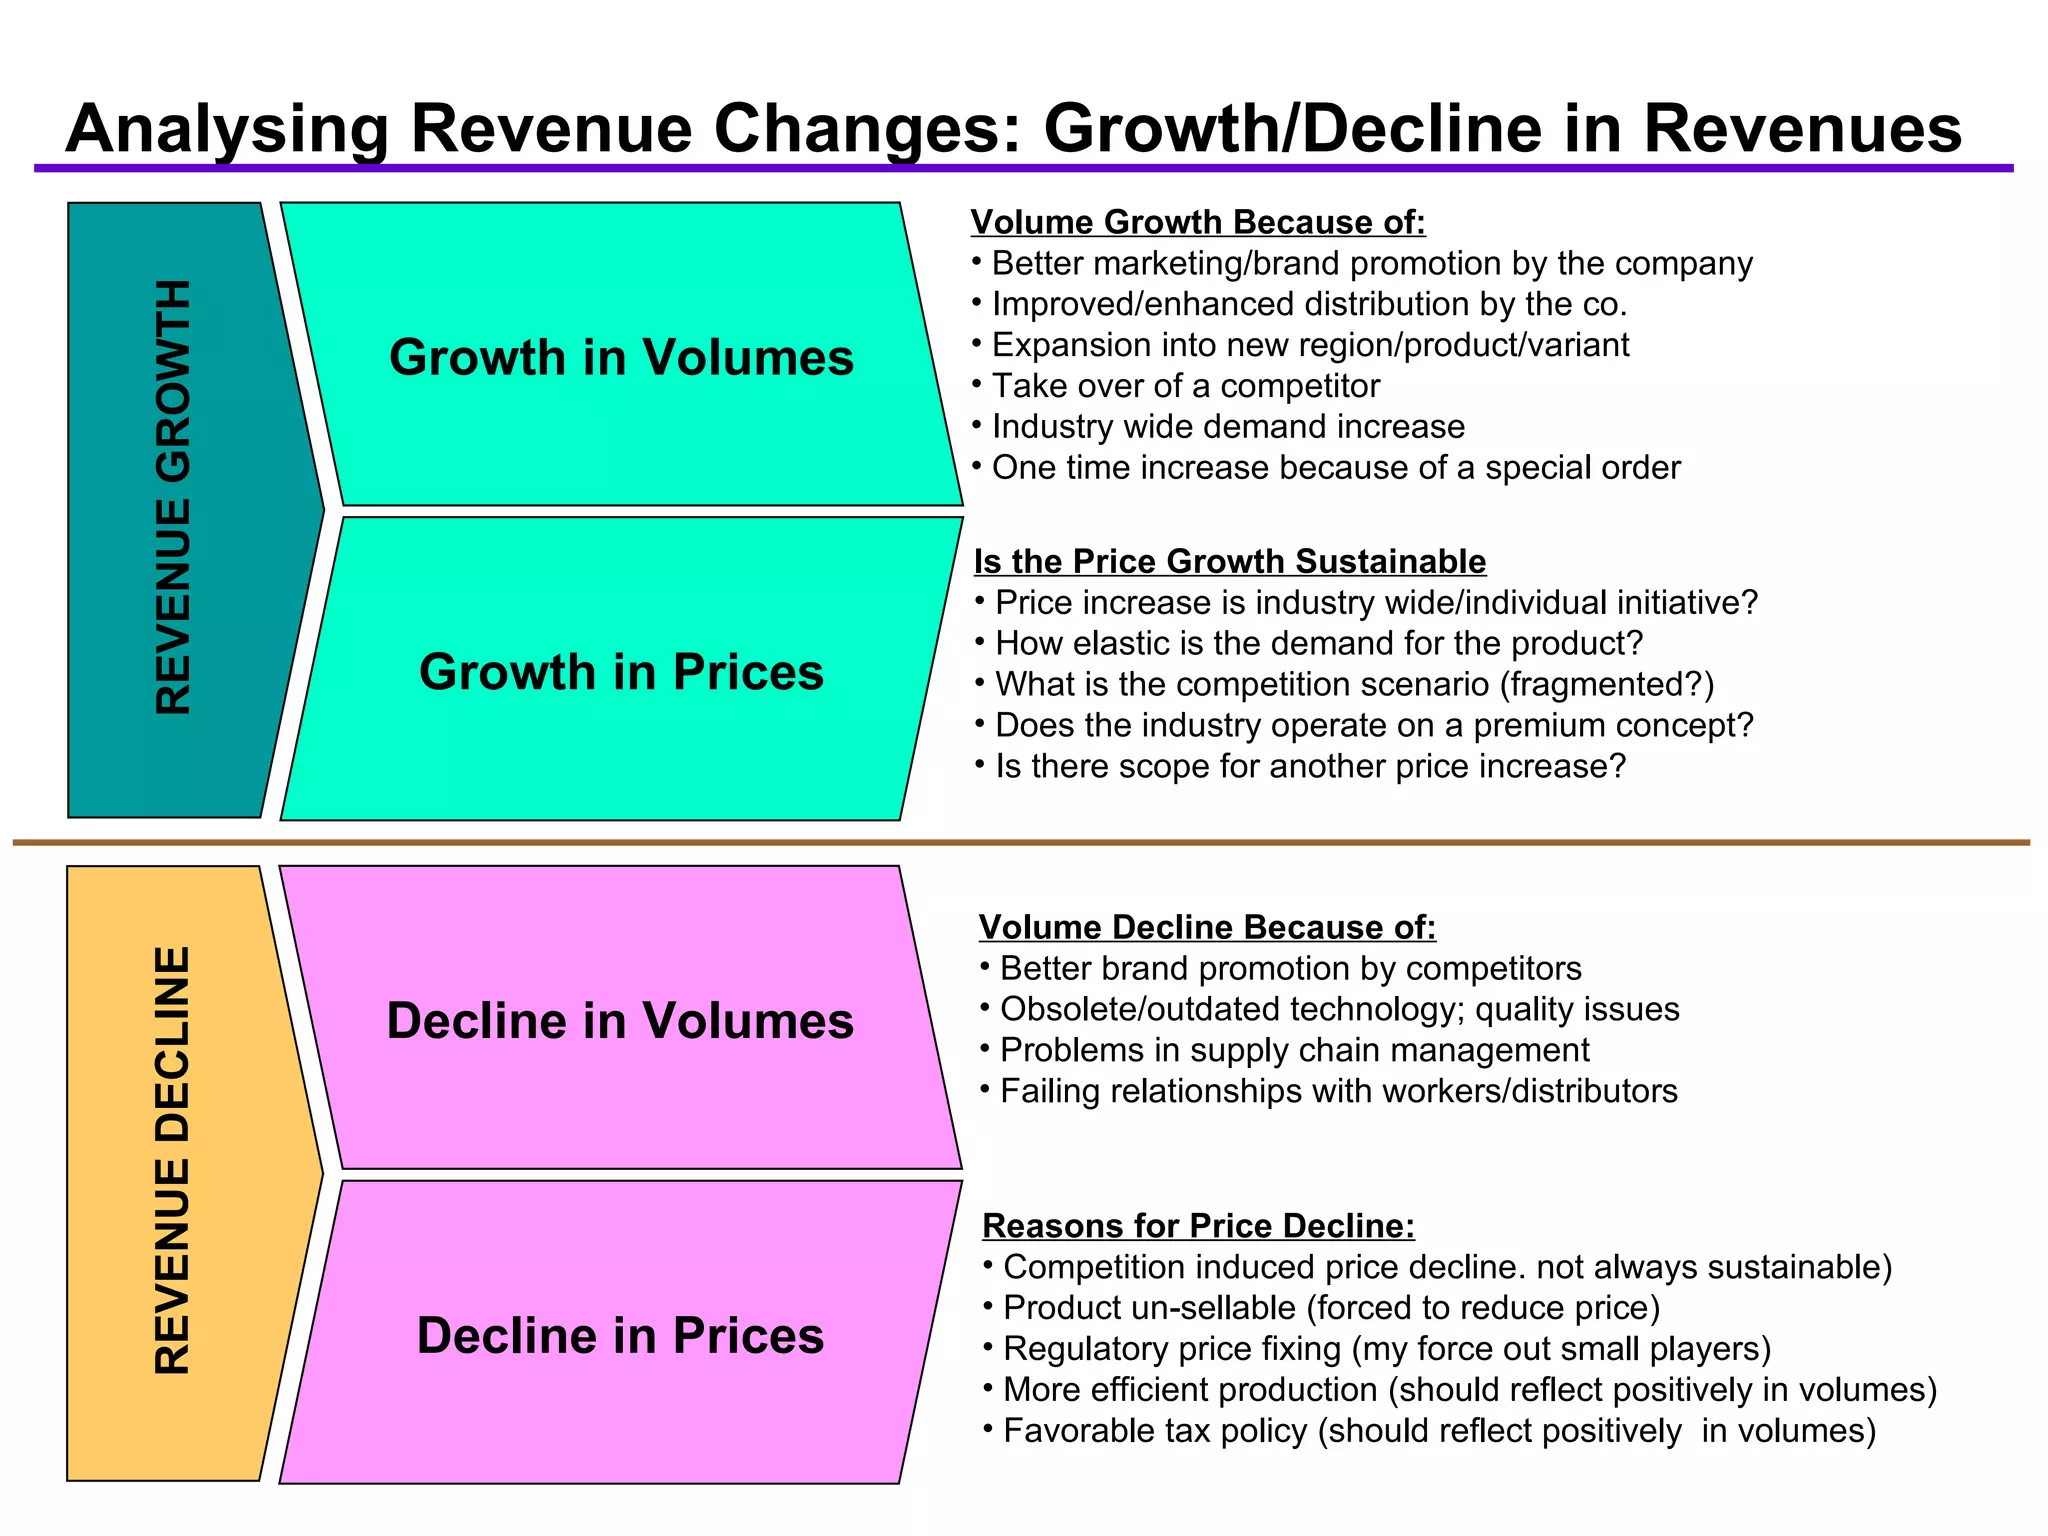
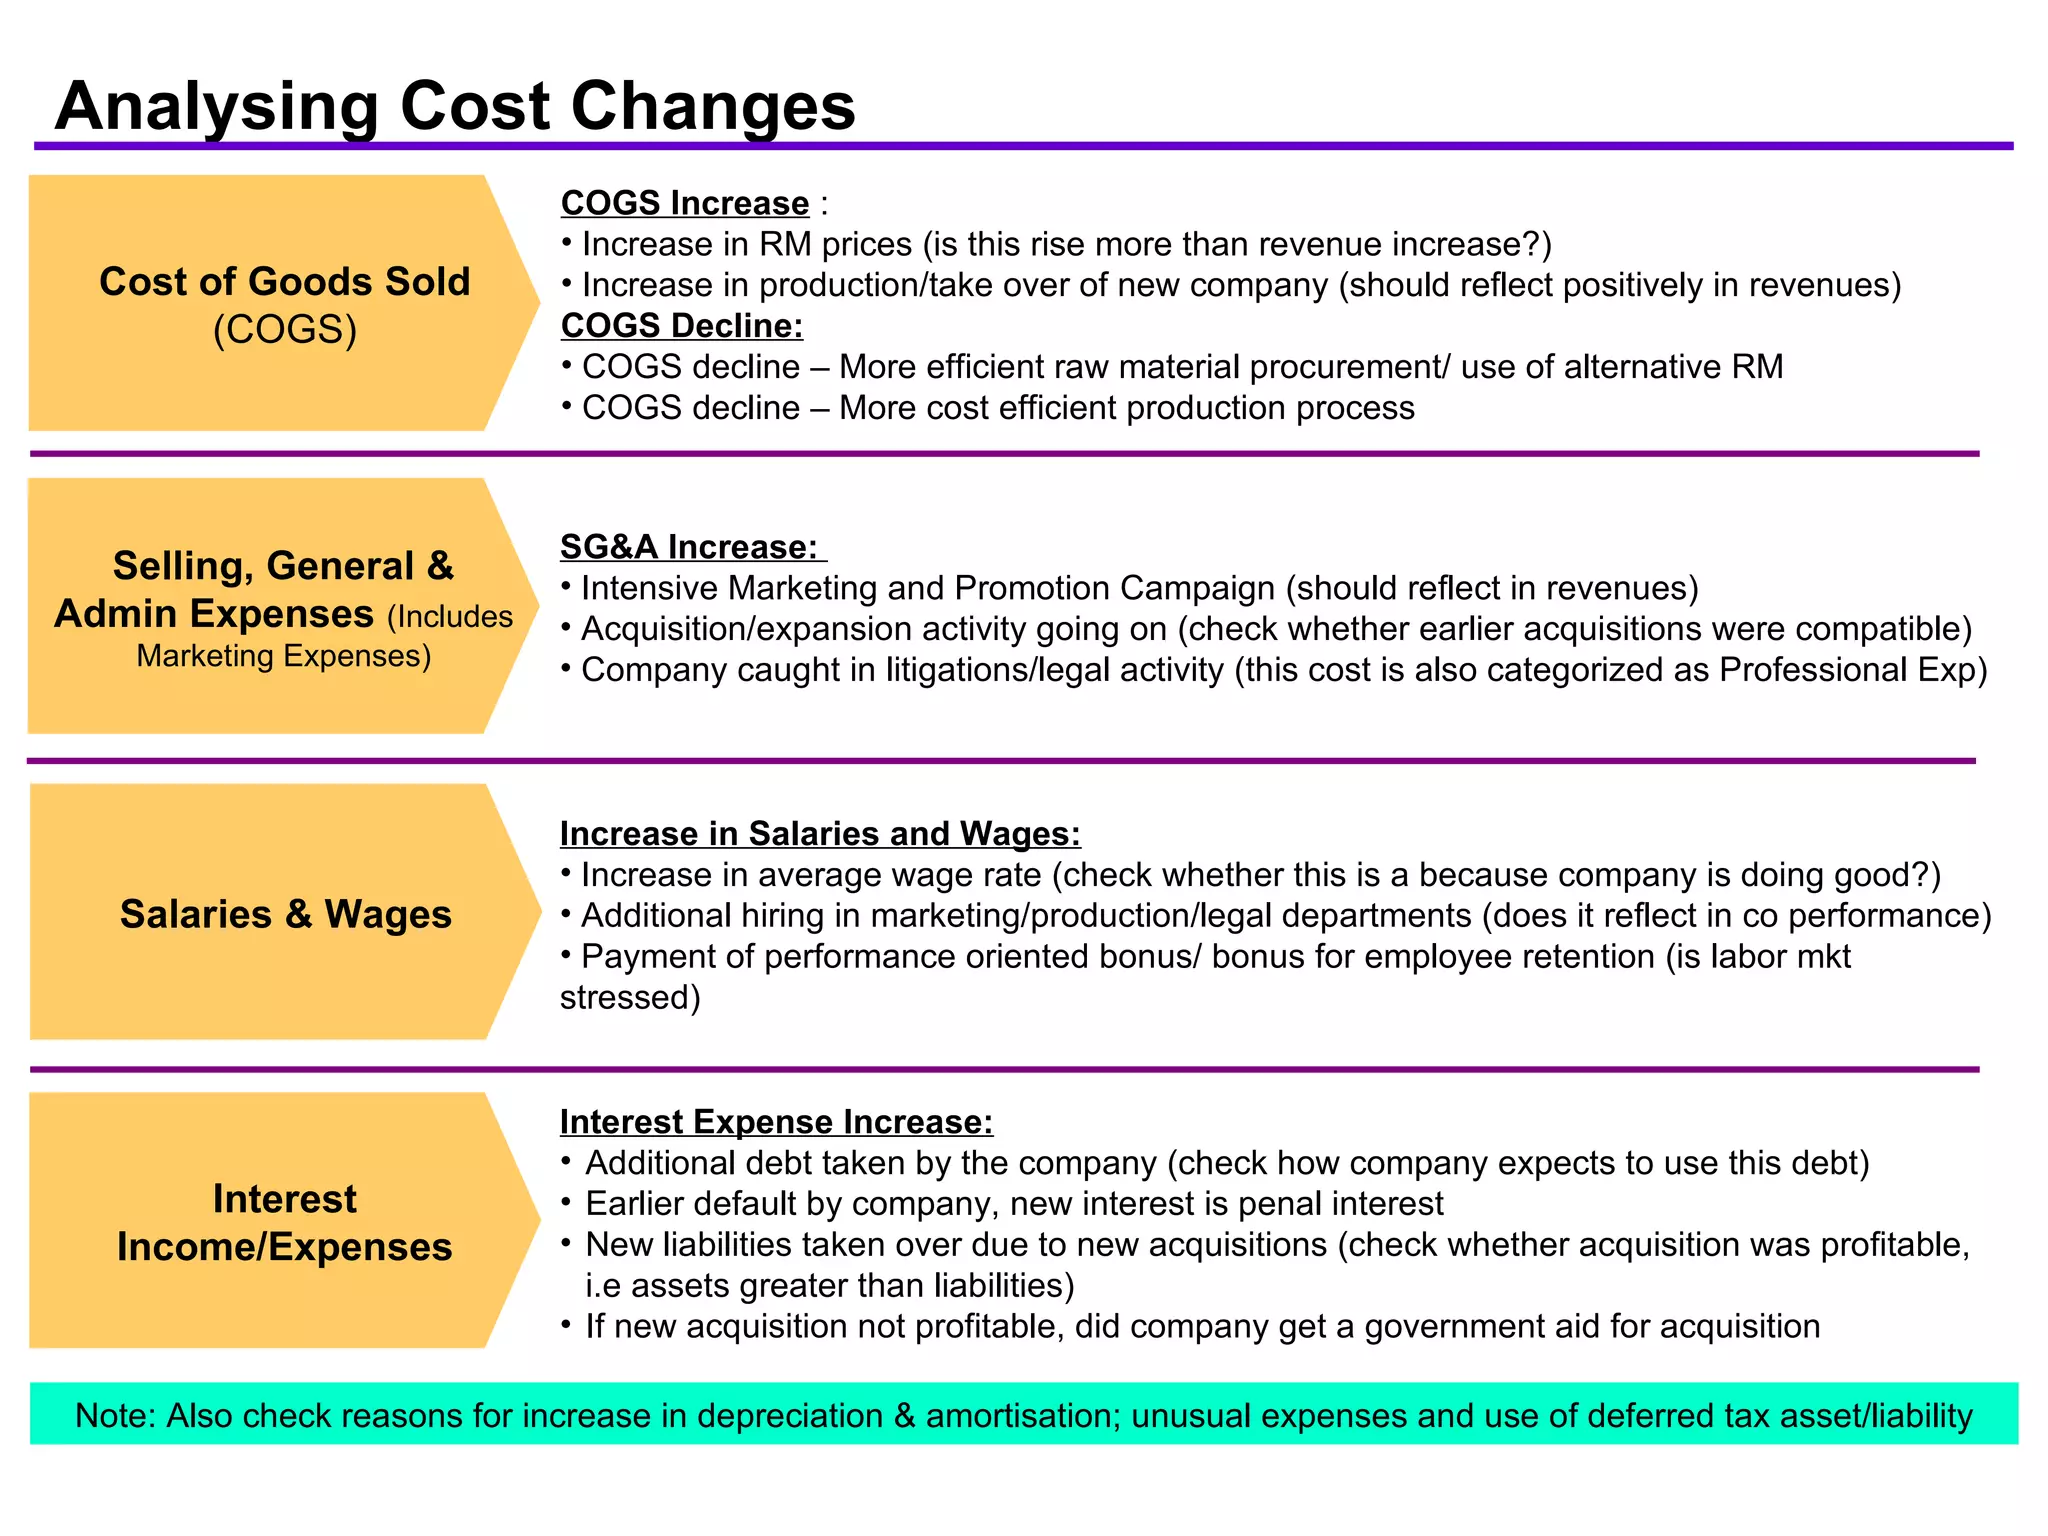

The document discusses valuation techniques for businesses and analysis of company financials. It provides examples of how to calculate the value of a business based on earnings, dividends, or required rate of return. It also outlines key areas to analyze for a company including products, markets, competitors, and impact of news/developments. Financial statement analysis techniques are presented for revenue, costs, balance sheet ratios, and interpreting what ratios indicate.