Download as PDF, PPTX
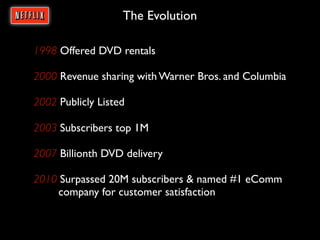


Netflix has experienced strong growth since 1998 by expanding its DVD rental business and becoming a leader in online streaming. It now has over 20 million subscribers across various streaming platforms and devices. While it faces competition from other streaming services, Netflix maintains healthy margins through managing costs relative to sales and subscriber growth. Its financial position remains strong with high cash balances, moderate debt levels, and strong cash flows to support continued investment in expanding its streaming library and technology. Sustaining its innovation, brand reputation for quality, and cost management will be keys to Netflix's ongoing success.


