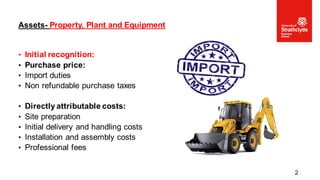
• Initial recognition:
•Purchase price:
• Import duties
• Non refundable purchase taxes
• Directly attributable costs:
• Site preparation
• Initial delivery and handling costs
• Installation and assembly costs
• Professional fees
Assets- Property, Plant and Equipment
2
3.
• Measurement AFTERrecognition
• Cost model
• Cost less accumulated depreciation
• Revaluation model
• Valuation: sufficient regularity that does not differ materially from Fair
Value(market value):
• - volatile: annual
• - non volatile: 3-5 years
• Revalue entire class
Assets- Property, Plant and Equipment
3
4.
• Measurement AFTERrecognition
• Revaluation model
• Upward revaluation to OCI (Other Comprehensive Income)
• Downward revaluation:
• 1st to OCI then to p&l
Assets- Property, Plant and Equipment
4
5.
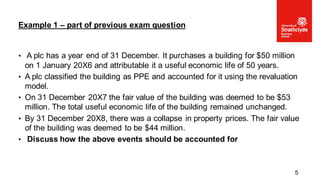
• A plchas a year end of 31 December. It purchases a building for $50 million
on 1 January 20X6 and attributable it a useful economic life of 50 years.
• A plc classified the building as PPE and accounted for it using the revaluation
model.
• On 31 December 20X7 the fair value of the building was deemed to be $53
million. The total useful economic life of the building remained unchanged.
• By 31 December 20X8, there was a collapse in property prices. The fair value
of the building was deemed to be $44 million.
• Discuss how the above events should be accounted for
Example 1 – part of previous exam question
5
6.
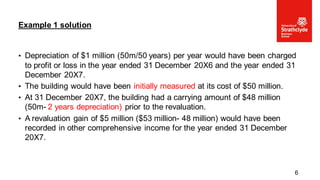
• Depreciation of$1 million (50m/50 years) per year would have been charged
to profit or loss in the year ended 31 December 20X6 and the year ended 31
December 20X7.
• The building would have been initially measured at its cost of $50 million.
• At 31 December 20X7, the building had a carrying amount of $48 million
(50m- 2 years depreciation) prior to the revaluation.
• A revaluation gain of $5 million ($53 million- 48 million) would have been
recorded in other comprehensive income for the year ended 31 December
20X7.
Example 1 solution
6
7.
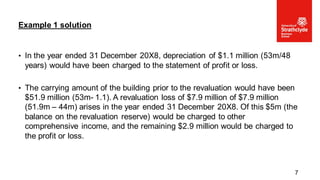
• In theyear ended 31 December 20X8, depreciation of $1.1 million (53m/48
years) would have been charged to the statement of profit or loss.
• The carrying amount of the building prior to the revaluation would have been
$51.9 million (53m- 1.1). A revaluation loss of $7.9 million of $7.9 million
(51.9m – 44m) arises in the year ended 31 December 20X8. Of this $5m (the
balance on the revaluation reserve) would be charged to other
comprehensive income, and the remaining $2.9 million would be charged to
the profit or loss.
Example 1 solution
7
8.
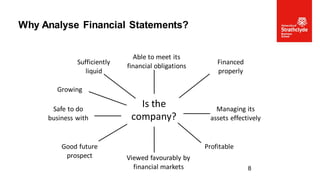
Why Analyse FinancialStatements?
8
Is the
company?
Growing
Profitable
Managing its
assets effectively
Sufficiently
liquid
Financed
properly
Able to meet its
financial obligations
Viewed favourably by
financial markets
Good future
prospect
Safe to do
business with
9.
• Quick andsimple check on financial health
• Small number of ratios gives a picture of the business.
• Easy to calculate, harder to interpret.
• Provide a starting point for further investigation.
Financial ratios
9
10.
• Simple summaryof complex information
• Compare businesses of different size
• Gives picture of company strategy
• Financial and trading performance
• Compare with industry averages
• Simple summary of complex information
Advantages of ratios
10
11.
• No agreementon definitions or specific set of ratios
• Timing of data does not match user needs
• Differing accounting policies
• May not give sufficient attention to the notes to the accounts
• Accounting policies may affect comparison
• Industry differences
Problems with ratio analysis
11
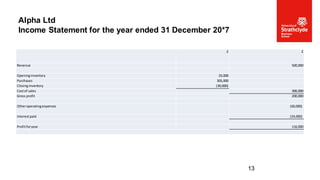
£ £
Revenue 500,000
Openinginventory25,000
Purchases 305,000
Closinginventory (30,000)
Costof sales 300,000
Gross profit 200,000
Otheroperatingexpenses (60,000)
Interestpaid (24,000)
Profitforyear 116,000
Alpha Ltd
Income Statement for the year ended 31 December 20*7
13
14.
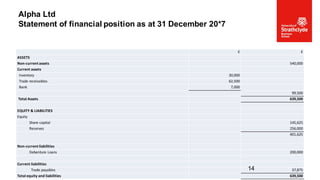
£ £
ASSETS
Non-current assets540,000
Current assets
Inventory 30,000
Trade receivables 62,500
Bank 7,000
99,500
Total Assets 639,500
EQUITY & LIABILITIES
Equity
Share capital 145,625
Reserves 256,000
401,625
Non-current liabilities
Debenture Loans 200,000
Current liabilities
Trade payables 37,875
Total equity and liabilities 639,500
Alpha Ltd
Statement of financial position as at 31 December 20*7
14
15.
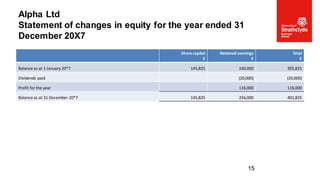
Share capital
£
Retained earnings
£
Total
£
Balanceas at 1 January 20*7 145,825 160,000 305,825
Dividends paid (20,000) (20,000)
Profit for the year 116,000 116,000
Balance as at 31 December 20*7 145,825 256,000 401,825
Alpha Ltd
Statement of changes in equity for the year ended 31
December 20X7
15
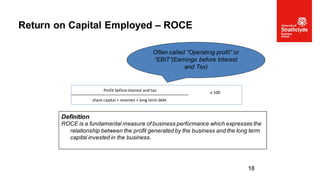
Return on CapitalEmployed – ROCE
18
Definition
ROCE is a fundamental measure of business performance which expresses the
relationship between the profit generated by the business and the long term
capital invested in the business.
Often called “Operating profit” or
“EBIT”(Earnings before Interest
and Tax)
Profit before interest and tax x 100
share capital + reserves + long term debt
19.
• Return oncapital employed is a useful ratio in analysing profitability and
efficiency together.
Return on Capital Employed – ROCE
19
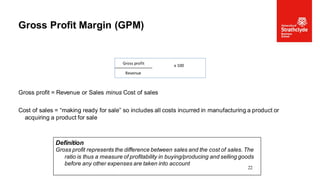
Gross profit =Revenue or Sales minus Cost of sales
Cost of sales = “making ready for sale” so includes all costs incurred in manufacturing a product or
acquiring a product for sale
Gross Profit Margin (GPM)
22
Definition
Gross profit represents the difference between sales and the cost of sales. The
ratio is thus a measure of profitability in buying/producing and selling goods
before any other expenses are taken into account
Gross profit x 100
Revenue
23.
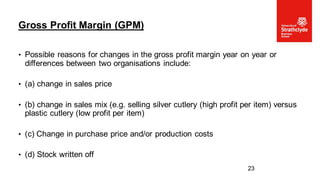
• Possible reasonsfor changes in the gross profit margin year on year or
differences between two organisations include:
• (a) change in sales price
• (b) change in sales mix (e.g. selling silver cutlery (high profit per item) versus
plastic cutlery (low profit per item)
• (c) Change in purchase price and/or production costs
• (d) Stock written off
Gross Profit Margin (GPM)
23
24.
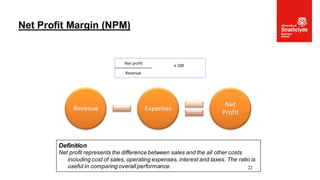
Net Profit Margin(NPM)
22
Definition
Net profit represents the difference between sales and the all other costs
including cost of sales, operating expenses, interest and taxes. The ratio is
useful in comparing overall performance.
Net profit x 100
Revenue
25.
• Possible reasonsfor changes in the net profit margin year on year or
differences between two organisations include:
• (a) One-off non-recurring expenses
• (b) Efficiency savings (economies of scale)
Net Profit Margin (NPM)
25
26.
• Calculate thegross profit and net profit ratios for Alpha Ltd.
Alpha Ltd
26
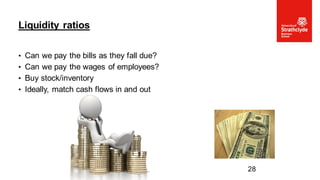
• Can wepay the bills as they fall due?
• Can we pay the wages of employees?
• Buy stock/inventory
• Ideally, match cash flows in and out
Liquidity ratios
28
29.
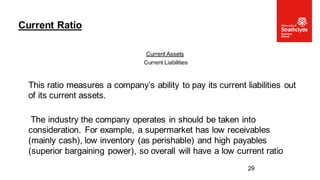
Current Assets
Current Liabilities
Thisratio measures a company’s ability to pay its current liabilities out
of its current assets.
The industry the company operates in should be taken into
consideration. For example, a supermarket has low receivables
(mainly cash), low inventory (as perishable) and high payables
(superior bargaining power), so overall will have a low current ratio
Current Ratio
29
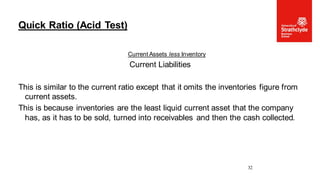
Current Assets lessInventory
Current Liabilities
This is similar to the current ratio except that it omits the inventories figure from
current assets.
This is because inventories are the least liquid current asset that the company
has, as it has to be sold, turned into receivables and then the cash collected.
Quick Ratio (Acid Test)
32
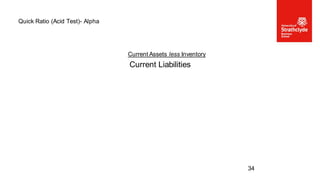
Current Assets lessInventory
Current Liabilities
Quick Ratio (Acid Test)- Alpha
34
35.
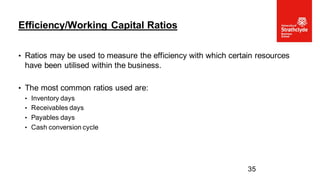
• Ratios maybe used to measure the efficiency with which certain resources
have been utilised within the business.
• The most common ratios used are:
• Inventory days
• Receivables days
• Payables days
• Cash conversion cycle
Efficiency/Working Capital Ratios
35
36.
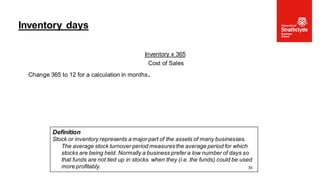
Inventory x 365
Costof Sales
Change 365 to 12 for a calculation in months.
Inventory days
36
Definition
Stock or inventory represents a major part of the assets of many businesses.
The average stock turnover period measures the average period for which
stocks are being held. Normally a business prefer a low number of days so
that funds are not tied up in stocks when they (i.e. the funds) could be used
more profitably.
37.
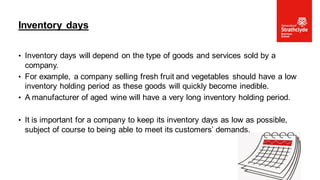
• Inventory dayswill depend on the type of goods and services sold by a
company.
• For example, a company selling fresh fruit and vegetables should have a low
inventory holding period as these goods will quickly become inedible.
• A manufacturer of aged wine will have a very long inventory holding period.
• It is important for a company to keep its inventory days as low as possible,
subject of course to being able to meet its customers’ demands.
Inventory days
37
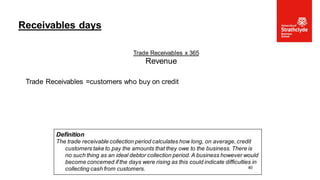
Trade Receivables x365
Revenue
Trade Receivables =customers who buy on credit
Receivables days
40
Definition
The trade receivable collection period calculates how long, on average, credit
customers take to pay the amounts that they owe to the business. There is
no such thing as an ideal debtor collection period. A business however would
become concerned if the days were rising as this could indicate difficulties in
collecting cash from customers.
Trade Payables x365
Purchases or Cost of Sales
•This ratio measures the time it takes the company to settle its trade payables. Trade payables
provide the company with a valueble source of short term fiancé, but delaying payment for too long a
period of time can cause operational problems as suppliers may stop providing goods and services
until payment is received.
Payables days
43
Trade Payables x365
Purchases or Cost of Sales
Alpha Payables days
45
46.
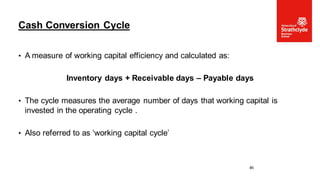
• A measureof working capital efficiency and calculated as:
Inventory days + Receivable days – Payable days
• The cycle measures the average number of days that working capital is
invested in the operating cycle .
• Also referred to as ‘working capital cycle’
Cash Conversion Cycle
46
47.
• Calculate theworking capital ratios for Alpha Ltd
Alpha Ltd
47
48.
Inventory days +Receivable days – Payable days
• =
Alpha working capital days
48
49.
• Ratios whichexamine the relationship between the amount financed by the
owners of the business and the amount financed by outsiders such as banks.
• The main ratios used are:
• Gearing ratio (or Debt/Equity ratio)
• Interest cover ratio
Financing
49
50.
• Is ita good idea to borrow?
• Creates greater risk - interest payments and capital repayments
• Benefits for shareholders when profits are rising
• Risks for shareholders when profits are falling
Financial structure
•Page 50
51.
Profit before interestand tax
Interest expense
EBIT = Earnings Before Interest and Taxation
Interest expense: either in Income Statement or in detailed notes.
Interest Cover
Page 51
Definition
This ratio quantifies the capacity of the company to meet interest payments due
out of operating profits. The higher it is provides some measure of
confidence for a lender.
52.
• Calculate theinterest cover ratio for Alpha Ltd.
Alpha Ltd
52
Page 55
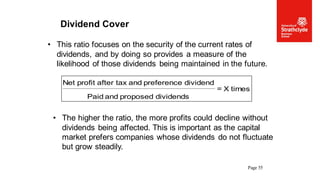
Dividend Cover
•This ratio focuses on the security of the current rates of
dividends, and by doing so provides a measure of the
likelihood of those dividends being maintained in the future.
times
X
=
dividends
proposed
and
Paid
dividend
preference
and
tax
after
profit
Net
• The higher the ratio, the more profits could decline without
dividends being affected. This is important as the capital
market prefers companies whose dividends do not fluctuate
but grow steadily.
56.
Page 56
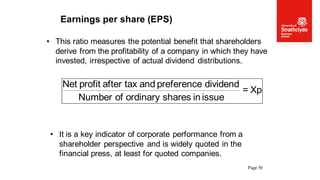
Earnings pershare (EPS)
• This ratio measures the potential benefit that shareholders
derive from the profitability of a company in which they have
invested, irrespective of actual dividend distributions.
• It is a key indicator of corporate performance from a
shareholder perspective and is widely quoted in the
financial press, at least for quoted companies.
Xp
=
issue
in
shares
ordinary
of
Number
dividend
preference
and
tax
after
profit
Net
57.
Page 57
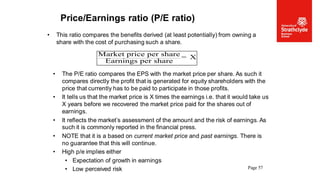
Price/Earnings ratio(P/E ratio)
• This ratio compares the benefits derived (at least potentially) from owning a
share with the cost of purchasing such a share.
• The P/E ratio compares the EPS with the market price per share. As such it
compares directly the profit that is generated for equity shareholders with the
price that currently has to be paid to participate in those profits.
• It tells us that the market price is X times the earnings i.e. that it would take us
X years before we recovered the market price paid for the shares out of
earnings.
• It reflects the market’s assessment of the amount and the risk of earnings. As
such it is commonly reported in the financial press.
• NOTE that it is a based on current market price and past earnings. There is
no guarantee that this will continue.
• High p/e implies either
• Expectation of growth in earnings
• Low perceived risk
Market price per share
Earnings per share
= X