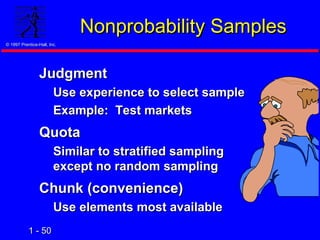
SlideShare a Scribd company logo
1 -1 - 11
© 1997 Prentice-Hall, Inc.© 1997 Prentice-Hall, Inc.
Statistics for Managers UsingStatistics for Managers Using
Microsoft ExcelMicrosoft Excel
Introduction & Data CollectionIntroduction & Data Collection
Chapter 1Chapter 1
1 -1 - 22
© 1997 Prentice-Hall, Inc.© 1997 Prentice-Hall, Inc.
Learning ObjectivesLearning Objectives
Define statisticsDefine statistics
Distinguish descriptive & inferentialDistinguish descriptive & inferential
statisticsstatistics
Summarize the sources of dataSummarize the sources of data
Describe the types of data & scalesDescribe the types of data & scales
Explain the types of samplesExplain the types of samples
Describe survey process & errorsDescribe survey process & errors
1 -1 - 33
© 1997 Prentice-Hall, Inc.© 1997 Prentice-Hall, Inc.
Introduction to StatisticsIntroduction to Statistics
1 -1 - 44
© 1997 Prentice-Hall, Inc.© 1997 Prentice-Hall, Inc.
What Is Statistics?What Is Statistics?
Collecting dataCollecting data
e.g., Surveye.g., Survey
Presenting dataPresenting data
e.g., Charts &e.g., Charts &
tablestables
CharacterizingCharacterizing
datadata
e.g., Averagee.g., Average
1 -1 - 55
© 1997 Prentice-Hall, Inc.© 1997 Prentice-Hall, Inc.
What Is Statistics?What Is Statistics?
Collecting dataCollecting data
e.g., Surveye.g., Survey
Presenting dataPresenting data
e.g., Charts &e.g., Charts &
tablestables
CharacterizingCharacterizing
datadata
e.g., Averagee.g., Average
DataData
AnalysisAnalysis
Why?Why?
© 1984-1994 T/Maker Co.
1 -1 - 66
© 1997 Prentice-Hall, Inc.© 1997 Prentice-Hall, Inc.
What Is Statistics?What Is Statistics?
Collecting dataCollecting data
e.g., Surveye.g., Survey
Presenting dataPresenting data
e.g., Charts &e.g., Charts &
tablestables
CharacterizingCharacterizing
datadata
e.g., Averagee.g., Average
DataData
AnalysisAnalysis
Decision-Decision-
MakingMaking
© 1984-1994 T/Maker Co.
© 1984-1994
T/Maker Co.
Why?Why?
1 -1 - 77
© 1997 Prentice-Hall, Inc.© 1997 Prentice-Hall, Inc.
Application AreasApplication Areas
AccountingAccounting
AuditingAuditing
CostingCosting
FinanceFinance
Financial trendsFinancial trends
ForecastingForecasting
ManagementManagement
Describe employeesDescribe employees
Quality improvementQuality improvement
MarketingMarketing
Consumer preferencesConsumer preferences
Marketing mix effectsMarketing mix effects
1 -1 - 88
© 1997 Prentice-Hall, Inc.© 1997 Prentice-Hall, Inc.
Statistical MethodsStatistical Methods
1 -1 - 99
© 1997 Prentice-Hall, Inc.© 1997 Prentice-Hall, Inc.
Statistical MethodsStatistical Methods
Statistical
Methods
Descriptive
Statistics
Inferential
Statistics
1 -1 - 1010
© 1997 Prentice-Hall, Inc.© 1997 Prentice-Hall, Inc.
Descriptive StatisticsDescriptive Statistics
InvolvesInvolves
Collecting dataCollecting data
Presenting dataPresenting data
CharacterizingCharacterizing
datadata
PurposePurpose
Describe dataDescribe data
1 -1 - 1111
© 1997 Prentice-Hall, Inc.© 1997 Prentice-Hall, Inc.
Descriptive StatisticsDescriptive Statistics
InvolvesInvolves
Collecting dataCollecting data
Presenting dataPresenting data
CharacterizingCharacterizing
datadata
PurposePurpose
Describe dataDescribe data
X = 30.5 SX = 30.5 S22
= 113= 113
0
25
50
Q1 Q2 Q3 Q4
$
1 -1 - 1212
© 1997 Prentice-Hall, Inc.© 1997 Prentice-Hall, Inc.
Inferential StatisticsInferential Statistics
InvolvesInvolves
EstimationEstimation
HypothesisHypothesis
testingtesting
PurposePurpose
Make decisionsMake decisions
about populationabout population
characteristicscharacteristics
Population?Population?
1 -1 - 1313
© 1997 Prentice-Hall, Inc.© 1997 Prentice-Hall, Inc.
Population (universe)Population (universe)
All items of interestAll items of interest
SampleSample
Portion of populationPortion of population
ParameterParameter
Summary measure about populationSummary measure about population
StatisticStatistic
Summary measure about sampleSummary measure about sample
Key TermsKey Terms
1 -1 - 1414
© 1997 Prentice-Hall, Inc.© 1997 Prentice-Hall, Inc.
Population (universe)Population (universe)
All items of interestAll items of interest
SampleSample
Portion of populationPortion of population
ParameterParameter
Summary measure about populationSummary measure about population
StatisticStatistic
Summary measure about sampleSummary measure about sample
Key TermsKey Terms
• PP inin PPopulationopulation
&& PParameterarameter
• SS inin SSampleample
&& SStatistictatistic
1 -1 - 1515
© 1997 Prentice-Hall, Inc.© 1997 Prentice-Hall, Inc.
Statistical StudiesStatistical Studies
1 -1 - 1616
© 1997 Prentice-Hall, Inc.© 1997 Prentice-Hall, Inc.
Statistical StudiesStatistical Studies
Statistical
Studies
Enumerative
Study
Analytical
Study
1 -1 - 1717
© 1997 Prentice-Hall, Inc.© 1997 Prentice-Hall, Inc.
Enumerative StudyEnumerative Study
Involves decisionInvolves decision
making about amaking about a
populationpopulation
Frame is listing ofFrame is listing of
all population unitsall population units
Example:Example:
Names inNames in
telephone booktelephone book
Example: PoliticalExample: Political
pollpoll
1 -1 - 1818
© 1997 Prentice-Hall, Inc.© 1997 Prentice-Hall, Inc.
Analytical StudyAnalytical Study
Involves action onInvolves action on
a processa process
Improves futureImproves future
performanceperformance
No identifiableNo identifiable
universe or frameuniverse or frame
e.g., Productione.g., Production
processprocess
1 -1 - 1919
© 1997 Prentice-Hall, Inc.© 1997 Prentice-Hall, Inc.
Analytical StudyAnalytical Study
Involves action onInvolves action on
a processa process
Improves futureImproves future
performanceperformance
No identifiableNo identifiable
universe or frameuniverse or frame
e.g., Productione.g., Production
processprocess
Goods
Services
Product
Focused
Process
Focused
People
Equip-
ment
Material
Infor-
mation
OutputProcessInput
Feedback
1 -1 - 2020
© 1997 Prentice-Hall, Inc.© 1997 Prentice-Hall, Inc.
DataData
1 -1 - 2121
© 1997 Prentice-Hall, Inc.© 1997 Prentice-Hall, Inc.
Why Collect Data?Why Collect Data?
Obtain input to a research studyObtain input to a research study
Measure performanceMeasure performance
Assist in formulating decisionAssist in formulating decision
alternativesalternatives
Satisfy curiositySatisfy curiosity
Knowledge for the sake of knowledgeKnowledge for the sake of knowledge
1 -1 - 2222
© 1997 Prentice-Hall, Inc.© 1997 Prentice-Hall, Inc.
Data TypesData Types
Data
Numerical
(Quantitative)
Categorical
(Qualitative)
Discrete Continuous
1 -1 - 2323
© 1997 Prentice-Hall, Inc.© 1997 Prentice-Hall, Inc.
Data Type ExamplesData Type Examples
NumericalNumerical
DiscreteDiscrete
To how many magazines do you subscribeTo how many magazines do you subscribe
currently? ___ (Number)currently? ___ (Number)
ContinuousContinuous
How tall are you? ___ (Inches)How tall are you? ___ (Inches)
CategoricalCategorical
Do you own savings bonds? __ Yes __ NoDo you own savings bonds? __ Yes __ No
1 -1 - 2424
© 1997 Prentice-Hall, Inc.© 1997 Prentice-Hall, Inc.
How Are Data Measured?How Are Data Measured?
Nominal scaleNominal scale
CategoriesCategories
e.g., Male-femalee.g., Male-female
CountCount
Ordinal scaleOrdinal scale
CategoriesCategories
Ordering impliedOrdering implied
e.g., High-lowe.g., High-low
CountCount
1 -1 - 2525
© 1997 Prentice-Hall, Inc.© 1997 Prentice-Hall, Inc.
Interval scaleInterval scale
Equal intervalsEqual intervals
No true 0No true 0
e.g., Degrees Celsiuse.g., Degrees Celsius
MeasurementMeasurement
Ratio scaleRatio scale
Equal intervalsEqual intervals
True 0True 0
Meaningful ratiosMeaningful ratios
e.g., Height in inchese.g., Height in inches
How Are Data Measured?How Are Data Measured?
Nominal scaleNominal scale
CategoriesCategories
e.g., Male-femalee.g., Male-female
CountCount
Ordinal scaleOrdinal scale
CategoriesCategories
Ordering impliedOrdering implied
e.g., High-lowe.g., High-low
CountCount
1 -1 - 2626
© 1997 Prentice-Hall, Inc.© 1997 Prentice-Hall, Inc.
Are they categorical? NumericalAre they categorical? Numerical
(discrete or continuous)? What scale?(discrete or continuous)? What scale?
Thinking ChallengeThinking Challenge
GenderGender
Male, femaleMale, female
WeightWeight
123, 140.2 etc.123, 140.2 etc.
Auto speedAuto speed
78, 64, 45 etc.78, 64, 45 etc.
TemperatureTemperature
78, 64, 85 etc.78, 64, 85 etc.
# Siblings# Siblings
0-2, 3-5, 6+0-2, 3-5, 6+
Letter gradeLetter grade
A, B, C etc.A, B, C etc.
AloneAlone GroupGroup ClassClass
1 -1 - 2727
© 1997 Prentice-Hall, Inc.© 1997 Prentice-Hall, Inc.
Data SourcesData Sources
Data
Sources
Primary Secondary
Experiment Published
(& On-Line)
Survey Observation
1 -1 - 2828
© 1997 Prentice-Hall, Inc.© 1997 Prentice-Hall, Inc.
SurveysSurveys
1 -1 - 2929
© 1997 Prentice-Hall, Inc.© 1997 Prentice-Hall, Inc.
Survey StepsSurvey Steps
Define purposeDefine purpose
DesignDesign
questionnairequestionnaire
Select sampleSelect sample
designdesign
Sample typeSample type
Sample sizeSample size
1 -1 - 3030
© 1997 Prentice-Hall, Inc.© 1997 Prentice-Hall, Inc.
Collect dataCollect data
(field work)(field work)
Prepare dataPrepare data
EditEdit
CodeCode
Analyze dataAnalyze data
Interpret findingsInterpret findings
Report resultsReport results
Define purposeDefine purpose
DesignDesign
questionnairequestionnaire
Select sampleSelect sample
designdesign
Sample typeSample type
Sample sizeSample size
Survey StepsSurvey Steps
1 -1 - 3131
© 1997 Prentice-Hall, Inc.© 1997 Prentice-Hall, Inc.
Questionnaire DesignQuestionnaire Design
Question contentQuestion content
Mode of responseMode of response
Question wordingQuestion wording
Question sequenceQuestion sequence
LayoutLayout
Pilot testingPilot testing
© 1984-1994 T/Maker Co.
1 -1 - 3232
© 1997 Prentice-Hall, Inc.© 1997 Prentice-Hall, Inc.
SamplesSamples
1 -1 - 3333
© 1997 Prentice-Hall, Inc.© 1997 Prentice-Hall, Inc.
Why Sample?Why Sample?
Destruction of testDestruction of test
unitsunits
Quality controlQuality control
Accurate &Accurate &
reliable resultsreliable results
Pragmatic reasonsPragmatic reasons
TimeTime
CostCost
1 -1 - 3434
© 1997 Prentice-Hall, Inc.© 1997 Prentice-Hall, Inc.
Types of SamplesTypes of Samples
Typeof
Sample
Probability
Non
Probability
Simple
Random
StratifiedSystematic Cluster
Chunk
Judg-
ment
Quota
1 -1 - 3535
© 1997 Prentice-Hall, Inc.© 1997 Prentice-Hall, Inc.
Simple Random SampleSimple Random Sample
1 -1 - 3636
© 1997 Prentice-Hall, Inc.© 1997 Prentice-Hall, Inc.
Types of SamplesTypes of Samples
Typeof
Sample
Probability
Non
Probability
Simple
Random
StratifiedSystematic Cluster
Chunk
Judg-
ment
Quota
1 -1 - 3737
© 1997 Prentice-Hall, Inc.© 1997 Prentice-Hall, Inc.
SimpleSimple
Random SampleRandom Sample
Each population elementEach population element
has anhas an equal chanceequal chance ofof
being selectedbeing selected
Selecting 1 subject doesSelecting 1 subject does
not affect selectingnot affect selecting
othersothers
May use random numberMay use random number
table, lottery, ‘fish bowl’table, lottery, ‘fish bowl’
© 1984-1994
T/Maker Co.
1 -1 - 3838
© 1997 Prentice-Hall, Inc.© 1997 Prentice-Hall, Inc.
Random Number TableRandom Number Table
Column
00000 00001 11111 11111
Row 12345 67890 12345 67890
01 49280 88924 35779 00283
02 61870 41657 07468 08612
03 43898 65923 25078 86129
1 -1 - 3939
© 1997 Prentice-Hall, Inc.© 1997 Prentice-Hall, Inc.
Systematic SampleSystematic Sample
1 -1 - 4040
© 1997 Prentice-Hall, Inc.© 1997 Prentice-Hall, Inc.
Types of SamplesTypes of Samples
Typeof
Sample
Probability
Non
Probability
Simple
Random
StratifiedSystematic Cluster
Chunk
Judg-
ment
Quota
1 -1 - 4141
© 1997 Prentice-Hall, Inc.© 1997 Prentice-Hall, Inc.
Systematic SampleSystematic Sample
EveryEvery kkth element Isth element Is
selected after aselected after a
random start withinrandom start within
the firstthe first kk elementselements
Skip interval,Skip interval, kk, is, is
Population sizePopulation size
Sample sizeSample size
Used in telephoneUsed in telephone
surveyssurveys © 1984-1994 T/Maker Co.
1 -1 - 4242
© 1997 Prentice-Hall, Inc.© 1997 Prentice-Hall, Inc.
Stratified SampleStratified Sample
1 -1 - 4343
© 1997 Prentice-Hall, Inc.© 1997 Prentice-Hall, Inc.
Types of SamplesTypes of Samples
Typeof
Sample
Probability
Non
Probability
Simple
Random
StratifiedSystematic Cluster
Chunk
Judg-
ment
Quota
1 -1 - 4444
© 1997 Prentice-Hall, Inc.© 1997 Prentice-Hall, Inc.
Stratified SampleStratified Sample
Divide population intoDivide population into
subgroupssubgroups
Mutually exclusiveMutually exclusive
ExhaustiveExhaustive
At least 1 commonAt least 1 common
characteristic ofcharacteristic of
interestinterest
Select simple randomSelect simple random
samples fromsamples from
subgroupssubgroups
All StudentsAll Students
CommuterCommuter
ss
ResidentsResidents
SampleSample
1 -1 - 4545
© 1997 Prentice-Hall, Inc.© 1997 Prentice-Hall, Inc.
Cluster SampleCluster Sample
1 -1 - 4646
© 1997 Prentice-Hall, Inc.© 1997 Prentice-Hall, Inc.
Types of SamplesTypes of Samples
Typeof
Sample
Probability
Non
Probability
Simple
Random
StratifiedSystematic Cluster
Chunk
Judg-
ment
Quota
1 -1 - 4747
© 1997 Prentice-Hall, Inc.© 1997 Prentice-Hall, Inc.
Cluster SampleCluster Sample
Divide populationDivide population
into clustersinto clusters
If managersIf managers
are elements thenare elements then
companies are clusterscompanies are clusters
Select clustersSelect clusters
randomlyrandomly
Survey all or a randomSurvey all or a random
sample of elements insample of elements in
clustercluster
Companies (Clusters)Companies (Clusters)
SampleSample
1 -1 - 4848
© 1997 Prentice-Hall, Inc.© 1997 Prentice-Hall, Inc.
Nonprobability SamplesNonprobability Samples
1 -1 - 4949
© 1997 Prentice-Hall, Inc.© 1997 Prentice-Hall, Inc.
Types of SamplesTypes of Samples
Typeof
Sample
Probability
Non
Probability
Simple
Random
StratifiedSystematic Cluster
Chunk
Judg-
ment
Quota
1 -1 - 5050
© 1997 Prentice-Hall, Inc.© 1997 Prentice-Hall, Inc.
Nonprobability SamplesNonprobability Samples
JudgmentJudgment
Use experience to select sampleUse experience to select sample
Example: Test marketsExample: Test markets
QuotaQuota
Similar to stratified samplingSimilar to stratified sampling
except no random samplingexcept no random sampling
Chunk (convenience)Chunk (convenience)
Use elements most availableUse elements most available
1 -1 - 5151
© 1997 Prentice-Hall, Inc.© 1997 Prentice-Hall, Inc.
Errors Due to SamplingErrors Due to Sampling
TotalPopulation
(Students)
SampleFrame
(Students in
PhoneBook)
PlannedSample
(SelectedStudents)
Actual
Sample
Coverage(Frame)Error
SamplingError
Nonresponse&
MeasurementError
1 -1 - 5252
© 1997 Prentice-Hall, Inc.© 1997 Prentice-Hall, Inc.
ConclusionConclusion
Defined statisticsDefined statistics
Distinguished descriptive &Distinguished descriptive &
inferential statisticsinferential statistics
Summarized the sources of dataSummarized the sources of data
Described the types of data & scalesDescribed the types of data & scales
Explained the types of samplesExplained the types of samples
Described survey process & errorsDescribed survey process & errors
Source: www.uic.edu/classes/idsc/ids531/lbsppt/chap01.ppt

More Related Content

What's hot

Descriptive Statistics, Numerical Description
Descriptive Statistics, Numerical DescriptionDescriptive Statistics, Numerical Description
Descriptive Statistics, Numerical Description
getyourcheaton
 
Regression analysis on SPSS
Regression analysis on SPSSRegression analysis on SPSS
Regression analysis on SPSS
AntimDevMishraMTechE
 
Normal distribution
Normal distribution Normal distribution
Normal distribution
NoorulainRazzaq
 
Correlation and regression
Correlation and regressionCorrelation and regression
Correlation and regression
Mohit Asija
 
Probability Theory
Probability Theory Probability Theory
Probability Theory
Anthony J. Evans
 
Data Analysis
Data AnalysisData Analysis
Data Analysis
Smriti Arora
 
Statistical Estimation
Statistical Estimation Statistical Estimation
Statistical Estimation
Remyagharishs
 
Basic Statistics & Data Analysis
Basic Statistics & Data AnalysisBasic Statistics & Data Analysis
Basic Statistics & Data Analysis
Ajendra Sharma
 
Two-sample Hypothesis Tests
Two-sample Hypothesis Tests Two-sample Hypothesis Tests
Two-sample Hypothesis Tests
mgbardossy
 
Normal distribution
Normal distributionNormal distribution
Normal distribution
Global Polis
 
PG STAT 531 Lecture 5 Probability Distribution
PG STAT 531 Lecture 5 Probability DistributionPG STAT 531 Lecture 5 Probability Distribution
PG STAT 531 Lecture 5 Probability Distribution
Aashish Patel
 
Multiple regression presentation
Multiple regression presentationMultiple regression presentation
Multiple regression presentationCarlo Magno
 
Parametric vs Non-Parametric
Parametric vs Non-ParametricParametric vs Non-Parametric
Parametric vs Non-Parametric
Aniruddha Deshmukh
 
Chap03 probability
Chap03 probabilityChap03 probability
Chap03 probability
Judianto Nugroho
 
Descriptive statistics
Descriptive statisticsDescriptive statistics
Descriptive statistics
Anand Thokal
 

What's hot (20)

Descriptive Statistics, Numerical Description
Descriptive Statistics, Numerical DescriptionDescriptive Statistics, Numerical Description
Descriptive Statistics, Numerical Description
 
Regression analysis on SPSS
Regression analysis on SPSSRegression analysis on SPSS
Regression analysis on SPSS
 
Normal distribution
Normal distribution Normal distribution
Normal distribution
 
Probability concept and Probability distribution
Probability concept and Probability distributionProbability concept and Probability distribution
Probability concept and Probability distribution
 
Correlation continued
Correlation continuedCorrelation continued
Correlation continued
 
Hypothesis Testing
Hypothesis TestingHypothesis Testing
Hypothesis Testing
 
Correlation and regression
Correlation and regressionCorrelation and regression
Correlation and regression
 
Probability Theory
Probability Theory Probability Theory
Probability Theory
 
Data Analysis
Data AnalysisData Analysis
Data Analysis
 
Statistical Estimation
Statistical Estimation Statistical Estimation
Statistical Estimation
 
Basic Statistics & Data Analysis
Basic Statistics & Data AnalysisBasic Statistics & Data Analysis
Basic Statistics & Data Analysis
 
Two-sample Hypothesis Tests
Two-sample Hypothesis Tests Two-sample Hypothesis Tests
Two-sample Hypothesis Tests
 
Goodness of fit (ppt)
Goodness of fit (ppt)Goodness of fit (ppt)
Goodness of fit (ppt)
 
Correlation and Simple Regression
Correlation  and Simple RegressionCorrelation  and Simple Regression
Correlation and Simple Regression
 
Normal distribution
Normal distributionNormal distribution
Normal distribution
 
PG STAT 531 Lecture 5 Probability Distribution
PG STAT 531 Lecture 5 Probability DistributionPG STAT 531 Lecture 5 Probability Distribution
PG STAT 531 Lecture 5 Probability Distribution
 
Multiple regression presentation
Multiple regression presentationMultiple regression presentation
Multiple regression presentation
 
Parametric vs Non-Parametric
Parametric vs Non-ParametricParametric vs Non-Parametric
Parametric vs Non-Parametric
 
Chap03 probability
Chap03 probabilityChap03 probability
Chap03 probability
 
Descriptive statistics
Descriptive statisticsDescriptive statistics
Descriptive statistics
 

Similar to Statistics for Managers Using Microsoft Excel

Essential Data Science for Product Designers and Non-Scientists
Essential Data Science for Product Designers and Non-ScientistsEssential Data Science for Product Designers and Non-Scientists
Essential Data Science for Product Designers and Non-Scientists
James Christopher
 
ASMD 2022 for class.pptx
ASMD 2022 for class.pptxASMD 2022 for class.pptx
ASMD 2022 for class.pptx
MahekSinghania2
 
Data Analytics Day 1.pptx
Data Analytics Day 1.pptxData Analytics Day 1.pptx
Data Analytics Day 1.pptx
NicoleMarieAngelikaG
 
Forecasting Slides
Forecasting SlidesForecasting Slides
Forecasting Slidesknksmart
 
Introduction to statistics 1
Introduction to statistics 1Introduction to statistics 1
Introduction to statistics 1
Anwar Afridi
 
Operations Management
Operations ManagementOperations Management
Operations Management
Ivy Española
 
Heizer chapter 01
Heizer chapter 01 Heizer chapter 01
Heizer chapter 01
Alina Zulfiqar
 
Data Analytics .pptx
Data Analytics .pptxData Analytics .pptx
Data Analytics .pptx
nagarajan740445
 
What is analytics
What is analyticsWhat is analytics
What is analytics
shweta saxena
 
Forcasting
ForcastingForcasting
Forcasting
Bharti Kumari
 
Gathering Information and Measuring Market Demand
Gathering Information and Measuring Market DemandGathering Information and Measuring Market Demand
Gathering Information and Measuring Market DemandCarlo Muyot
 
Five Pitfalls when Operationalizing Data Science and a Strategy for Success
Five Pitfalls when Operationalizing Data Science and a Strategy for SuccessFive Pitfalls when Operationalizing Data Science and a Strategy for Success
Five Pitfalls when Operationalizing Data Science and a Strategy for Success
VMware Tanzu
 
Data Analytics Business Intelligence
Data Analytics Business IntelligenceData Analytics Business Intelligence
Data Analytics Business Intelligence
Ravikanth-BA
 
Business Analytics-1.pdf
Business Analytics-1.pdfBusiness Analytics-1.pdf
Business Analytics-1.pdf
NaramsettiVamsi
 
Ais Romney 2006 Slides 01 Overview
Ais Romney 2006 Slides 01 OverviewAis Romney 2006 Slides 01 Overview
Ais Romney 2006 Slides 01 Overview
Sharing Slides Training
 
Advanced IT Analytics: A Look at Real Adoptions in the Real World
Advanced IT Analytics: A Look at Real Adoptions in the Real WorldAdvanced IT Analytics: A Look at Real Adoptions in the Real World
Advanced IT Analytics: A Look at Real Adoptions in the Real World
Enterprise Management Associates
 
The t Test for Related.docx
The t Test for Related.docxThe t Test for Related.docx
The t Test for Related.docx
christalgrieg
 
Sia an overview
Sia an overviewSia an overview
Sia an overview
wayanggi
 
JF608: Quality Control - Unit 1
JF608: Quality Control - Unit 1JF608: Quality Control - Unit 1
JF608: Quality Control - Unit 1
Asraf Malik
 
introductiontobusinessstatistics-anitha.pptx
introductiontobusinessstatistics-anitha.pptxintroductiontobusinessstatistics-anitha.pptx
introductiontobusinessstatistics-anitha.pptx
voore ajay
 

Similar to Statistics for Managers Using Microsoft Excel (20)

Essential Data Science for Product Designers and Non-Scientists
Essential Data Science for Product Designers and Non-ScientistsEssential Data Science for Product Designers and Non-Scientists
Essential Data Science for Product Designers and Non-Scientists
 
ASMD 2022 for class.pptx
ASMD 2022 for class.pptxASMD 2022 for class.pptx
ASMD 2022 for class.pptx
 
Data Analytics Day 1.pptx
Data Analytics Day 1.pptxData Analytics Day 1.pptx
Data Analytics Day 1.pptx
 
Forecasting Slides
Forecasting SlidesForecasting Slides
Forecasting Slides
 
Introduction to statistics 1
Introduction to statistics 1Introduction to statistics 1
Introduction to statistics 1
 
Operations Management
Operations ManagementOperations Management
Operations Management
 
Heizer chapter 01
Heizer chapter 01 Heizer chapter 01
Heizer chapter 01
 
Data Analytics .pptx
Data Analytics .pptxData Analytics .pptx
Data Analytics .pptx
 
What is analytics
What is analyticsWhat is analytics
What is analytics
 
Forcasting
ForcastingForcasting
Forcasting
 
Gathering Information and Measuring Market Demand
Gathering Information and Measuring Market DemandGathering Information and Measuring Market Demand
Gathering Information and Measuring Market Demand
 
Five Pitfalls when Operationalizing Data Science and a Strategy for Success
Five Pitfalls when Operationalizing Data Science and a Strategy for SuccessFive Pitfalls when Operationalizing Data Science and a Strategy for Success
Five Pitfalls when Operationalizing Data Science and a Strategy for Success
 
Data Analytics Business Intelligence
Data Analytics Business IntelligenceData Analytics Business Intelligence
Data Analytics Business Intelligence
 
Business Analytics-1.pdf
Business Analytics-1.pdfBusiness Analytics-1.pdf
Business Analytics-1.pdf
 
Ais Romney 2006 Slides 01 Overview
Ais Romney 2006 Slides 01 OverviewAis Romney 2006 Slides 01 Overview
Ais Romney 2006 Slides 01 Overview
 
Advanced IT Analytics: A Look at Real Adoptions in the Real World
Advanced IT Analytics: A Look at Real Adoptions in the Real WorldAdvanced IT Analytics: A Look at Real Adoptions in the Real World
Advanced IT Analytics: A Look at Real Adoptions in the Real World
 
The t Test for Related.docx
The t Test for Related.docxThe t Test for Related.docx
The t Test for Related.docx
 
Sia an overview
Sia an overviewSia an overview
Sia an overview
 
JF608: Quality Control - Unit 1
JF608: Quality Control - Unit 1JF608: Quality Control - Unit 1
JF608: Quality Control - Unit 1
 
introductiontobusinessstatistics-anitha.pptx
introductiontobusinessstatistics-anitha.pptxintroductiontobusinessstatistics-anitha.pptx
introductiontobusinessstatistics-anitha.pptx
 

Recently uploaded

SOCRadar Germany 2024 Threat Landscape Report
SOCRadar Germany 2024 Threat Landscape ReportSOCRadar Germany 2024 Threat Landscape Report
SOCRadar Germany 2024 Threat Landscape Report
SOCRadar
 
Innovative Methods in Media and Communication Research by Sebastian Kubitschk...
Innovative Methods in Media and Communication Research by Sebastian Kubitschk...Innovative Methods in Media and Communication Research by Sebastian Kubitschk...
Innovative Methods in Media and Communication Research by Sebastian Kubitschk...
correoyaya
 
Q1’2024 Update: MYCI’s Leap Year Rebound
Q1’2024 Update: MYCI’s Leap Year ReboundQ1’2024 Update: MYCI’s Leap Year Rebound
Q1’2024 Update: MYCI’s Leap Year Rebound
Oppotus
 
The affect of service quality and online reviews on customer loyalty in the E...
The affect of service quality and online reviews on customer loyalty in the E...The affect of service quality and online reviews on customer loyalty in the E...
The affect of service quality and online reviews on customer loyalty in the E...
jerlynmaetalle
 
standardisation of garbhpala offhgfffghh
standardisation of garbhpala offhgfffghhstandardisation of garbhpala offhgfffghh
standardisation of garbhpala offhgfffghh
ArpitMalhotra16
 
一比一原版(NYU毕业证)纽约大学毕业证成绩单
一比一原版(NYU毕业证)纽约大学毕业证成绩单一比一原版(NYU毕业证)纽约大学毕业证成绩单
一比一原版(NYU毕业证)纽约大学毕业证成绩单
ewymefz
 
FP Growth Algorithm and its Applications
FP Growth Algorithm and its ApplicationsFP Growth Algorithm and its Applications
FP Growth Algorithm and its Applications
MaleehaSheikh2
 
一比一原版(CU毕业证)卡尔顿大学毕业证成绩单
一比一原版(CU毕业证)卡尔顿大学毕业证成绩单一比一原版(CU毕业证)卡尔顿大学毕业证成绩单
一比一原版(CU毕业证)卡尔顿大学毕业证成绩单
yhkoc
 
Predicting Product Ad Campaign Performance: A Data Analysis Project Presentation
Predicting Product Ad Campaign Performance: A Data Analysis Project PresentationPredicting Product Ad Campaign Performance: A Data Analysis Project Presentation
Predicting Product Ad Campaign Performance: A Data Analysis Project Presentation
Boston Institute of Analytics
 
Business update Q1 2024 Lar España Real Estate SOCIMI
Business update Q1 2024 Lar España Real Estate SOCIMIBusiness update Q1 2024 Lar España Real Estate SOCIMI
Business update Q1 2024 Lar España Real Estate SOCIMI
AlejandraGmez176757
 
1.Seydhcuxhxyxhccuuxuxyxyxmisolids 2019.pptx
1.Seydhcuxhxyxhccuuxuxyxyxmisolids 2019.pptx1.Seydhcuxhxyxhccuuxuxyxyxmisolids 2019.pptx
1.Seydhcuxhxyxhccuuxuxyxyxmisolids 2019.pptx
Tiktokethiodaily
 
一比一原版(CBU毕业证)不列颠海角大学毕业证成绩单
一比一原版(CBU毕业证)不列颠海角大学毕业证成绩单一比一原版(CBU毕业证)不列颠海角大学毕业证成绩单
一比一原版(CBU毕业证)不列颠海角大学毕业证成绩单
nscud
 
一比一原版(TWU毕业证)西三一大学毕业证成绩单
一比一原版(TWU毕业证)西三一大学毕业证成绩单一比一原版(TWU毕业证)西三一大学毕业证成绩单
一比一原版(TWU毕业证)西三一大学毕业证成绩单
ocavb
 
Algorithmic optimizations for Dynamic Levelwise PageRank (from STICD) : SHORT...
Algorithmic optimizations for Dynamic Levelwise PageRank (from STICD) : SHORT...Algorithmic optimizations for Dynamic Levelwise PageRank (from STICD) : SHORT...
Algorithmic optimizations for Dynamic Levelwise PageRank (from STICD) : SHORT...
Subhajit Sahu
 
一比一原版(YU毕业证)约克大学毕业证成绩单
一比一原版(YU毕业证)约克大学毕业证成绩单一比一原版(YU毕业证)约克大学毕业证成绩单
一比一原版(YU毕业证)约克大学毕业证成绩单
enxupq
 
一比一原版(QU毕业证)皇后大学毕业证成绩单
一比一原版(QU毕业证)皇后大学毕业证成绩单一比一原版(QU毕业证)皇后大学毕业证成绩单
一比一原版(QU毕业证)皇后大学毕业证成绩单
enxupq
 
Chatty Kathy - UNC Bootcamp Final Project Presentation - Final Version - 5.23...
Chatty Kathy - UNC Bootcamp Final Project Presentation - Final Version - 5.23...Chatty Kathy - UNC Bootcamp Final Project Presentation - Final Version - 5.23...
Chatty Kathy - UNC Bootcamp Final Project Presentation - Final Version - 5.23...
John Andrews
 
Sample_Global Non-invasive Prenatal Testing (NIPT) Market, 2019-2030.pdf
Sample_Global Non-invasive Prenatal Testing (NIPT) Market, 2019-2030.pdfSample_Global Non-invasive Prenatal Testing (NIPT) Market, 2019-2030.pdf
Sample_Global Non-invasive Prenatal Testing (NIPT) Market, 2019-2030.pdf
Linda486226
 
Tabula.io Cheatsheet: automate your data workflows
Tabula.io Cheatsheet: automate your data workflowsTabula.io Cheatsheet: automate your data workflows
Tabula.io Cheatsheet: automate your data workflows
alex933524
 
一比一原版(CBU毕业证)卡普顿大学毕业证成绩单
一比一原版(CBU毕业证)卡普顿大学毕业证成绩单一比一原版(CBU毕业证)卡普顿大学毕业证成绩单
一比一原版(CBU毕业证)卡普顿大学毕业证成绩单
nscud
 

Recently uploaded (20)

SOCRadar Germany 2024 Threat Landscape Report
SOCRadar Germany 2024 Threat Landscape ReportSOCRadar Germany 2024 Threat Landscape Report
SOCRadar Germany 2024 Threat Landscape Report
 
Innovative Methods in Media and Communication Research by Sebastian Kubitschk...
Innovative Methods in Media and Communication Research by Sebastian Kubitschk...Innovative Methods in Media and Communication Research by Sebastian Kubitschk...
Innovative Methods in Media and Communication Research by Sebastian Kubitschk...
 
Q1’2024 Update: MYCI’s Leap Year Rebound
Q1’2024 Update: MYCI’s Leap Year ReboundQ1’2024 Update: MYCI’s Leap Year Rebound
Q1’2024 Update: MYCI’s Leap Year Rebound
 
The affect of service quality and online reviews on customer loyalty in the E...
The affect of service quality and online reviews on customer loyalty in the E...The affect of service quality and online reviews on customer loyalty in the E...
The affect of service quality and online reviews on customer loyalty in the E...
 
standardisation of garbhpala offhgfffghh
standardisation of garbhpala offhgfffghhstandardisation of garbhpala offhgfffghh
standardisation of garbhpala offhgfffghh
 
一比一原版(NYU毕业证)纽约大学毕业证成绩单
一比一原版(NYU毕业证)纽约大学毕业证成绩单一比一原版(NYU毕业证)纽约大学毕业证成绩单
一比一原版(NYU毕业证)纽约大学毕业证成绩单
 
FP Growth Algorithm and its Applications
FP Growth Algorithm and its ApplicationsFP Growth Algorithm and its Applications
FP Growth Algorithm and its Applications
 
一比一原版(CU毕业证)卡尔顿大学毕业证成绩单
一比一原版(CU毕业证)卡尔顿大学毕业证成绩单一比一原版(CU毕业证)卡尔顿大学毕业证成绩单
一比一原版(CU毕业证)卡尔顿大学毕业证成绩单
 
Predicting Product Ad Campaign Performance: A Data Analysis Project Presentation
Predicting Product Ad Campaign Performance: A Data Analysis Project PresentationPredicting Product Ad Campaign Performance: A Data Analysis Project Presentation
Predicting Product Ad Campaign Performance: A Data Analysis Project Presentation
 
Business update Q1 2024 Lar España Real Estate SOCIMI
Business update Q1 2024 Lar España Real Estate SOCIMIBusiness update Q1 2024 Lar España Real Estate SOCIMI
Business update Q1 2024 Lar España Real Estate SOCIMI
 
1.Seydhcuxhxyxhccuuxuxyxyxmisolids 2019.pptx
1.Seydhcuxhxyxhccuuxuxyxyxmisolids 2019.pptx1.Seydhcuxhxyxhccuuxuxyxyxmisolids 2019.pptx
1.Seydhcuxhxyxhccuuxuxyxyxmisolids 2019.pptx
 
一比一原版(CBU毕业证)不列颠海角大学毕业证成绩单
一比一原版(CBU毕业证)不列颠海角大学毕业证成绩单一比一原版(CBU毕业证)不列颠海角大学毕业证成绩单
一比一原版(CBU毕业证)不列颠海角大学毕业证成绩单
 
一比一原版(TWU毕业证)西三一大学毕业证成绩单
一比一原版(TWU毕业证)西三一大学毕业证成绩单一比一原版(TWU毕业证)西三一大学毕业证成绩单
一比一原版(TWU毕业证)西三一大学毕业证成绩单
 
Algorithmic optimizations for Dynamic Levelwise PageRank (from STICD) : SHORT...
Algorithmic optimizations for Dynamic Levelwise PageRank (from STICD) : SHORT...Algorithmic optimizations for Dynamic Levelwise PageRank (from STICD) : SHORT...
Algorithmic optimizations for Dynamic Levelwise PageRank (from STICD) : SHORT...
 
一比一原版(YU毕业证)约克大学毕业证成绩单
一比一原版(YU毕业证)约克大学毕业证成绩单一比一原版(YU毕业证)约克大学毕业证成绩单
一比一原版(YU毕业证)约克大学毕业证成绩单
 
一比一原版(QU毕业证)皇后大学毕业证成绩单
一比一原版(QU毕业证)皇后大学毕业证成绩单一比一原版(QU毕业证)皇后大学毕业证成绩单
一比一原版(QU毕业证)皇后大学毕业证成绩单
 
Chatty Kathy - UNC Bootcamp Final Project Presentation - Final Version - 5.23...
Chatty Kathy - UNC Bootcamp Final Project Presentation - Final Version - 5.23...Chatty Kathy - UNC Bootcamp Final Project Presentation - Final Version - 5.23...
Chatty Kathy - UNC Bootcamp Final Project Presentation - Final Version - 5.23...
 
Sample_Global Non-invasive Prenatal Testing (NIPT) Market, 2019-2030.pdf
Sample_Global Non-invasive Prenatal Testing (NIPT) Market, 2019-2030.pdfSample_Global Non-invasive Prenatal Testing (NIPT) Market, 2019-2030.pdf
Sample_Global Non-invasive Prenatal Testing (NIPT) Market, 2019-2030.pdf
 
Tabula.io Cheatsheet: automate your data workflows
Tabula.io Cheatsheet: automate your data workflowsTabula.io Cheatsheet: automate your data workflows
Tabula.io Cheatsheet: automate your data workflows
 
一比一原版(CBU毕业证)卡普顿大学毕业证成绩单
一比一原版(CBU毕业证)卡普顿大学毕业证成绩单一比一原版(CBU毕业证)卡普顿大学毕业证成绩单
一比一原版(CBU毕业证)卡普顿大学毕业证成绩单
 

Statistics for Managers Using Microsoft Excel

  • 1. 1 -1 - 11 © 1997 Prentice-Hall, Inc.© 1997 Prentice-Hall, Inc. Statistics for Managers UsingStatistics for Managers Using Microsoft ExcelMicrosoft Excel Introduction & Data CollectionIntroduction & Data Collection Chapter 1Chapter 1
  • 2. 1 -1 - 22 © 1997 Prentice-Hall, Inc.© 1997 Prentice-Hall, Inc. Learning ObjectivesLearning Objectives Define statisticsDefine statistics Distinguish descriptive & inferentialDistinguish descriptive & inferential statisticsstatistics Summarize the sources of dataSummarize the sources of data Describe the types of data & scalesDescribe the types of data & scales Explain the types of samplesExplain the types of samples Describe survey process & errorsDescribe survey process & errors
  • 3. 1 -1 - 33 © 1997 Prentice-Hall, Inc.© 1997 Prentice-Hall, Inc. Introduction to StatisticsIntroduction to Statistics
  • 4. 1 -1 - 44 © 1997 Prentice-Hall, Inc.© 1997 Prentice-Hall, Inc. What Is Statistics?What Is Statistics? Collecting dataCollecting data e.g., Surveye.g., Survey Presenting dataPresenting data e.g., Charts &e.g., Charts & tablestables CharacterizingCharacterizing datadata e.g., Averagee.g., Average
  • 5. 1 -1 - 55 © 1997 Prentice-Hall, Inc.© 1997 Prentice-Hall, Inc. What Is Statistics?What Is Statistics? Collecting dataCollecting data e.g., Surveye.g., Survey Presenting dataPresenting data e.g., Charts &e.g., Charts & tablestables CharacterizingCharacterizing datadata e.g., Averagee.g., Average DataData AnalysisAnalysis Why?Why? © 1984-1994 T/Maker Co.
  • 6. 1 -1 - 66 © 1997 Prentice-Hall, Inc.© 1997 Prentice-Hall, Inc. What Is Statistics?What Is Statistics? Collecting dataCollecting data e.g., Surveye.g., Survey Presenting dataPresenting data e.g., Charts &e.g., Charts & tablestables CharacterizingCharacterizing datadata e.g., Averagee.g., Average DataData AnalysisAnalysis Decision-Decision- MakingMaking © 1984-1994 T/Maker Co. © 1984-1994 T/Maker Co. Why?Why?
  • 7. 1 -1 - 77 © 1997 Prentice-Hall, Inc.© 1997 Prentice-Hall, Inc. Application AreasApplication Areas AccountingAccounting AuditingAuditing CostingCosting FinanceFinance Financial trendsFinancial trends ForecastingForecasting ManagementManagement Describe employeesDescribe employees Quality improvementQuality improvement MarketingMarketing Consumer preferencesConsumer preferences Marketing mix effectsMarketing mix effects
  • 8. 1 -1 - 88 © 1997 Prentice-Hall, Inc.© 1997 Prentice-Hall, Inc. Statistical MethodsStatistical Methods
  • 9. 1 -1 - 99 © 1997 Prentice-Hall, Inc.© 1997 Prentice-Hall, Inc. Statistical MethodsStatistical Methods Statistical Methods Descriptive Statistics Inferential Statistics
  • 10. 1 -1 - 1010 © 1997 Prentice-Hall, Inc.© 1997 Prentice-Hall, Inc. Descriptive StatisticsDescriptive Statistics InvolvesInvolves Collecting dataCollecting data Presenting dataPresenting data CharacterizingCharacterizing datadata PurposePurpose Describe dataDescribe data
  • 11. 1 -1 - 1111 © 1997 Prentice-Hall, Inc.© 1997 Prentice-Hall, Inc. Descriptive StatisticsDescriptive Statistics InvolvesInvolves Collecting dataCollecting data Presenting dataPresenting data CharacterizingCharacterizing datadata PurposePurpose Describe dataDescribe data X = 30.5 SX = 30.5 S22 = 113= 113 0 25 50 Q1 Q2 Q3 Q4 $
  • 12. 1 -1 - 1212 © 1997 Prentice-Hall, Inc.© 1997 Prentice-Hall, Inc. Inferential StatisticsInferential Statistics InvolvesInvolves EstimationEstimation HypothesisHypothesis testingtesting PurposePurpose Make decisionsMake decisions about populationabout population characteristicscharacteristics Population?Population?
  • 13. 1 -1 - 1313 © 1997 Prentice-Hall, Inc.© 1997 Prentice-Hall, Inc. Population (universe)Population (universe) All items of interestAll items of interest SampleSample Portion of populationPortion of population ParameterParameter Summary measure about populationSummary measure about population StatisticStatistic Summary measure about sampleSummary measure about sample Key TermsKey Terms
  • 14. 1 -1 - 1414 © 1997 Prentice-Hall, Inc.© 1997 Prentice-Hall, Inc. Population (universe)Population (universe) All items of interestAll items of interest SampleSample Portion of populationPortion of population ParameterParameter Summary measure about populationSummary measure about population StatisticStatistic Summary measure about sampleSummary measure about sample Key TermsKey Terms • PP inin PPopulationopulation && PParameterarameter • SS inin SSampleample && SStatistictatistic
  • 15. 1 -1 - 1515 © 1997 Prentice-Hall, Inc.© 1997 Prentice-Hall, Inc. Statistical StudiesStatistical Studies
  • 16. 1 -1 - 1616 © 1997 Prentice-Hall, Inc.© 1997 Prentice-Hall, Inc. Statistical StudiesStatistical Studies Statistical Studies Enumerative Study Analytical Study
  • 17. 1 -1 - 1717 © 1997 Prentice-Hall, Inc.© 1997 Prentice-Hall, Inc. Enumerative StudyEnumerative Study Involves decisionInvolves decision making about amaking about a populationpopulation Frame is listing ofFrame is listing of all population unitsall population units Example:Example: Names inNames in telephone booktelephone book Example: PoliticalExample: Political pollpoll
  • 18. 1 -1 - 1818 © 1997 Prentice-Hall, Inc.© 1997 Prentice-Hall, Inc. Analytical StudyAnalytical Study Involves action onInvolves action on a processa process Improves futureImproves future performanceperformance No identifiableNo identifiable universe or frameuniverse or frame e.g., Productione.g., Production processprocess
  • 19. 1 -1 - 1919 © 1997 Prentice-Hall, Inc.© 1997 Prentice-Hall, Inc. Analytical StudyAnalytical Study Involves action onInvolves action on a processa process Improves futureImproves future performanceperformance No identifiableNo identifiable universe or frameuniverse or frame e.g., Productione.g., Production processprocess Goods Services Product Focused Process Focused People Equip- ment Material Infor- mation OutputProcessInput Feedback
  • 20. 1 -1 - 2020 © 1997 Prentice-Hall, Inc.© 1997 Prentice-Hall, Inc. DataData
  • 21. 1 -1 - 2121 © 1997 Prentice-Hall, Inc.© 1997 Prentice-Hall, Inc. Why Collect Data?Why Collect Data? Obtain input to a research studyObtain input to a research study Measure performanceMeasure performance Assist in formulating decisionAssist in formulating decision alternativesalternatives Satisfy curiositySatisfy curiosity Knowledge for the sake of knowledgeKnowledge for the sake of knowledge
  • 22. 1 -1 - 2222 © 1997 Prentice-Hall, Inc.© 1997 Prentice-Hall, Inc. Data TypesData Types Data Numerical (Quantitative) Categorical (Qualitative) Discrete Continuous
  • 23. 1 -1 - 2323 © 1997 Prentice-Hall, Inc.© 1997 Prentice-Hall, Inc. Data Type ExamplesData Type Examples NumericalNumerical DiscreteDiscrete To how many magazines do you subscribeTo how many magazines do you subscribe currently? ___ (Number)currently? ___ (Number) ContinuousContinuous How tall are you? ___ (Inches)How tall are you? ___ (Inches) CategoricalCategorical Do you own savings bonds? __ Yes __ NoDo you own savings bonds? __ Yes __ No
  • 24. 1 -1 - 2424 © 1997 Prentice-Hall, Inc.© 1997 Prentice-Hall, Inc. How Are Data Measured?How Are Data Measured? Nominal scaleNominal scale CategoriesCategories e.g., Male-femalee.g., Male-female CountCount Ordinal scaleOrdinal scale CategoriesCategories Ordering impliedOrdering implied e.g., High-lowe.g., High-low CountCount
  • 25. 1 -1 - 2525 © 1997 Prentice-Hall, Inc.© 1997 Prentice-Hall, Inc. Interval scaleInterval scale Equal intervalsEqual intervals No true 0No true 0 e.g., Degrees Celsiuse.g., Degrees Celsius MeasurementMeasurement Ratio scaleRatio scale Equal intervalsEqual intervals True 0True 0 Meaningful ratiosMeaningful ratios e.g., Height in inchese.g., Height in inches How Are Data Measured?How Are Data Measured? Nominal scaleNominal scale CategoriesCategories e.g., Male-femalee.g., Male-female CountCount Ordinal scaleOrdinal scale CategoriesCategories Ordering impliedOrdering implied e.g., High-lowe.g., High-low CountCount
  • 26. 1 -1 - 2626 © 1997 Prentice-Hall, Inc.© 1997 Prentice-Hall, Inc. Are they categorical? NumericalAre they categorical? Numerical (discrete or continuous)? What scale?(discrete or continuous)? What scale? Thinking ChallengeThinking Challenge GenderGender Male, femaleMale, female WeightWeight 123, 140.2 etc.123, 140.2 etc. Auto speedAuto speed 78, 64, 45 etc.78, 64, 45 etc. TemperatureTemperature 78, 64, 85 etc.78, 64, 85 etc. # Siblings# Siblings 0-2, 3-5, 6+0-2, 3-5, 6+ Letter gradeLetter grade A, B, C etc.A, B, C etc. AloneAlone GroupGroup ClassClass
  • 27. 1 -1 - 2727 © 1997 Prentice-Hall, Inc.© 1997 Prentice-Hall, Inc. Data SourcesData Sources Data Sources Primary Secondary Experiment Published (& On-Line) Survey Observation
  • 28. 1 -1 - 2828 © 1997 Prentice-Hall, Inc.© 1997 Prentice-Hall, Inc. SurveysSurveys
  • 29. 1 -1 - 2929 © 1997 Prentice-Hall, Inc.© 1997 Prentice-Hall, Inc. Survey StepsSurvey Steps Define purposeDefine purpose DesignDesign questionnairequestionnaire Select sampleSelect sample designdesign Sample typeSample type Sample sizeSample size
  • 30. 1 -1 - 3030 © 1997 Prentice-Hall, Inc.© 1997 Prentice-Hall, Inc. Collect dataCollect data (field work)(field work) Prepare dataPrepare data EditEdit CodeCode Analyze dataAnalyze data Interpret findingsInterpret findings Report resultsReport results Define purposeDefine purpose DesignDesign questionnairequestionnaire Select sampleSelect sample designdesign Sample typeSample type Sample sizeSample size Survey StepsSurvey Steps
  • 31. 1 -1 - 3131 © 1997 Prentice-Hall, Inc.© 1997 Prentice-Hall, Inc. Questionnaire DesignQuestionnaire Design Question contentQuestion content Mode of responseMode of response Question wordingQuestion wording Question sequenceQuestion sequence LayoutLayout Pilot testingPilot testing © 1984-1994 T/Maker Co.
  • 32. 1 -1 - 3232 © 1997 Prentice-Hall, Inc.© 1997 Prentice-Hall, Inc. SamplesSamples
  • 33. 1 -1 - 3333 © 1997 Prentice-Hall, Inc.© 1997 Prentice-Hall, Inc. Why Sample?Why Sample? Destruction of testDestruction of test unitsunits Quality controlQuality control Accurate &Accurate & reliable resultsreliable results Pragmatic reasonsPragmatic reasons TimeTime CostCost
  • 34. 1 -1 - 3434 © 1997 Prentice-Hall, Inc.© 1997 Prentice-Hall, Inc. Types of SamplesTypes of Samples Typeof Sample Probability Non Probability Simple Random StratifiedSystematic Cluster Chunk Judg- ment Quota
  • 35. 1 -1 - 3535 © 1997 Prentice-Hall, Inc.© 1997 Prentice-Hall, Inc. Simple Random SampleSimple Random Sample
  • 36. 1 -1 - 3636 © 1997 Prentice-Hall, Inc.© 1997 Prentice-Hall, Inc. Types of SamplesTypes of Samples Typeof Sample Probability Non Probability Simple Random StratifiedSystematic Cluster Chunk Judg- ment Quota
  • 37. 1 -1 - 3737 © 1997 Prentice-Hall, Inc.© 1997 Prentice-Hall, Inc. SimpleSimple Random SampleRandom Sample Each population elementEach population element has anhas an equal chanceequal chance ofof being selectedbeing selected Selecting 1 subject doesSelecting 1 subject does not affect selectingnot affect selecting othersothers May use random numberMay use random number table, lottery, ‘fish bowl’table, lottery, ‘fish bowl’ © 1984-1994 T/Maker Co.
  • 38. 1 -1 - 3838 © 1997 Prentice-Hall, Inc.© 1997 Prentice-Hall, Inc. Random Number TableRandom Number Table Column 00000 00001 11111 11111 Row 12345 67890 12345 67890 01 49280 88924 35779 00283 02 61870 41657 07468 08612 03 43898 65923 25078 86129
  • 39. 1 -1 - 3939 © 1997 Prentice-Hall, Inc.© 1997 Prentice-Hall, Inc. Systematic SampleSystematic Sample
  • 40. 1 -1 - 4040 © 1997 Prentice-Hall, Inc.© 1997 Prentice-Hall, Inc. Types of SamplesTypes of Samples Typeof Sample Probability Non Probability Simple Random StratifiedSystematic Cluster Chunk Judg- ment Quota
  • 41. 1 -1 - 4141 © 1997 Prentice-Hall, Inc.© 1997 Prentice-Hall, Inc. Systematic SampleSystematic Sample EveryEvery kkth element Isth element Is selected after aselected after a random start withinrandom start within the firstthe first kk elementselements Skip interval,Skip interval, kk, is, is Population sizePopulation size Sample sizeSample size Used in telephoneUsed in telephone surveyssurveys © 1984-1994 T/Maker Co.
  • 42. 1 -1 - 4242 © 1997 Prentice-Hall, Inc.© 1997 Prentice-Hall, Inc. Stratified SampleStratified Sample
  • 43. 1 -1 - 4343 © 1997 Prentice-Hall, Inc.© 1997 Prentice-Hall, Inc. Types of SamplesTypes of Samples Typeof Sample Probability Non Probability Simple Random StratifiedSystematic Cluster Chunk Judg- ment Quota
  • 44. 1 -1 - 4444 © 1997 Prentice-Hall, Inc.© 1997 Prentice-Hall, Inc. Stratified SampleStratified Sample Divide population intoDivide population into subgroupssubgroups Mutually exclusiveMutually exclusive ExhaustiveExhaustive At least 1 commonAt least 1 common characteristic ofcharacteristic of interestinterest Select simple randomSelect simple random samples fromsamples from subgroupssubgroups All StudentsAll Students CommuterCommuter ss ResidentsResidents SampleSample
  • 45. 1 -1 - 4545 © 1997 Prentice-Hall, Inc.© 1997 Prentice-Hall, Inc. Cluster SampleCluster Sample
  • 46. 1 -1 - 4646 © 1997 Prentice-Hall, Inc.© 1997 Prentice-Hall, Inc. Types of SamplesTypes of Samples Typeof Sample Probability Non Probability Simple Random StratifiedSystematic Cluster Chunk Judg- ment Quota
  • 47. 1 -1 - 4747 © 1997 Prentice-Hall, Inc.© 1997 Prentice-Hall, Inc. Cluster SampleCluster Sample Divide populationDivide population into clustersinto clusters If managersIf managers are elements thenare elements then companies are clusterscompanies are clusters Select clustersSelect clusters randomlyrandomly Survey all or a randomSurvey all or a random sample of elements insample of elements in clustercluster Companies (Clusters)Companies (Clusters) SampleSample
  • 48. 1 -1 - 4848 © 1997 Prentice-Hall, Inc.© 1997 Prentice-Hall, Inc. Nonprobability SamplesNonprobability Samples
  • 49. 1 -1 - 4949 © 1997 Prentice-Hall, Inc.© 1997 Prentice-Hall, Inc. Types of SamplesTypes of Samples Typeof Sample Probability Non Probability Simple Random StratifiedSystematic Cluster Chunk Judg- ment Quota
  • 50. 1 -1 - 5050 © 1997 Prentice-Hall, Inc.© 1997 Prentice-Hall, Inc. Nonprobability SamplesNonprobability Samples JudgmentJudgment Use experience to select sampleUse experience to select sample Example: Test marketsExample: Test markets QuotaQuota Similar to stratified samplingSimilar to stratified sampling except no random samplingexcept no random sampling Chunk (convenience)Chunk (convenience) Use elements most availableUse elements most available
  • 51. 1 -1 - 5151 © 1997 Prentice-Hall, Inc.© 1997 Prentice-Hall, Inc. Errors Due to SamplingErrors Due to Sampling TotalPopulation (Students) SampleFrame (Students in PhoneBook) PlannedSample (SelectedStudents) Actual Sample Coverage(Frame)Error SamplingError Nonresponse& MeasurementError
  • 52. 1 -1 - 5252 © 1997 Prentice-Hall, Inc.© 1997 Prentice-Hall, Inc. ConclusionConclusion Defined statisticsDefined statistics Distinguished descriptive &Distinguished descriptive & inferential statisticsinferential statistics Summarized the sources of dataSummarized the sources of data Described the types of data & scalesDescribed the types of data & scales Explained the types of samplesExplained the types of samples Described survey process & errorsDescribed survey process & errors Source: www.uic.edu/classes/idsc/ids531/lbsppt/chap01.ppt

Editor's Notes

  1. :1, 1, 3
  2. :1, 1, 3
  3. :1, 1, 3
  4. Data facts or information that is relevant or appropriate to a decision maker Population the totality of objects under consideration Sample a portion of the population that is selected for analysis Parameter a summary measure (e.g., mean) that is computed to describe a characteristic of the population Statistic a summary measure (e.g., mean) that is computed to describe a characteristic of the sample
  5. Data facts or information that is relevant or appropriate to a decision maker Population the totality of objects under consideration Sample a portion of the population that is selected for analysis Parameter a summary measure (e.g., mean) that is computed to describe a characteristic of the population Statistic a summary measure (e.g., mean) that is computed to describe a characteristic of the sample
  6. 1. Gender = categorical - nominal 2. Weight = numerical - continuous - ratio 3. Auto Speed = numerical - continuous - ratio 4. Temperature = numerical - continuous - interval 5. # Siblings = categorical - ordinal 6. Letter Grade = categorical - ordinal
  7. Question Content Related to research purpose Based on respondent’s ability to answer accurately Response Format open-ended Vs. fixed alternative (closed-ended) Question Wording simple, clear words avoid leading questions: ‘In view of the health crisis, it would be best to nationalize the health industry.’ Question Sequence use simple & interesting opening questions general questions first Layout More important for Mail Survey than telephone survey Pretest Shows where you have asked ambiguous questions
  8. Pragmatic Reasons If Chrysler wished to census past purchasers’ reactions, millions of car buyers would have to be contacted Accurate & Reliable Results Reasonable accuracy though not perfect - sampling error! May be more accurate than census since less chance of nonsampling errors (e.g., data entry) Bureau of the Census uses samples to check the accuracy of the US Census. If the sample shows possible source of error, the census is redone. Destruction of Test Units e.g., Mean Life of Light Bulbs
  9. Probability Samples Selection is based on chance Subjects are chosen based on some known probabilities Eliminates or reduces bias Random refers to procedure not the data: The outcome cannot be predicted because it is dependent upon chance Non Probability Samples Do not have above characteristics Done for time and convenience
  10. Probability Samples Selection is based on chance Subjects are chosen based on some known probabilities Eliminates or reduces bias Random refers to procedure not the data: The outcome cannot be predicted because it is dependent upon chance Non Probability Samples Do not have above characteristics Done for time and convenience
  11. Simple Random Use random number table Number of digits is determined by population size
  12. Columns are 01, 02 etc. (aligned vertically) Example Population size is 50. Sample size is 10. Since population size (50) has 2-digits, divide table into 2 digit numbers. Begin top left (for convenience only). 1-49, 2-28, 3-08, 4-89 (skip) 4-24, 5-35, 6-77 (skip), 6-90 (skip) 6-02, 7-83 (skip) 7-61(skip) 7-87 (skip) 7-04, 8-16, 9-57 (skip) 9-07, 10-46. Example Population size is 100. Use 3 digit numbers.
  13. Probability Samples Selection is based on chance Subjects are chosen based on some known probabilities Eliminates or reduces bias Random refers to procedure not the data: The outcome cannot be predicted because it is dependent upon chance Non Probability Samples Do not have above characteristics Done for time and convenience
  14. Systematic Requires all population elements Bias may occur due to periodicity In the telephone book example, unlisted numbers will not be found Example: Sampling frame is 100 individuals. You want to select 20. Select first name by random number, then every 5th person.
  15. Probability Samples Selection is based on chance Subjects are chosen based on some known probabilities Eliminates or reduces bias Random refers to procedure not the data: The outcome cannot be predicted because it is dependent upon chance Non Probability Samples Do not have above characteristics Done for time and convenience
  16. Stratified Assures 1. Sample reflects population in terms of criterion used for stratifying. 2. More efficient sample - sampling error is reduced. Example: College has 70% on-campus students and 30% commuters. A 100 student survey would get close to 70 on-campus students and 30 commuters. A simple random survey might get 60 on-campus and 40 commuting students. Similar to Quota sampling except that a simple random sample is drawn from each strata.
  17. Probability Samples Selection is based on chance Subjects are chosen based on some known probabilities Eliminates or reduces bias Random refers to procedure not the data: The outcome cannot be predicted because it is dependent upon chance Non Probability Samples Do not have above characteristics Done for time and convenience
  18. Cluster Idea is to sample economically yet retain characteristics of probability sample. Ideally, cluster is as heterogeneous as the population. Often, characteristics of elements in cluster may be similar.
  19. Probability Samples Selection is based on chance Subjects are chosen based on some known probabilities Eliminates or reduces bias Random refers to procedure not the data: The outcome cannot be predicted because it is dependent upon chance Non Probability Samples Do not have above characteristics Done for time and convenience
  20. Judgment A fashion manufacturer selects key accounts to predict what will sell next season Quota Advantages are speed of data collection, lower costs, and convenience. Often used in laboratory experiments It is difficult to find a sample of the general population willing to visit a laboratory Chunk (Convenience) Street interviews at election time. Views represent supposedly the entire population. Need impressions of text book in an hour. Use this class to represent all students.
  21. Frame Error The sampling frame is also called the ‘working population.’ Frame error is the discrepancy between population and sampling frame. e.g., Not all students may be in phone book Sampling Error Sampling units may not perfectly represent the population. All samples vary. Sampling error is a function of sample size Systematic (Nonresponse & Measurement) Error Nonresponse, badly worded questions, interview error.