Download as PDF, PPTX

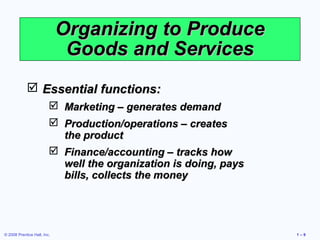
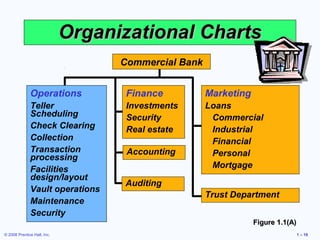
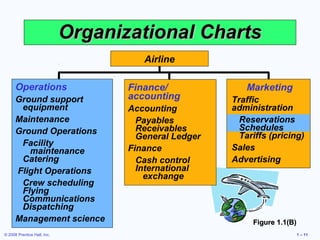
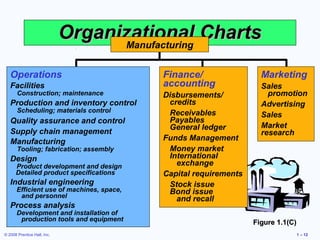
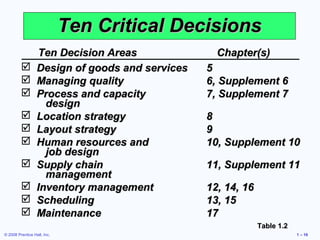
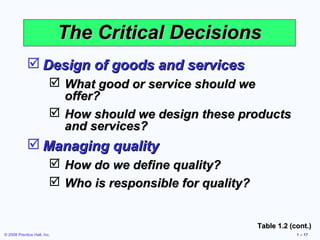
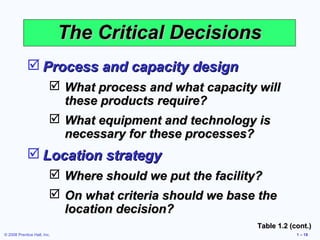
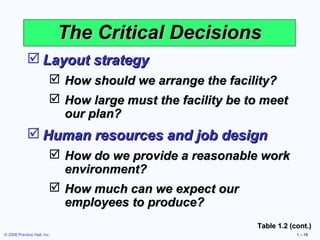
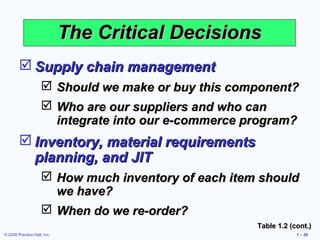
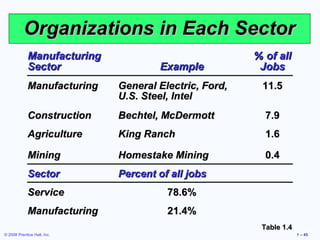
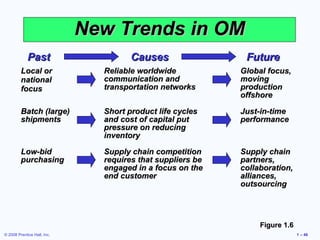
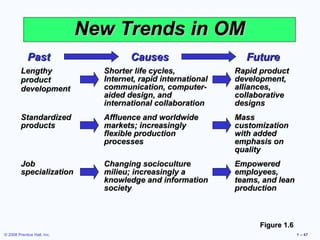
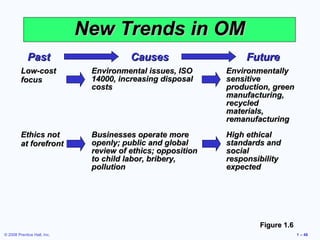

The document outlines key topics in operations management including: 1. It provides learning objectives for the chapter on operations and productivity such as defining operations management, distinguishing between goods and services, and calculating productivity metrics. 2. It gives examples of organizational charts for different types of companies to illustrate the operations, marketing, and finance functions. 3. It describes the 10 critical decisions that operations managers must make, such as design of goods/services, quality management, and supply chain management.