Download to read offline
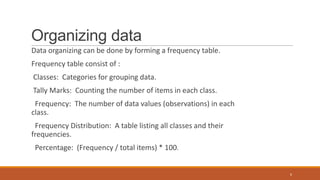
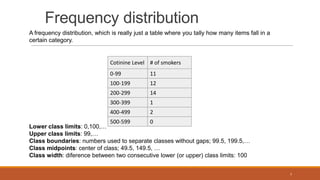


This document provides an overview of descriptive statistics. It defines descriptive statistics as quantitatively describing the main features of data using tables, graphs, and summary measures. Descriptive statistics are widely used because tables and graphs are easy to understand. The document discusses different types of data collections like census, sample surveys, and experiments. It also defines qualitative and quantitative data. It describes how to organize data by forming frequency tables which include classes, frequencies, tally marks, frequency distributions, and percentages. Finally, it provides an example of a frequency distribution and defines related terms like class boundaries, class limits, and class width.