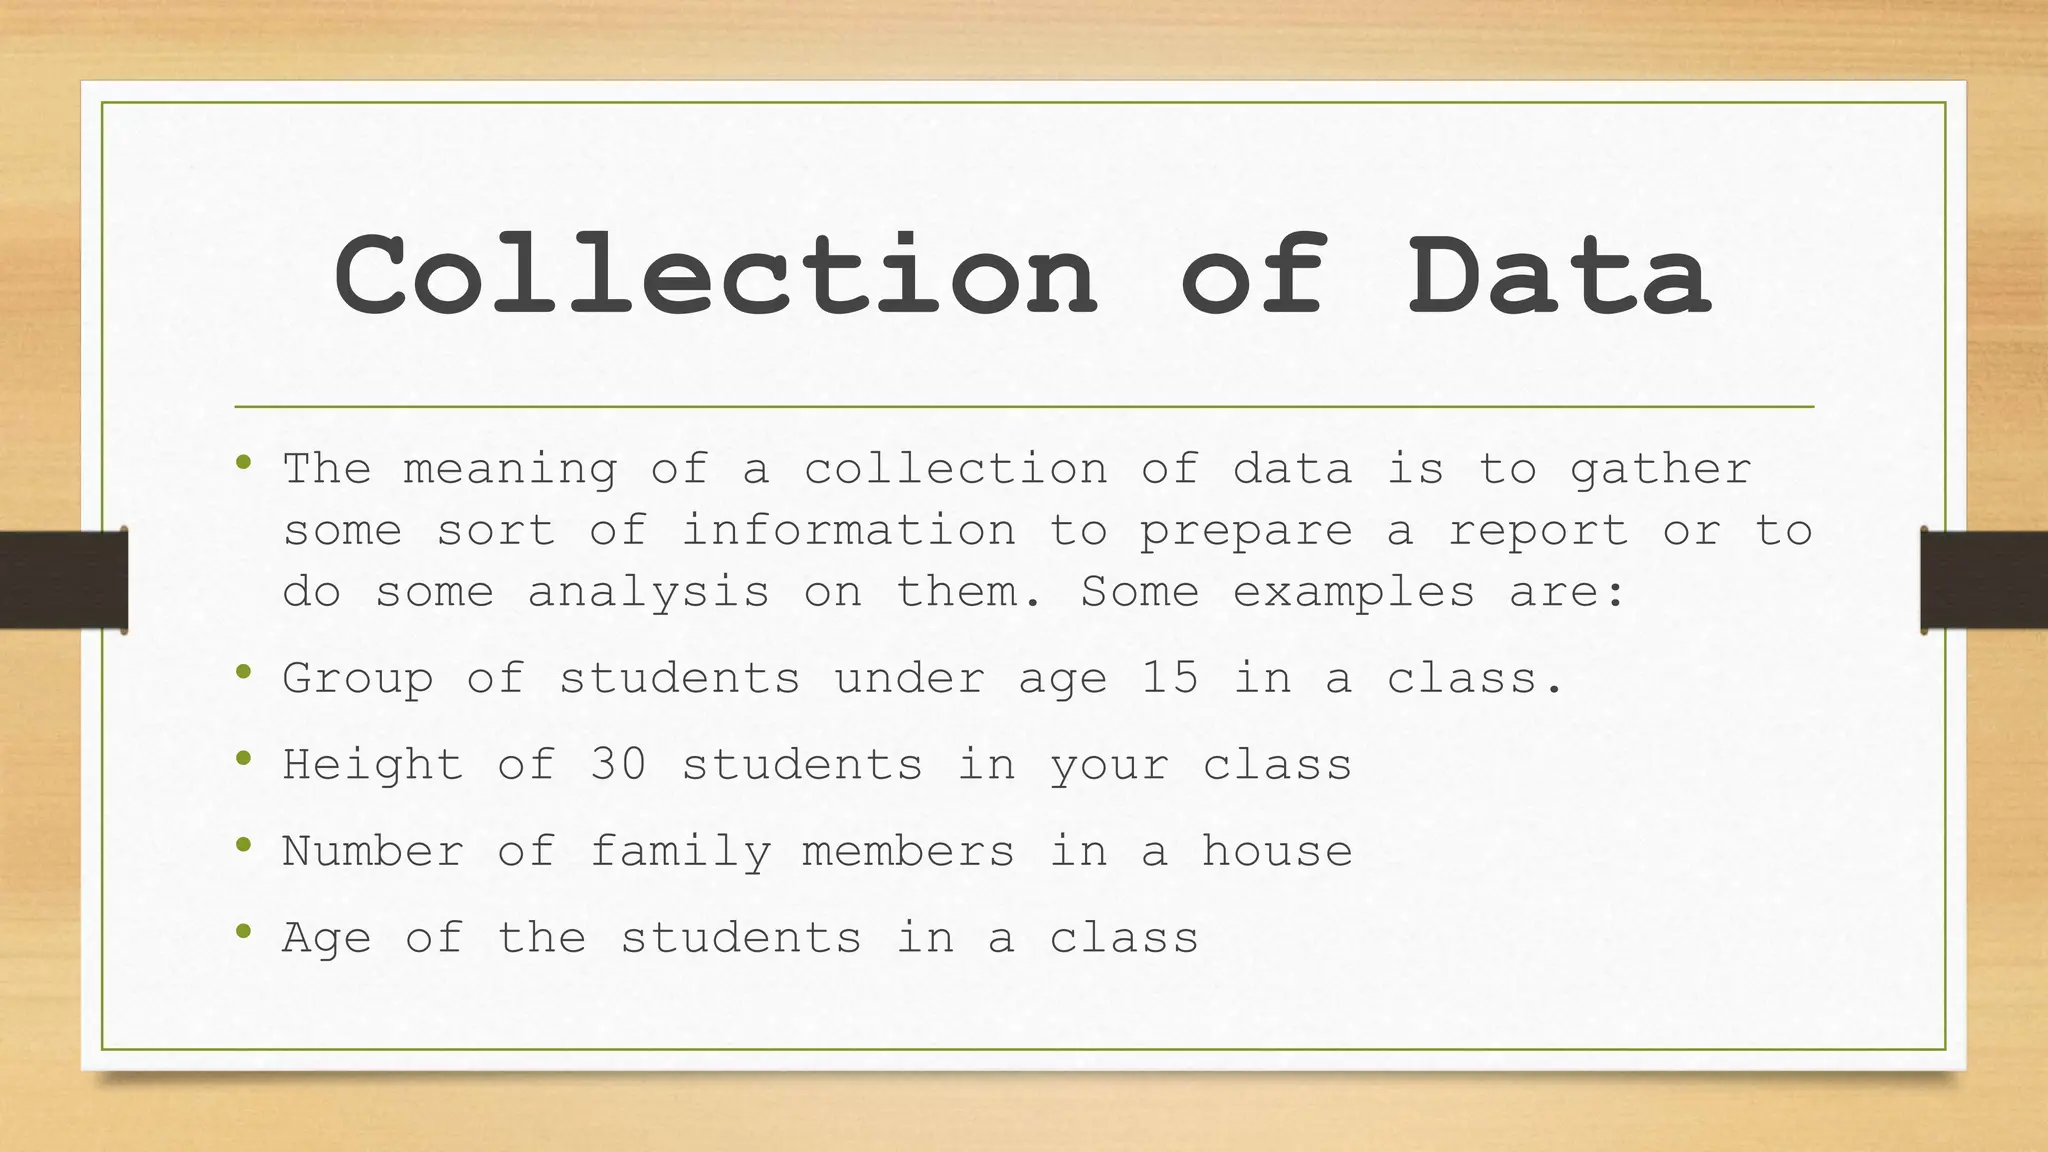
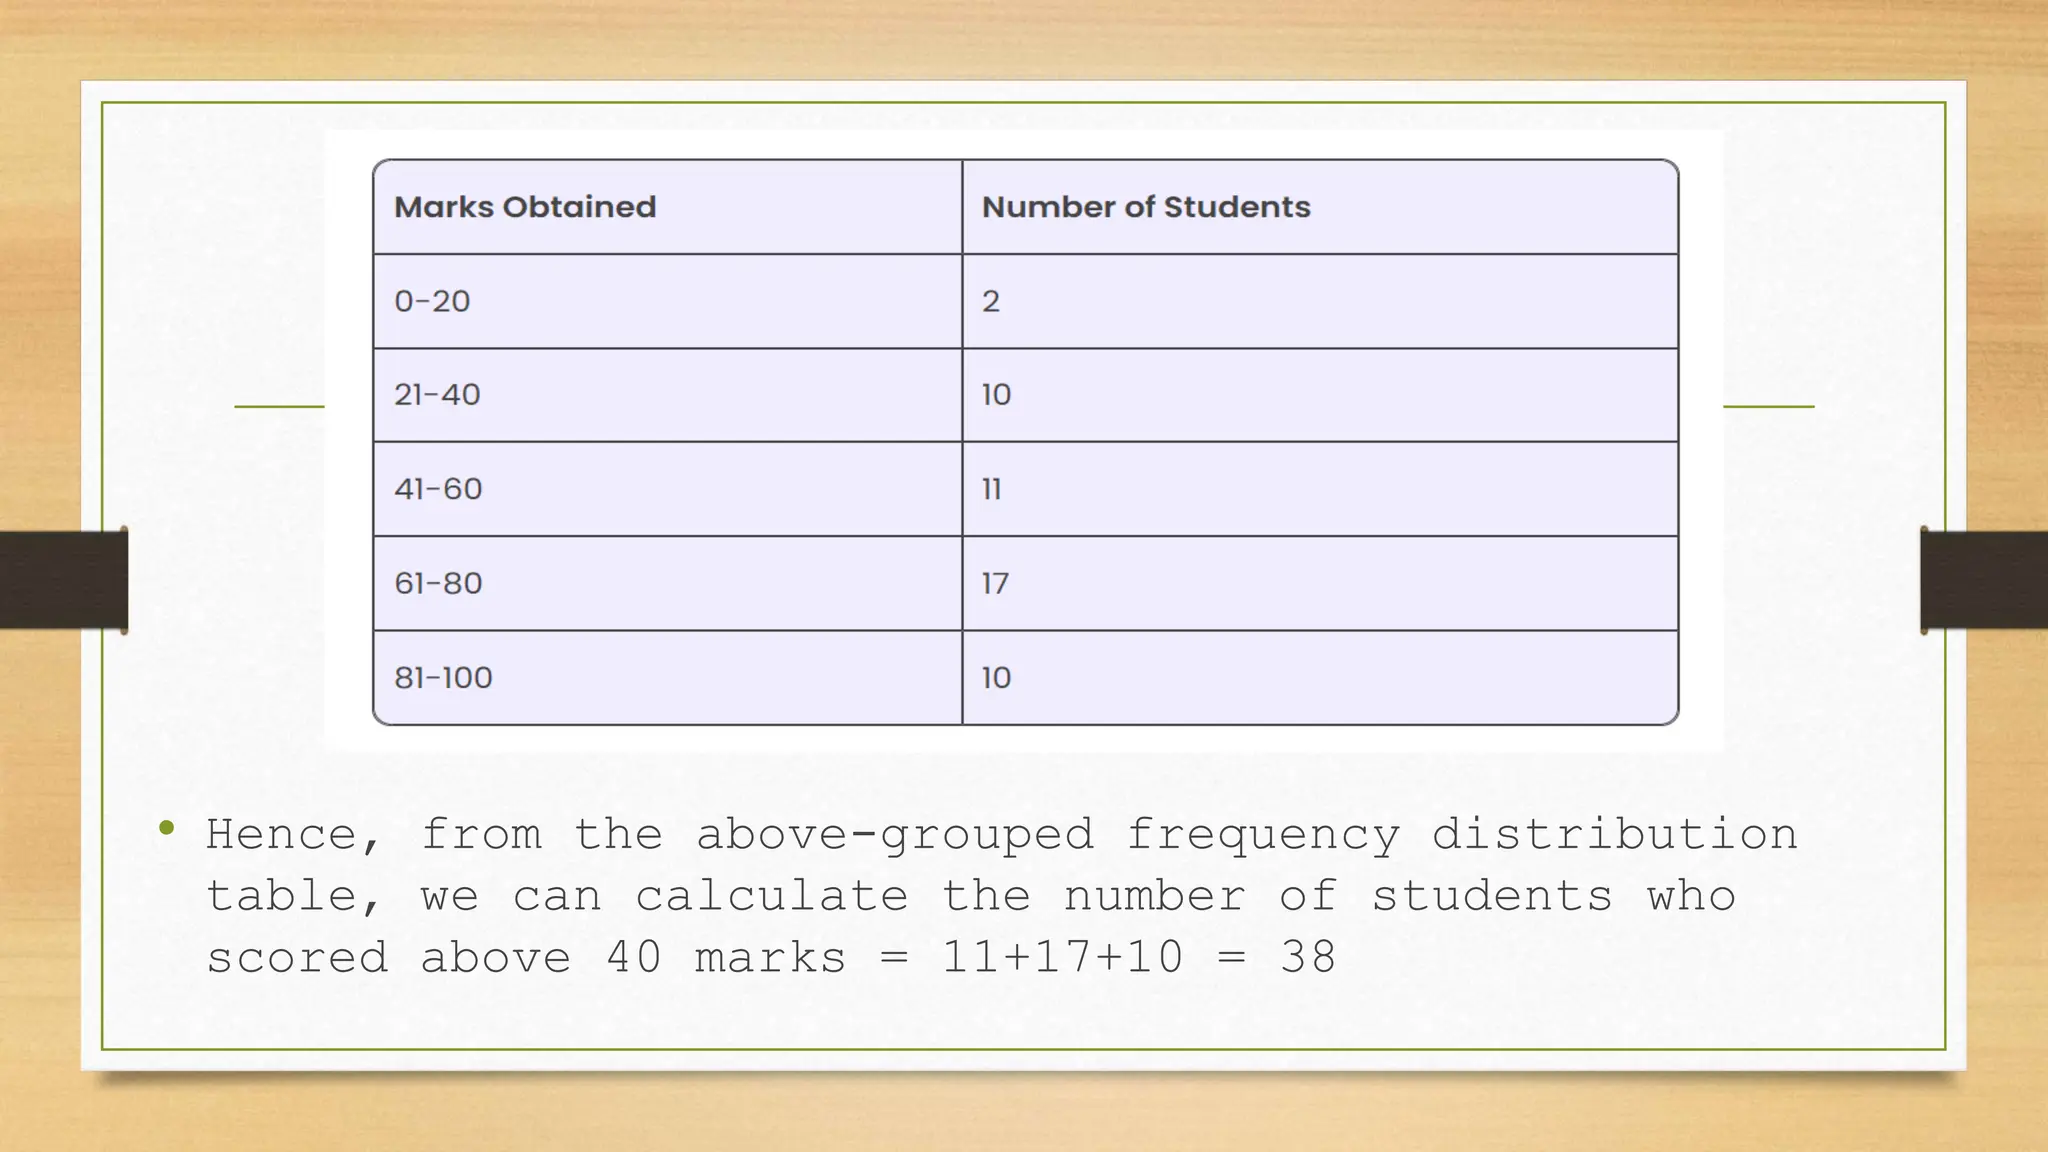
This document discusses how to collect, present, and analyze statistical data. It provides examples of collecting data on student characteristics like age and exam scores. Data can be presented through tables that group values into frequency distributions to calculate quantities like the number of students scoring above a threshold. Graphs like bar graphs, histograms, and frequency polygons can also represent grouped data visually. Measures of central tendency - mean, median, and mode - are introduced to summarize typical values in a data set. Formulas and examples are given for calculating each of these statistical measures.
![Median
• The median is that value which divides the given
number of observations into exactly two parts.
First, the data set has to be arranged in an
order, either ascending or descending. There are
again two conditions here:
• If the number of observations is odd, then;
• Median = [(n+1)/2]th observation or term
• If the number of observations is even, then the
median will be mean of (n/2)th term and
((n/2)+1)th term.](https://image.slidesharecdn.com/statistics-231220145112-a2a55deb/75/Statistics-9th-standard-Mathematics-Notes-pptx-12-2048.jpg)