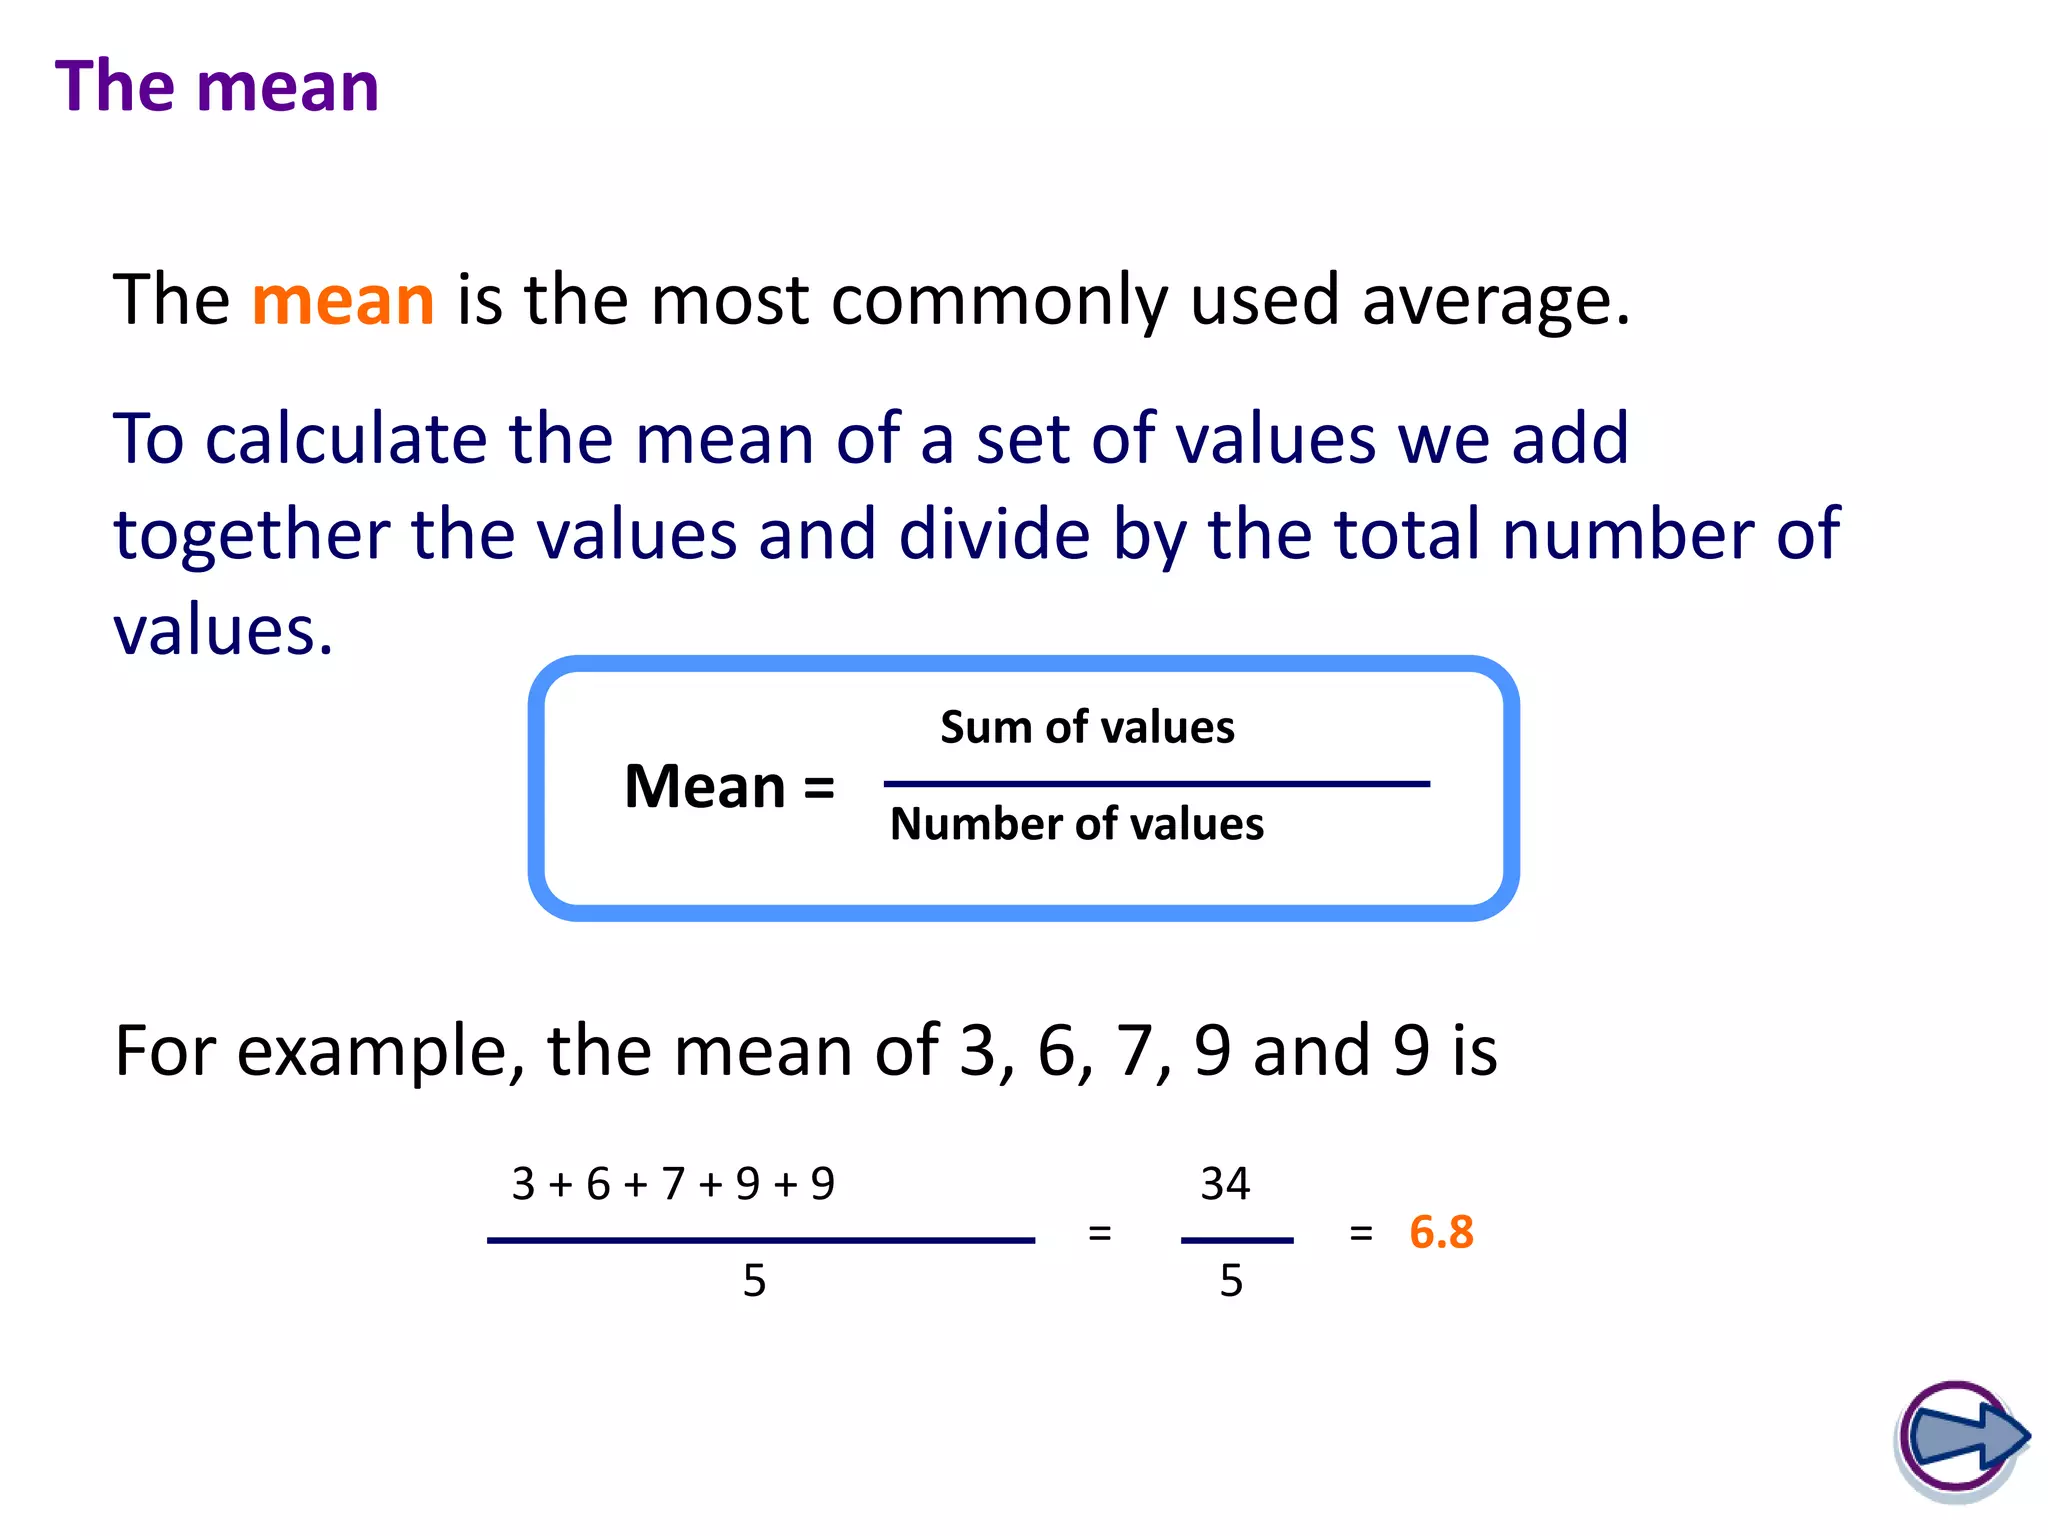
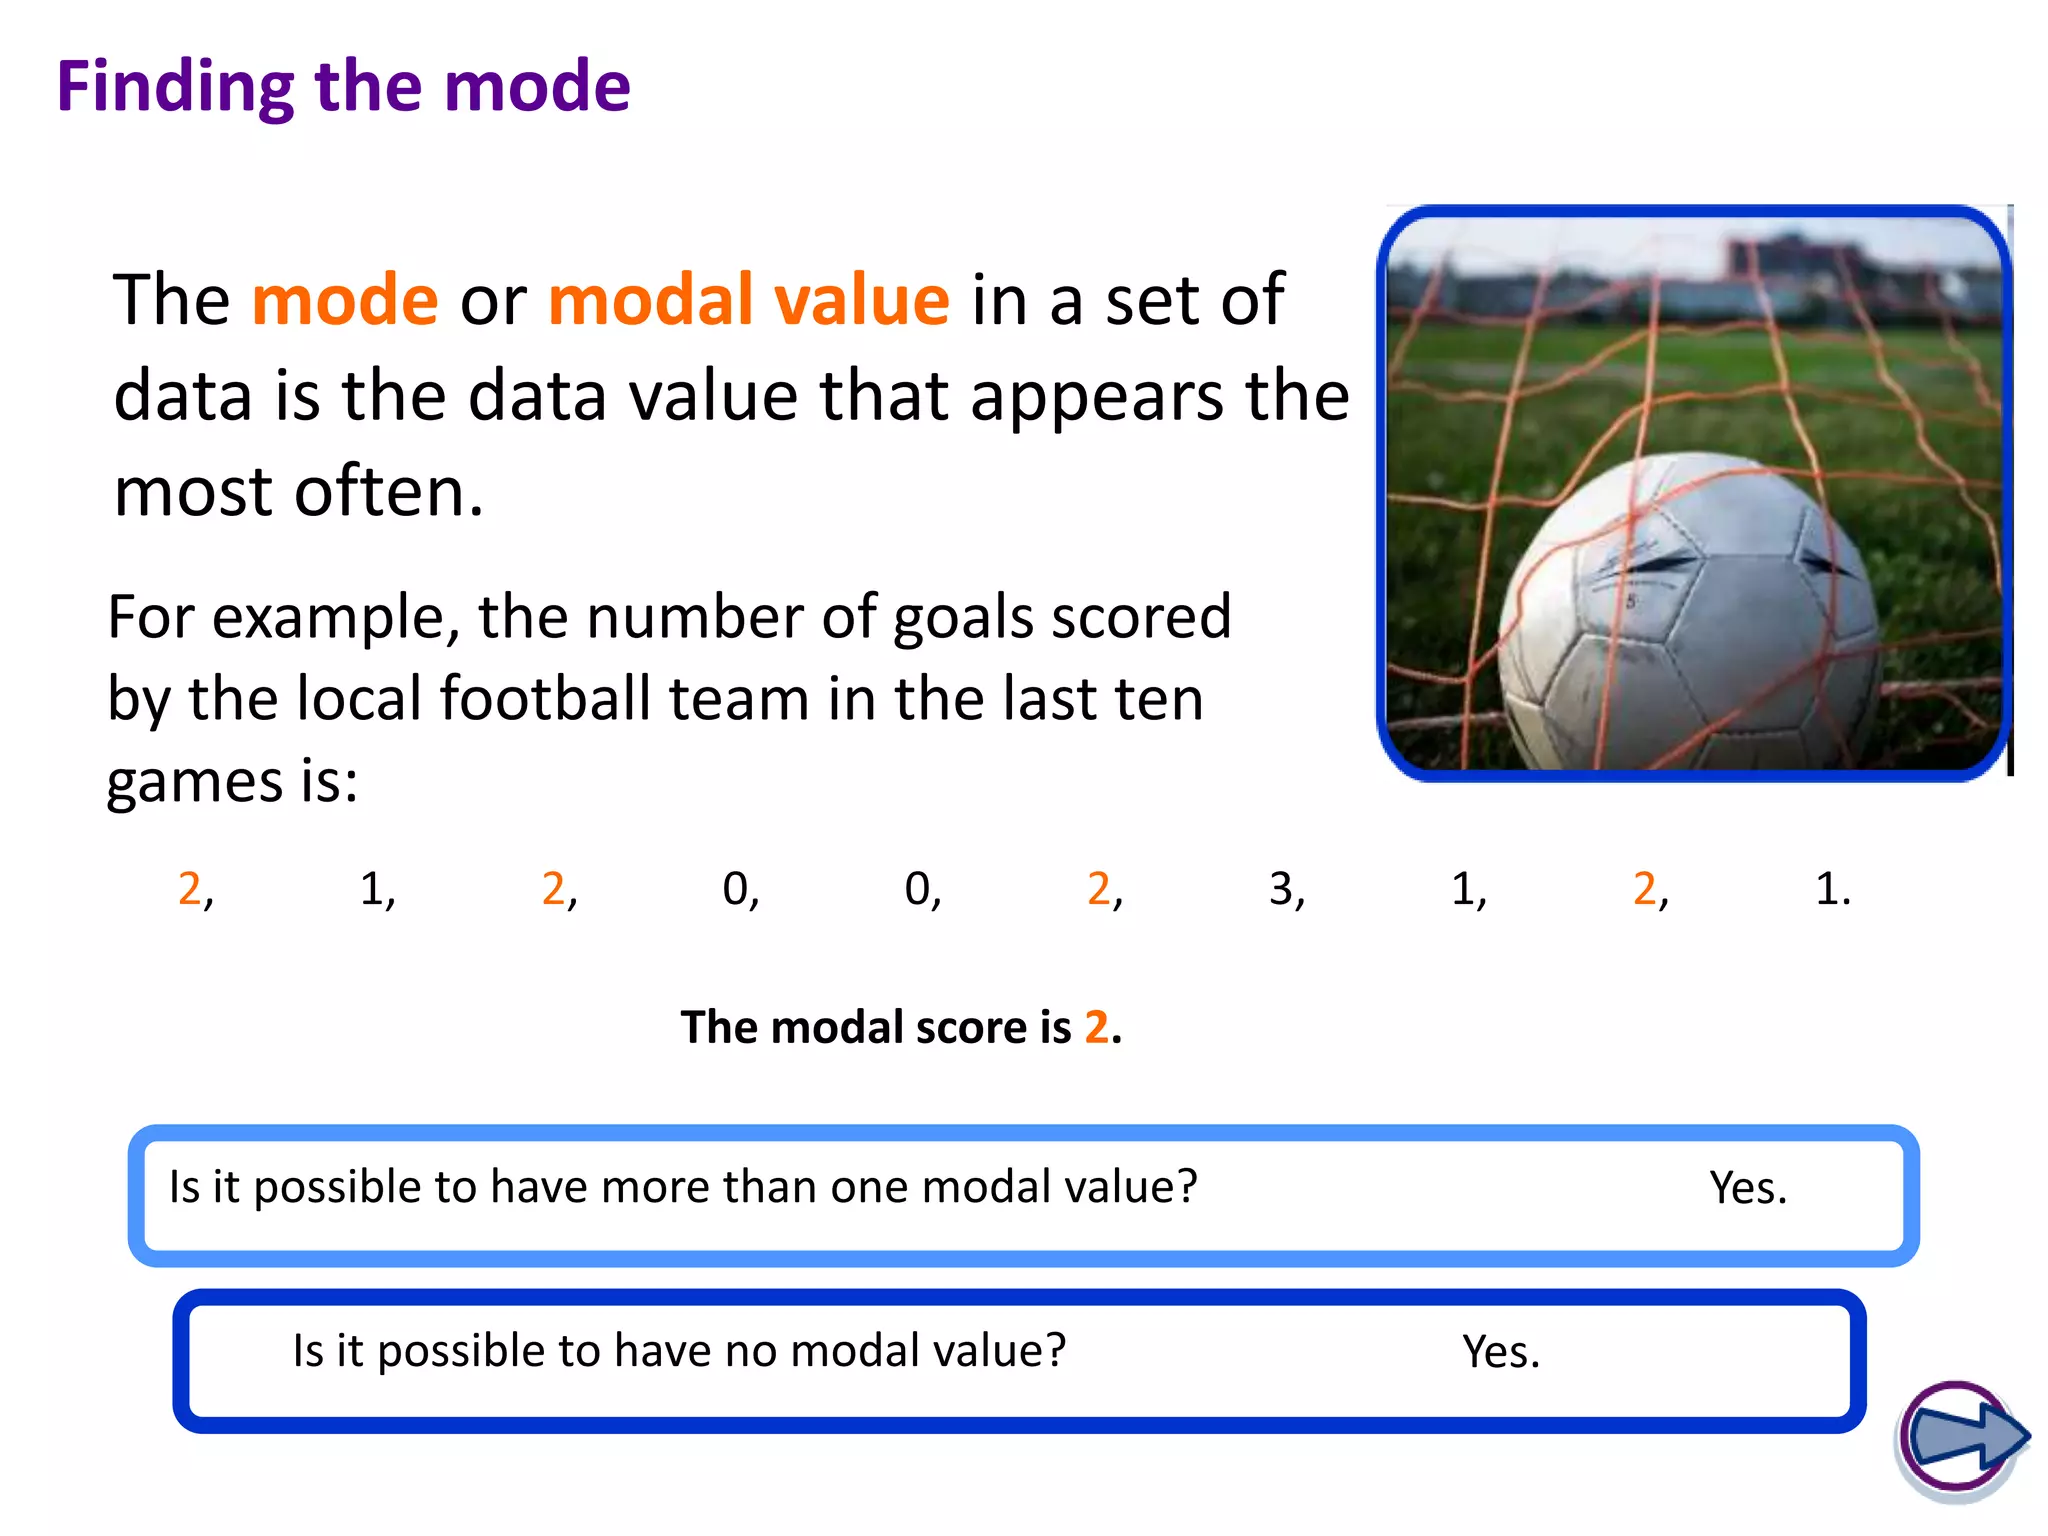
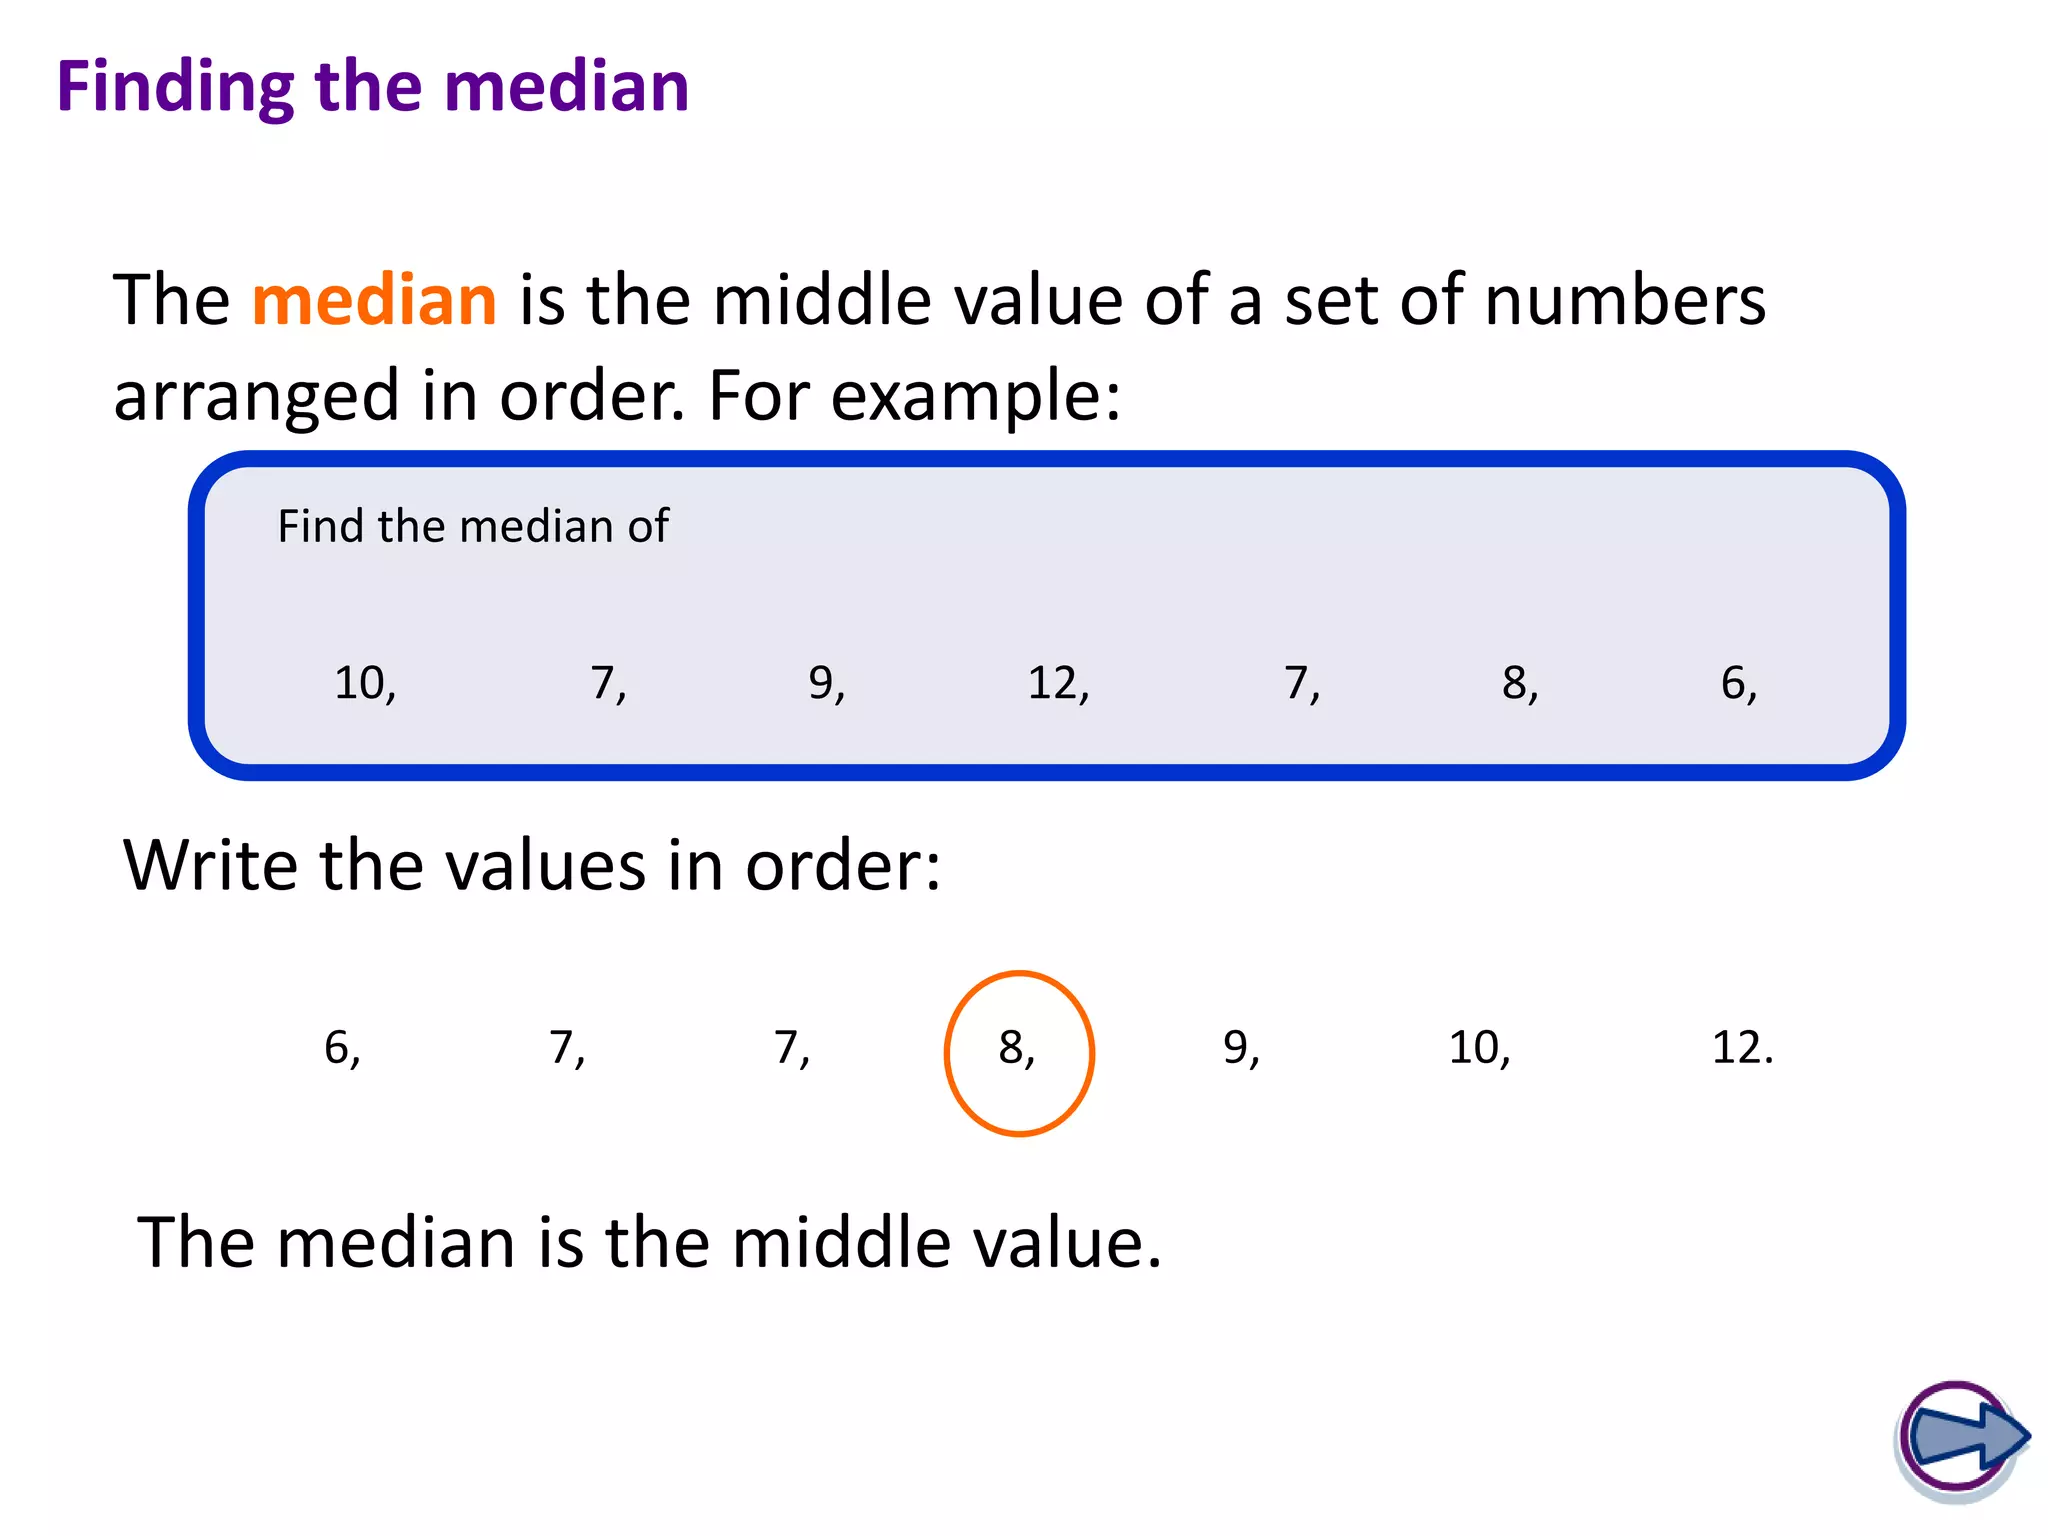
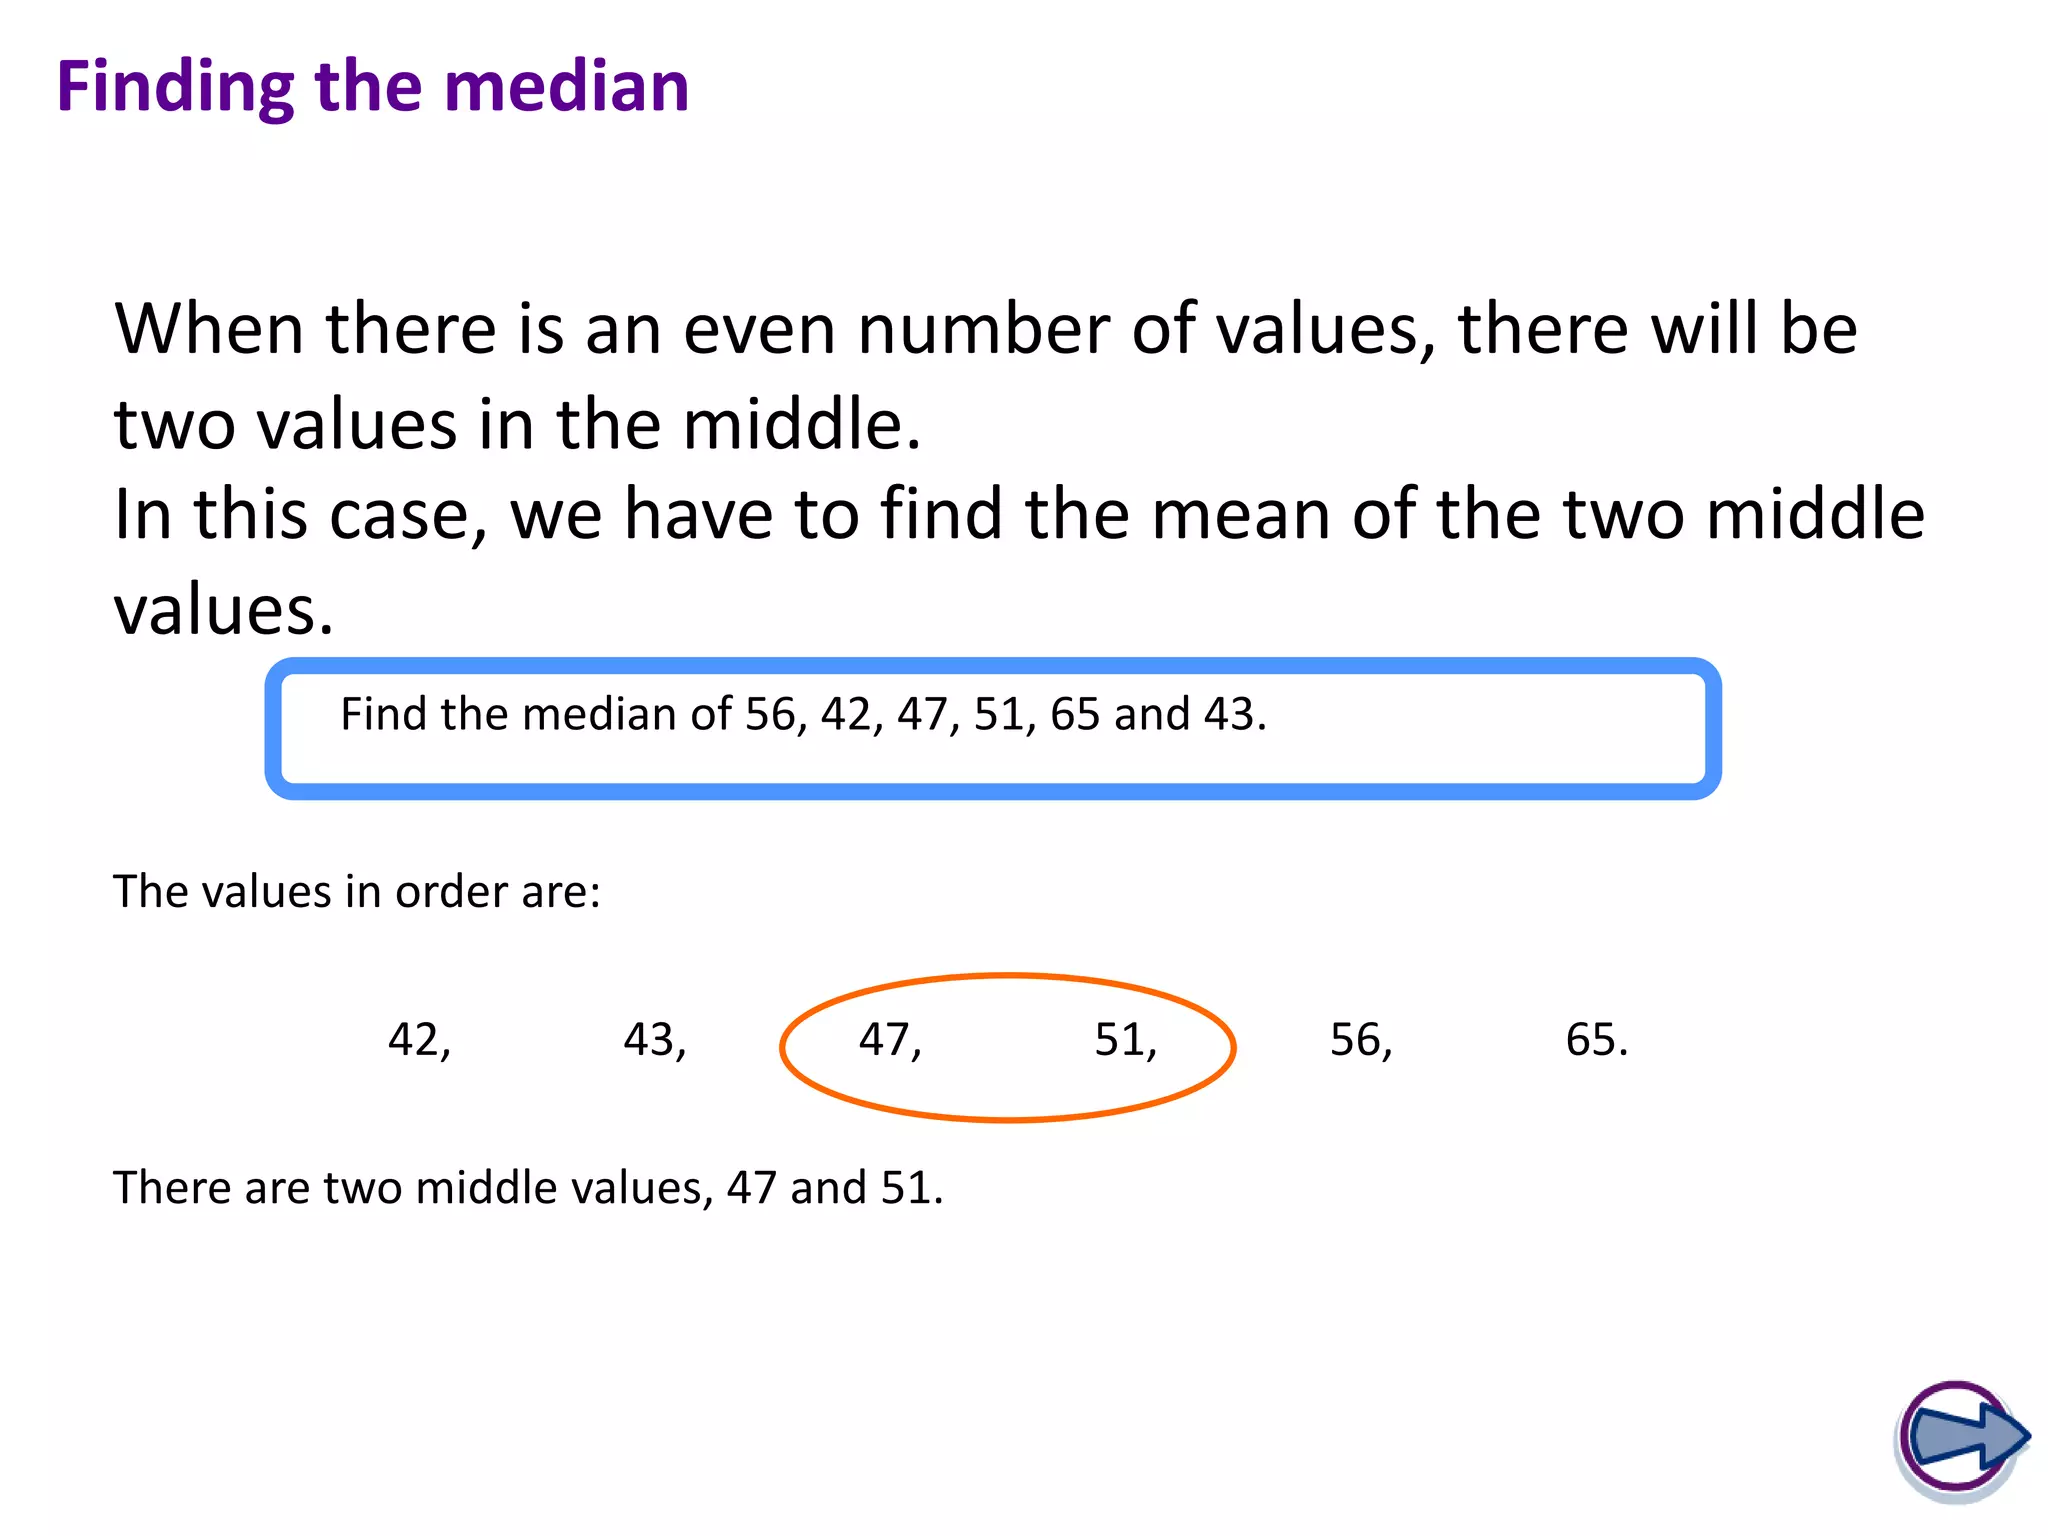
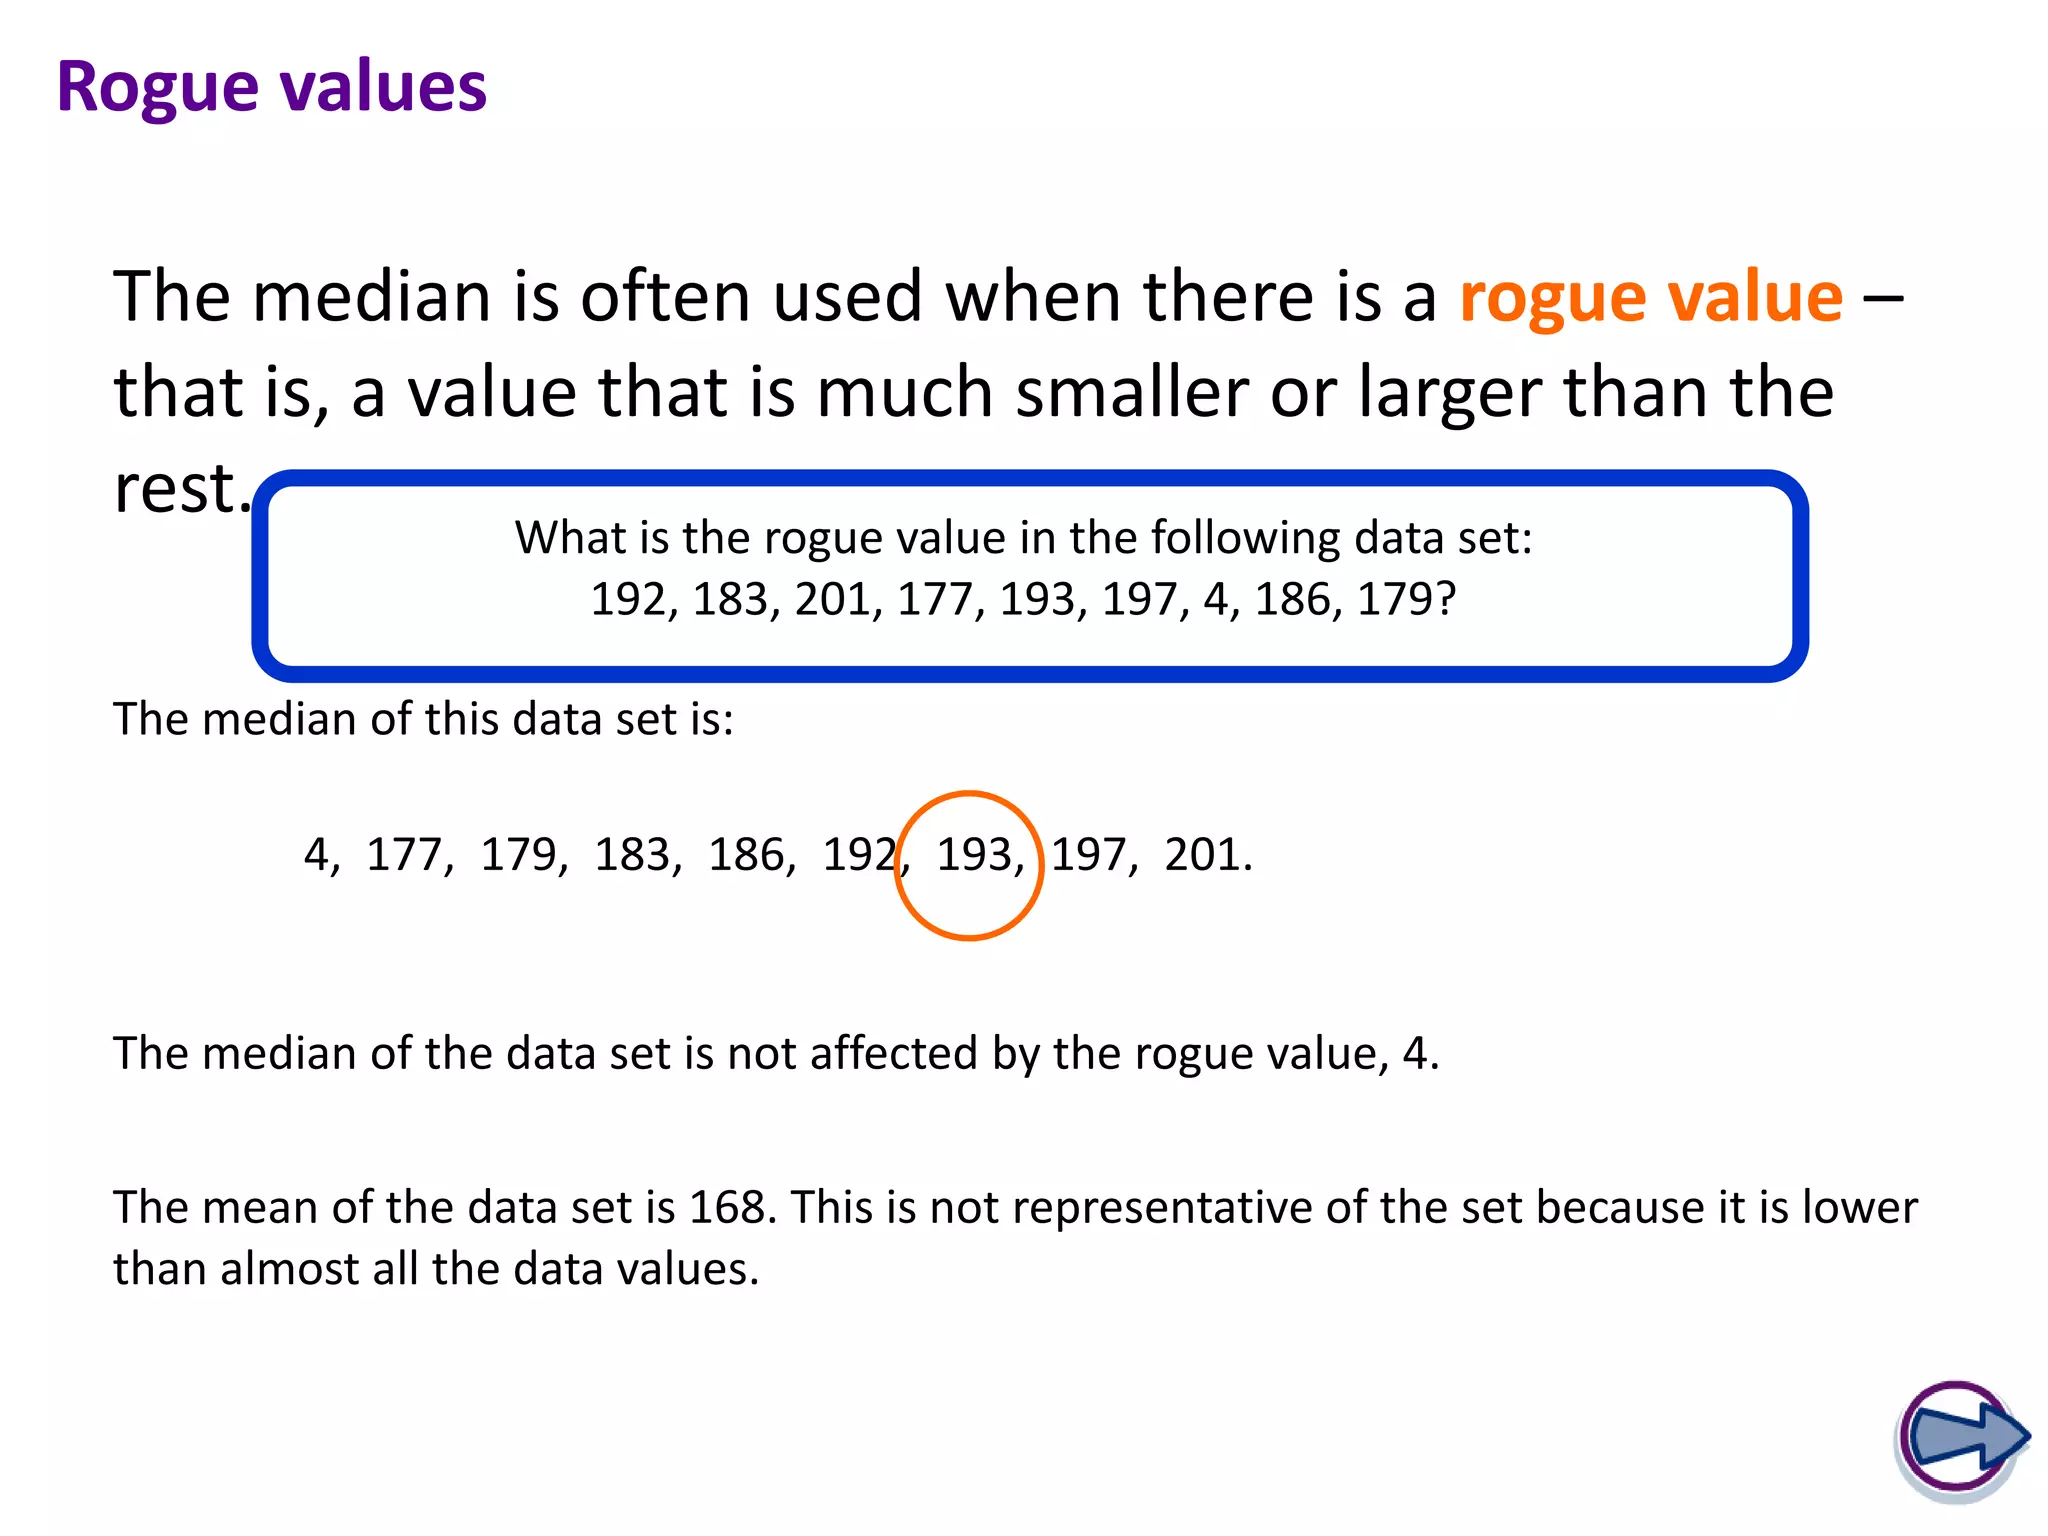
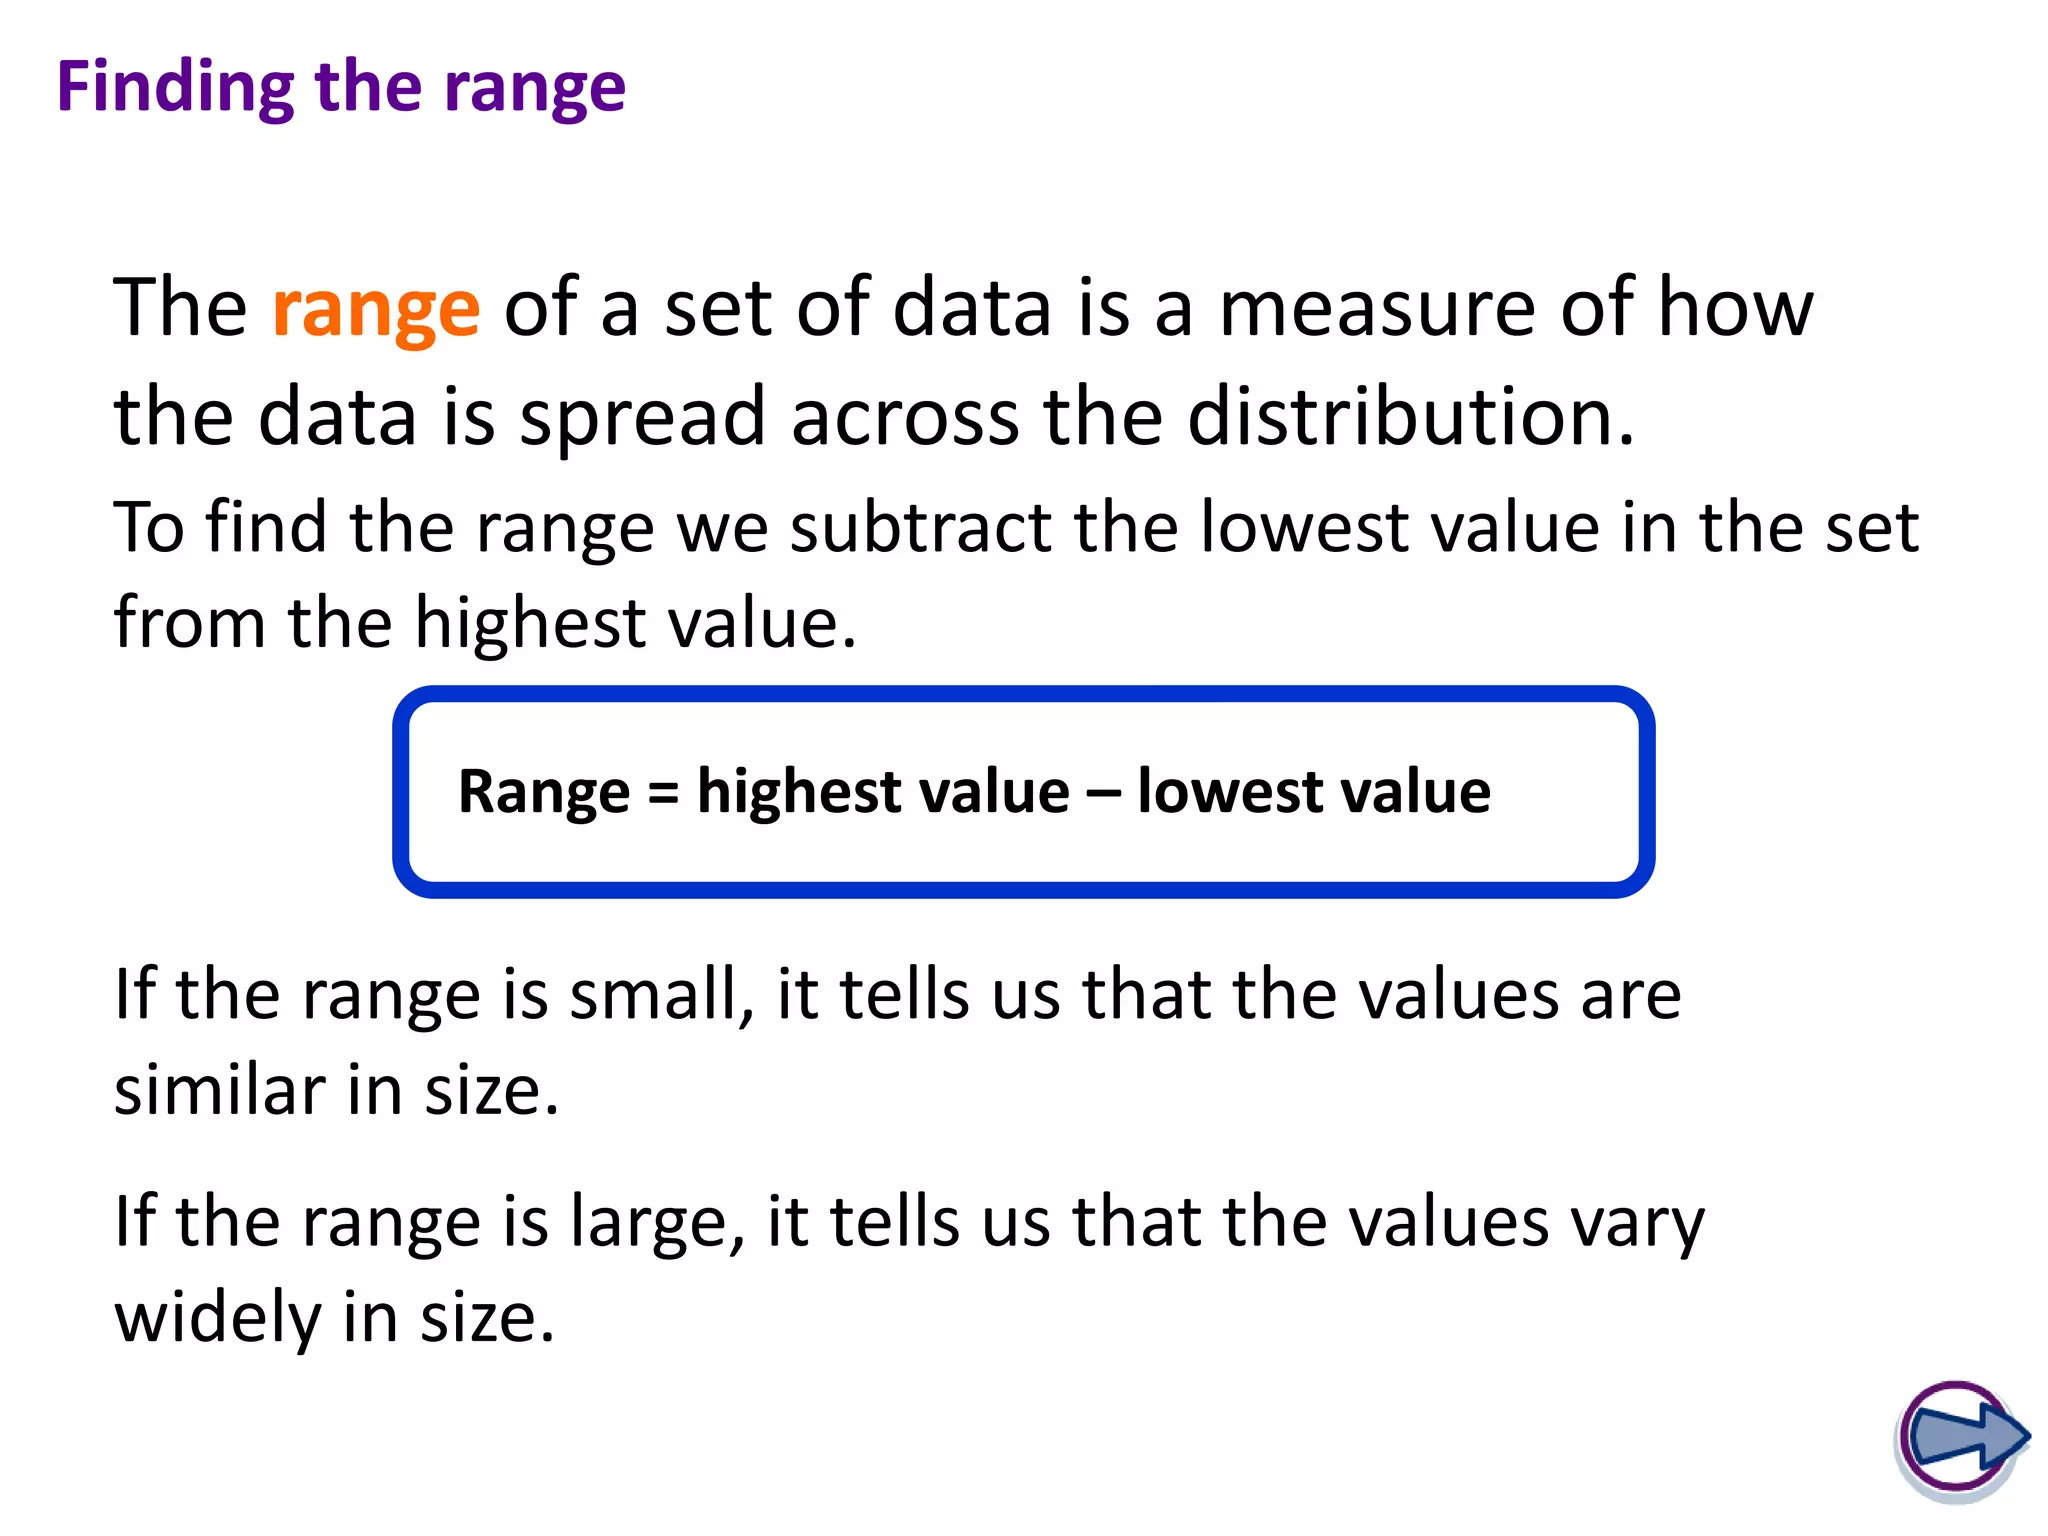
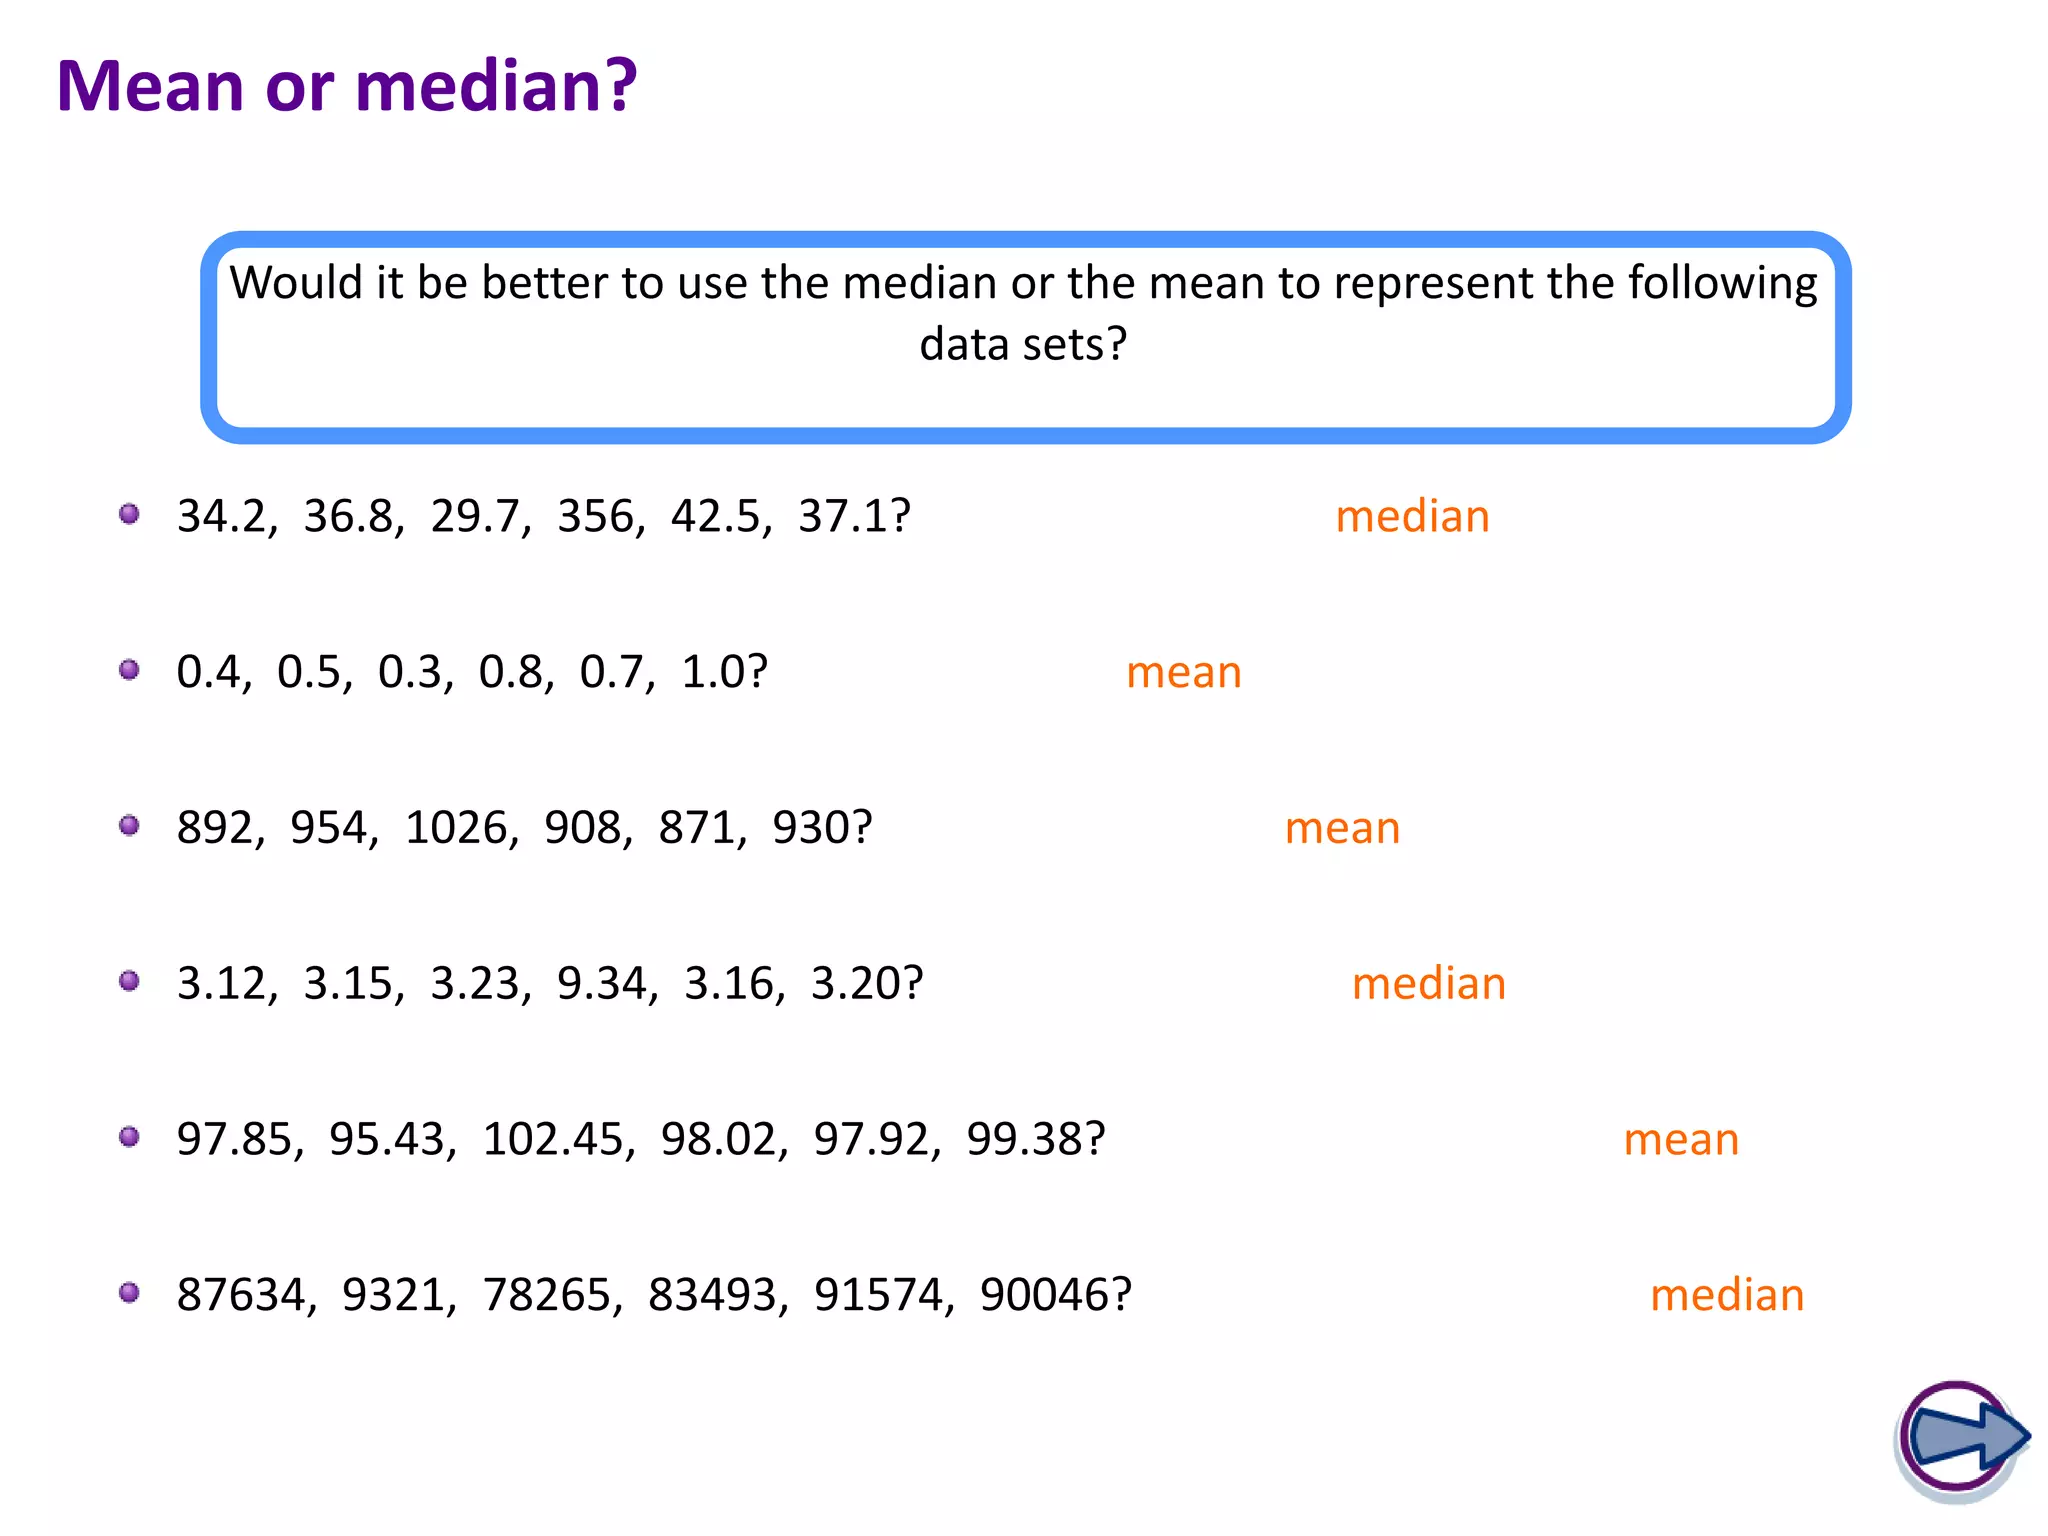
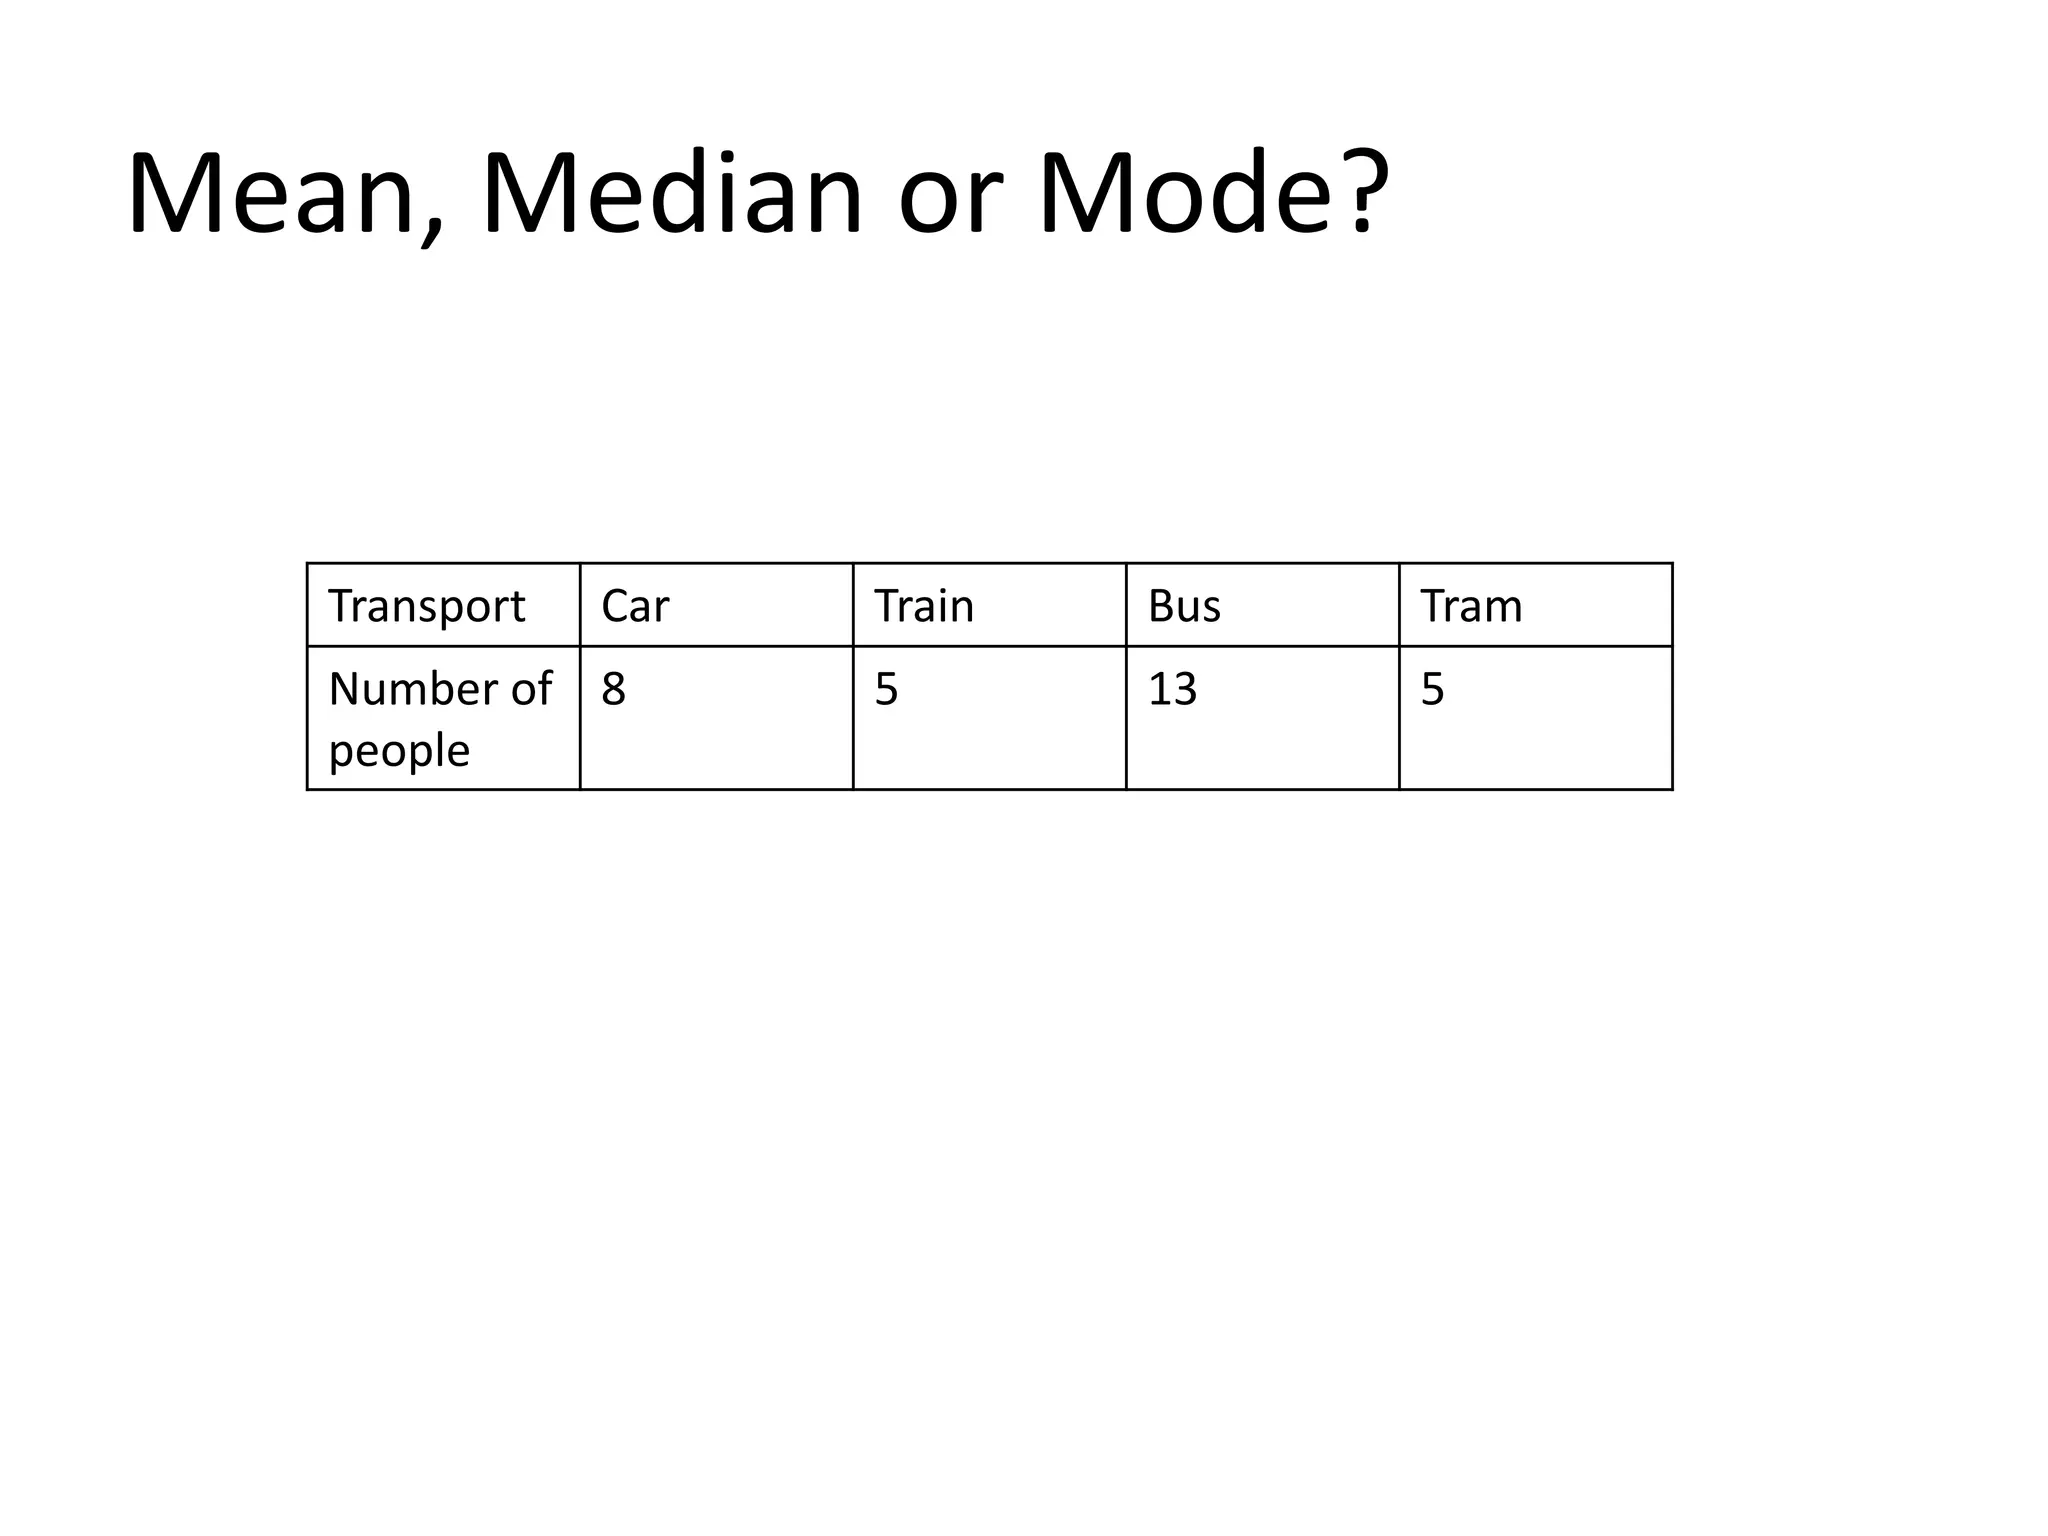
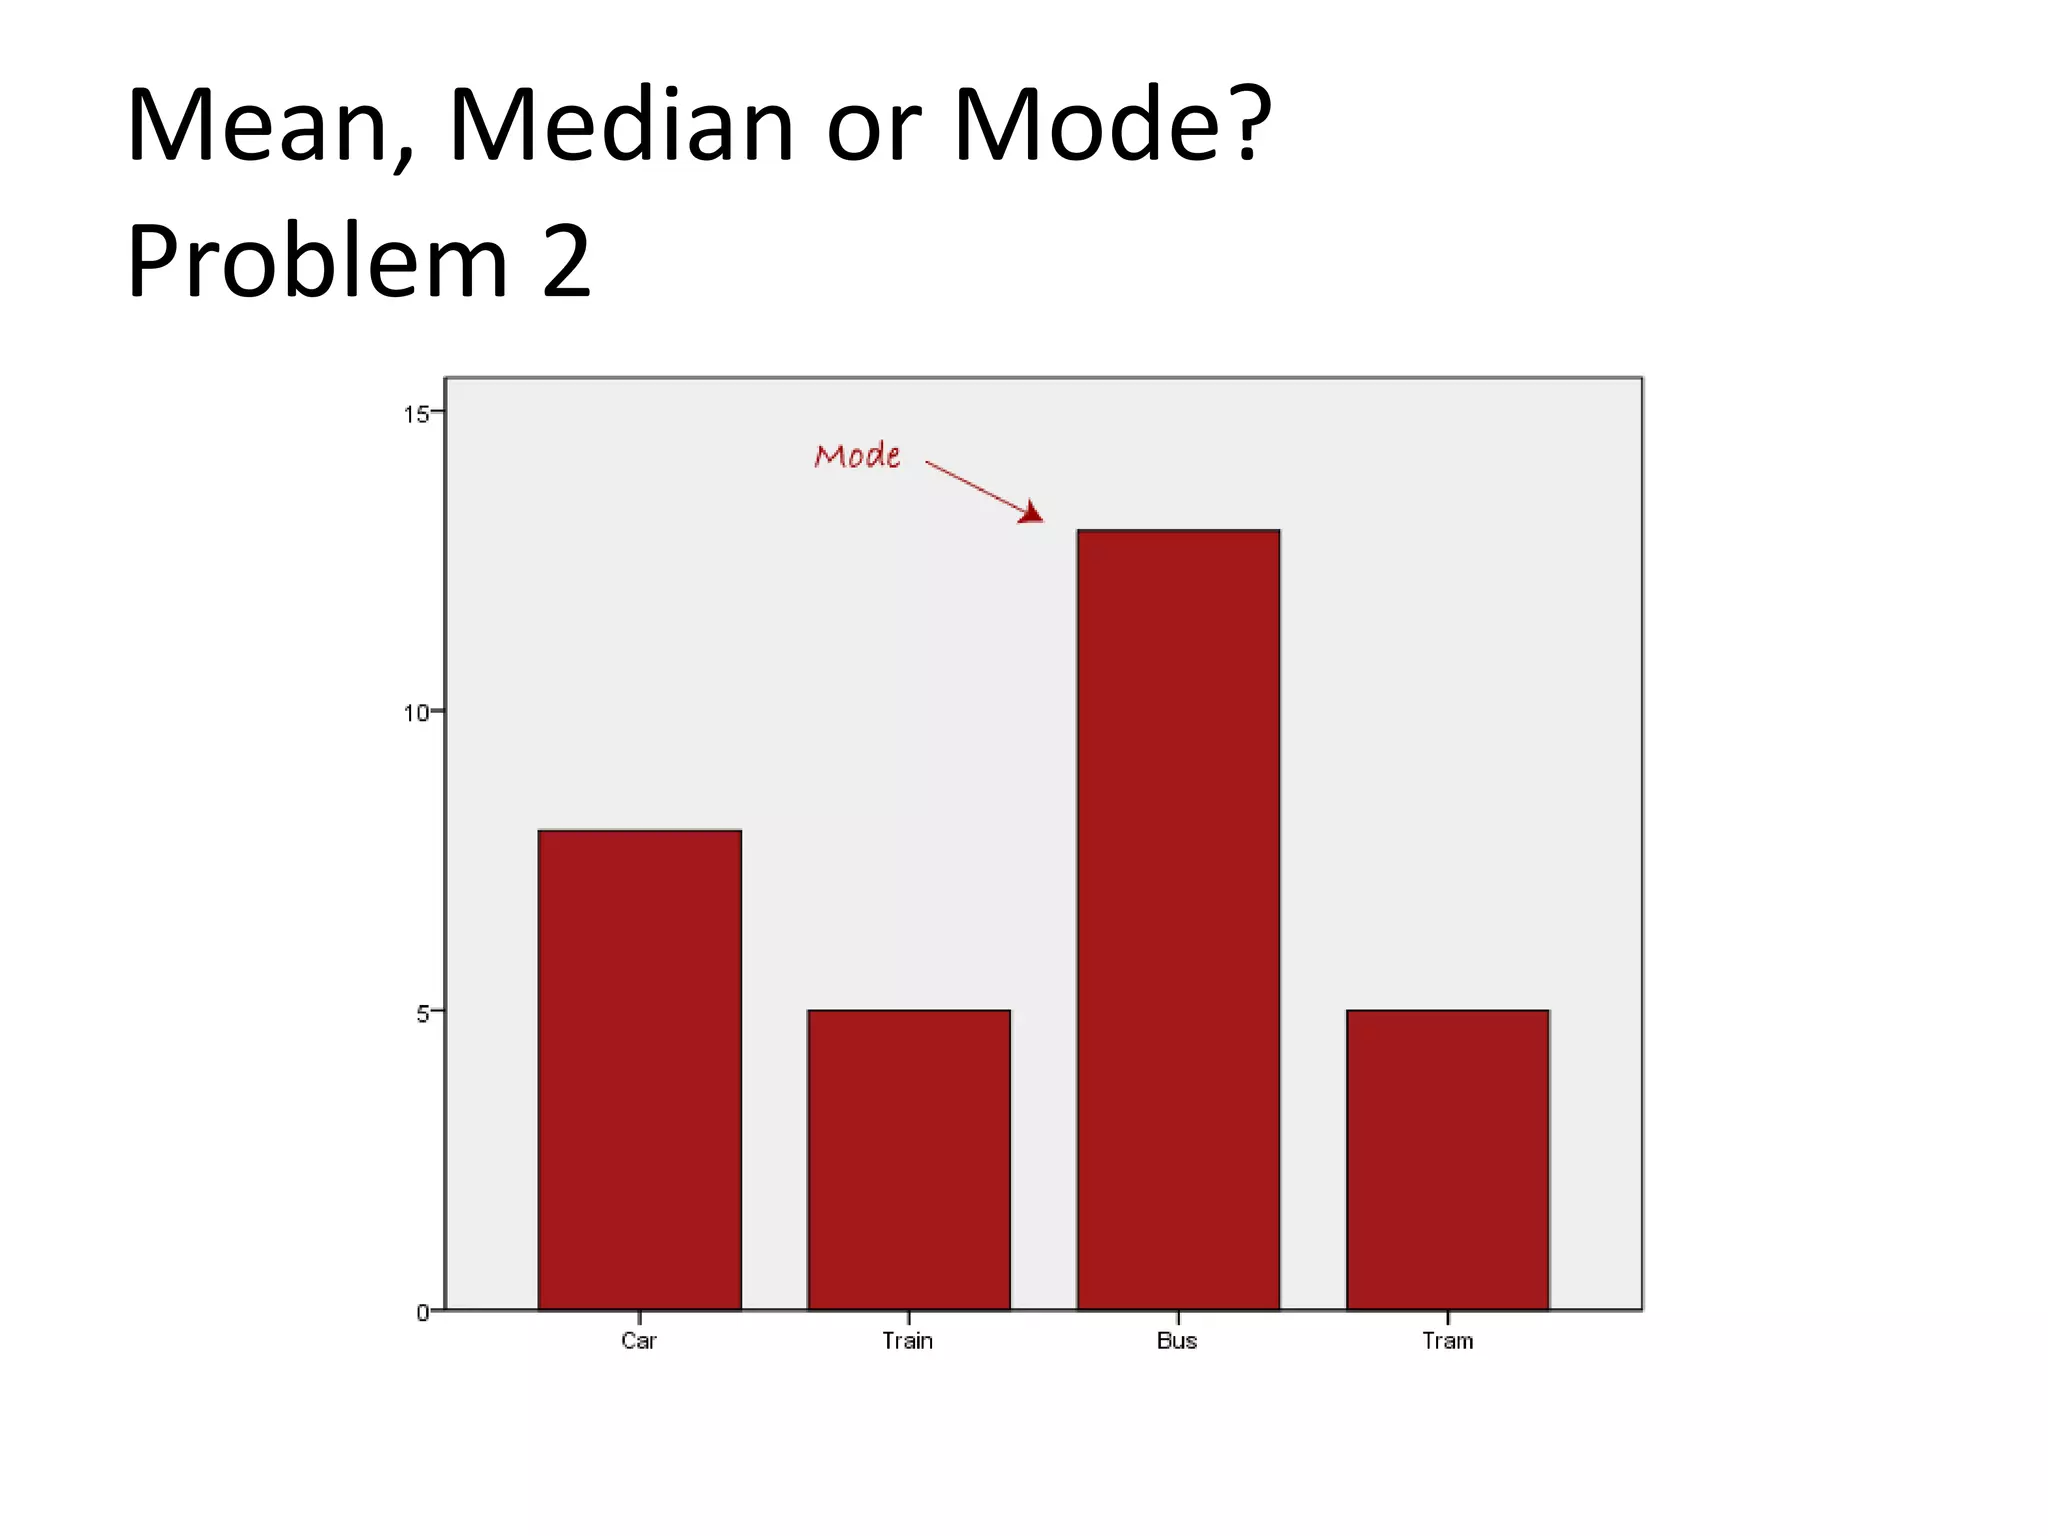
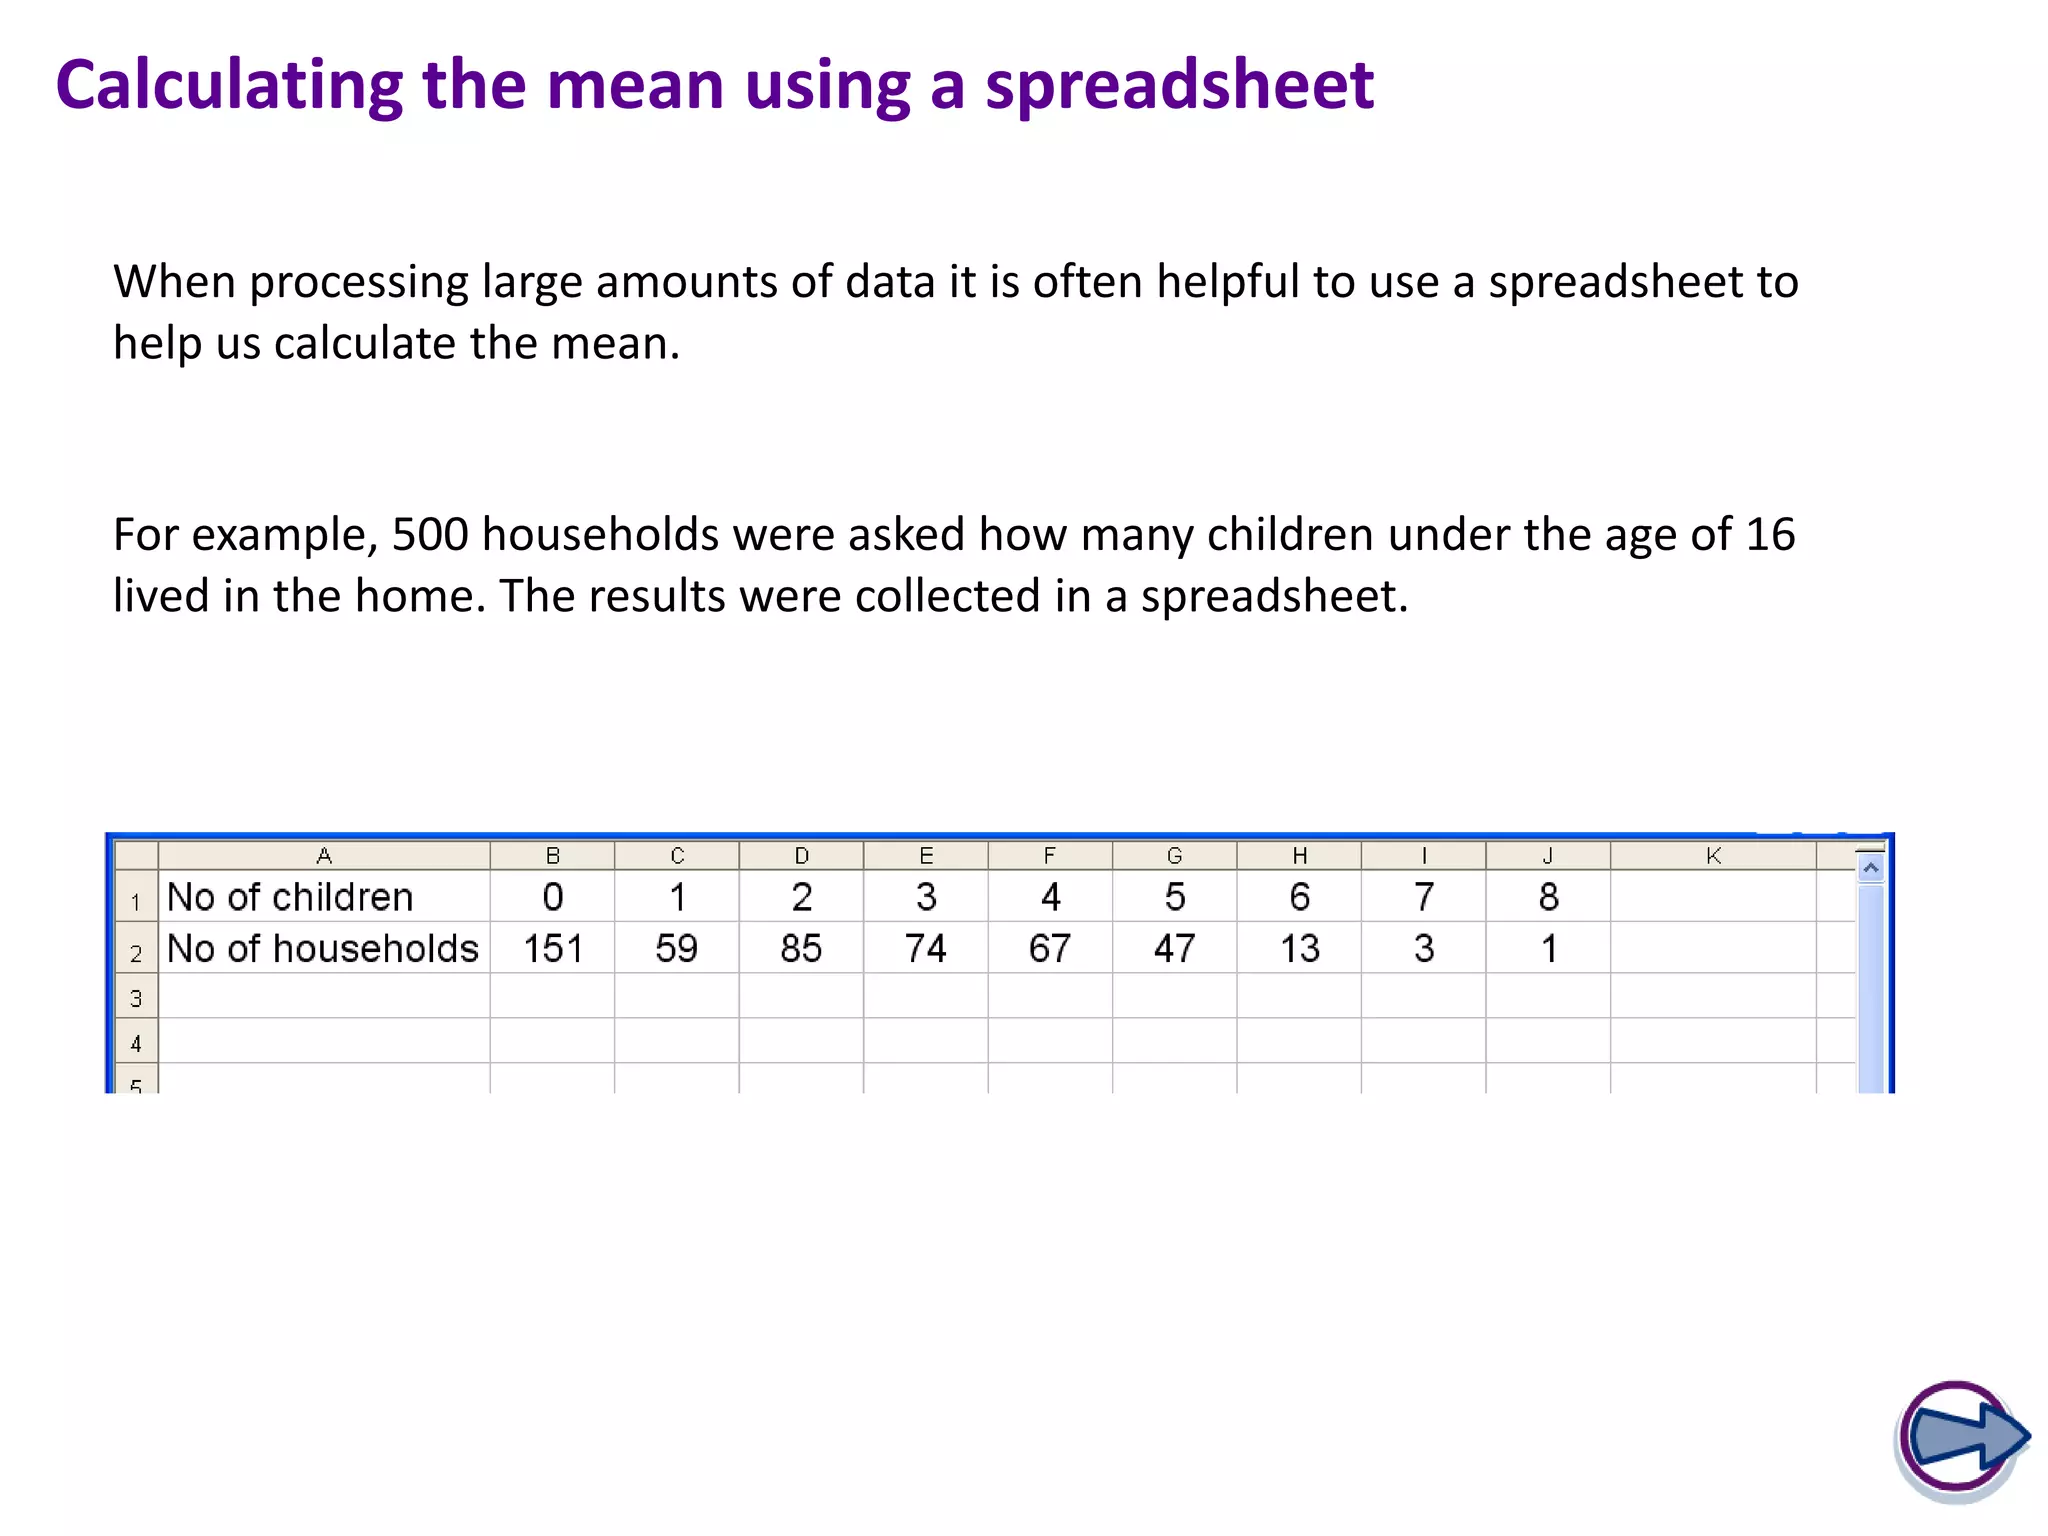
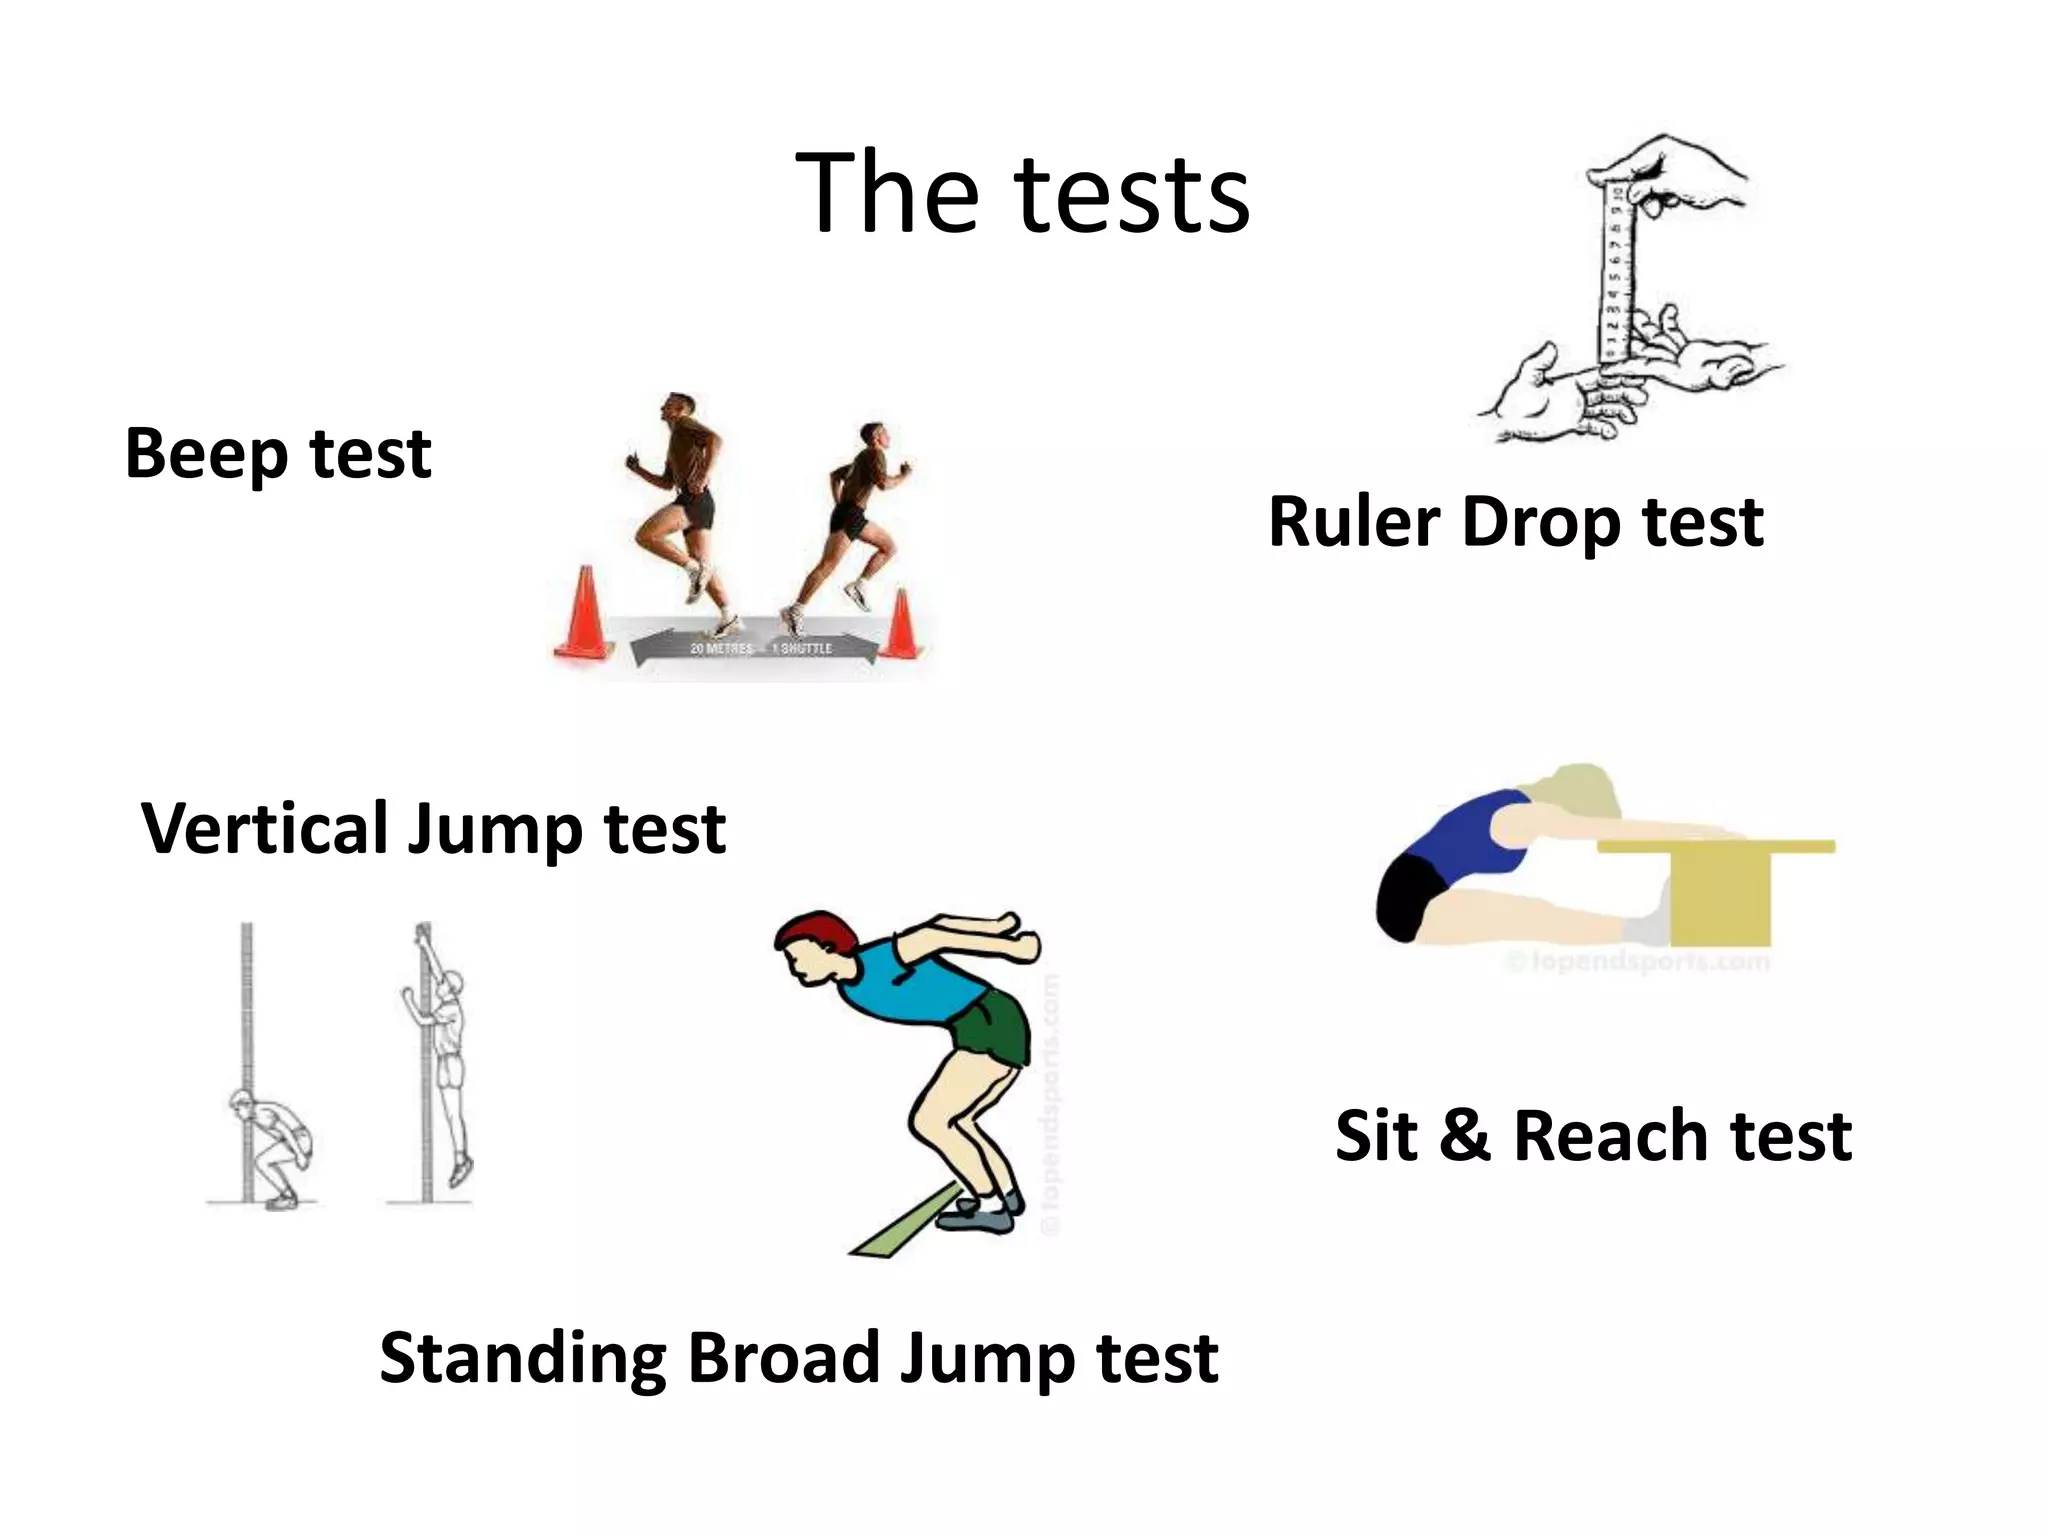
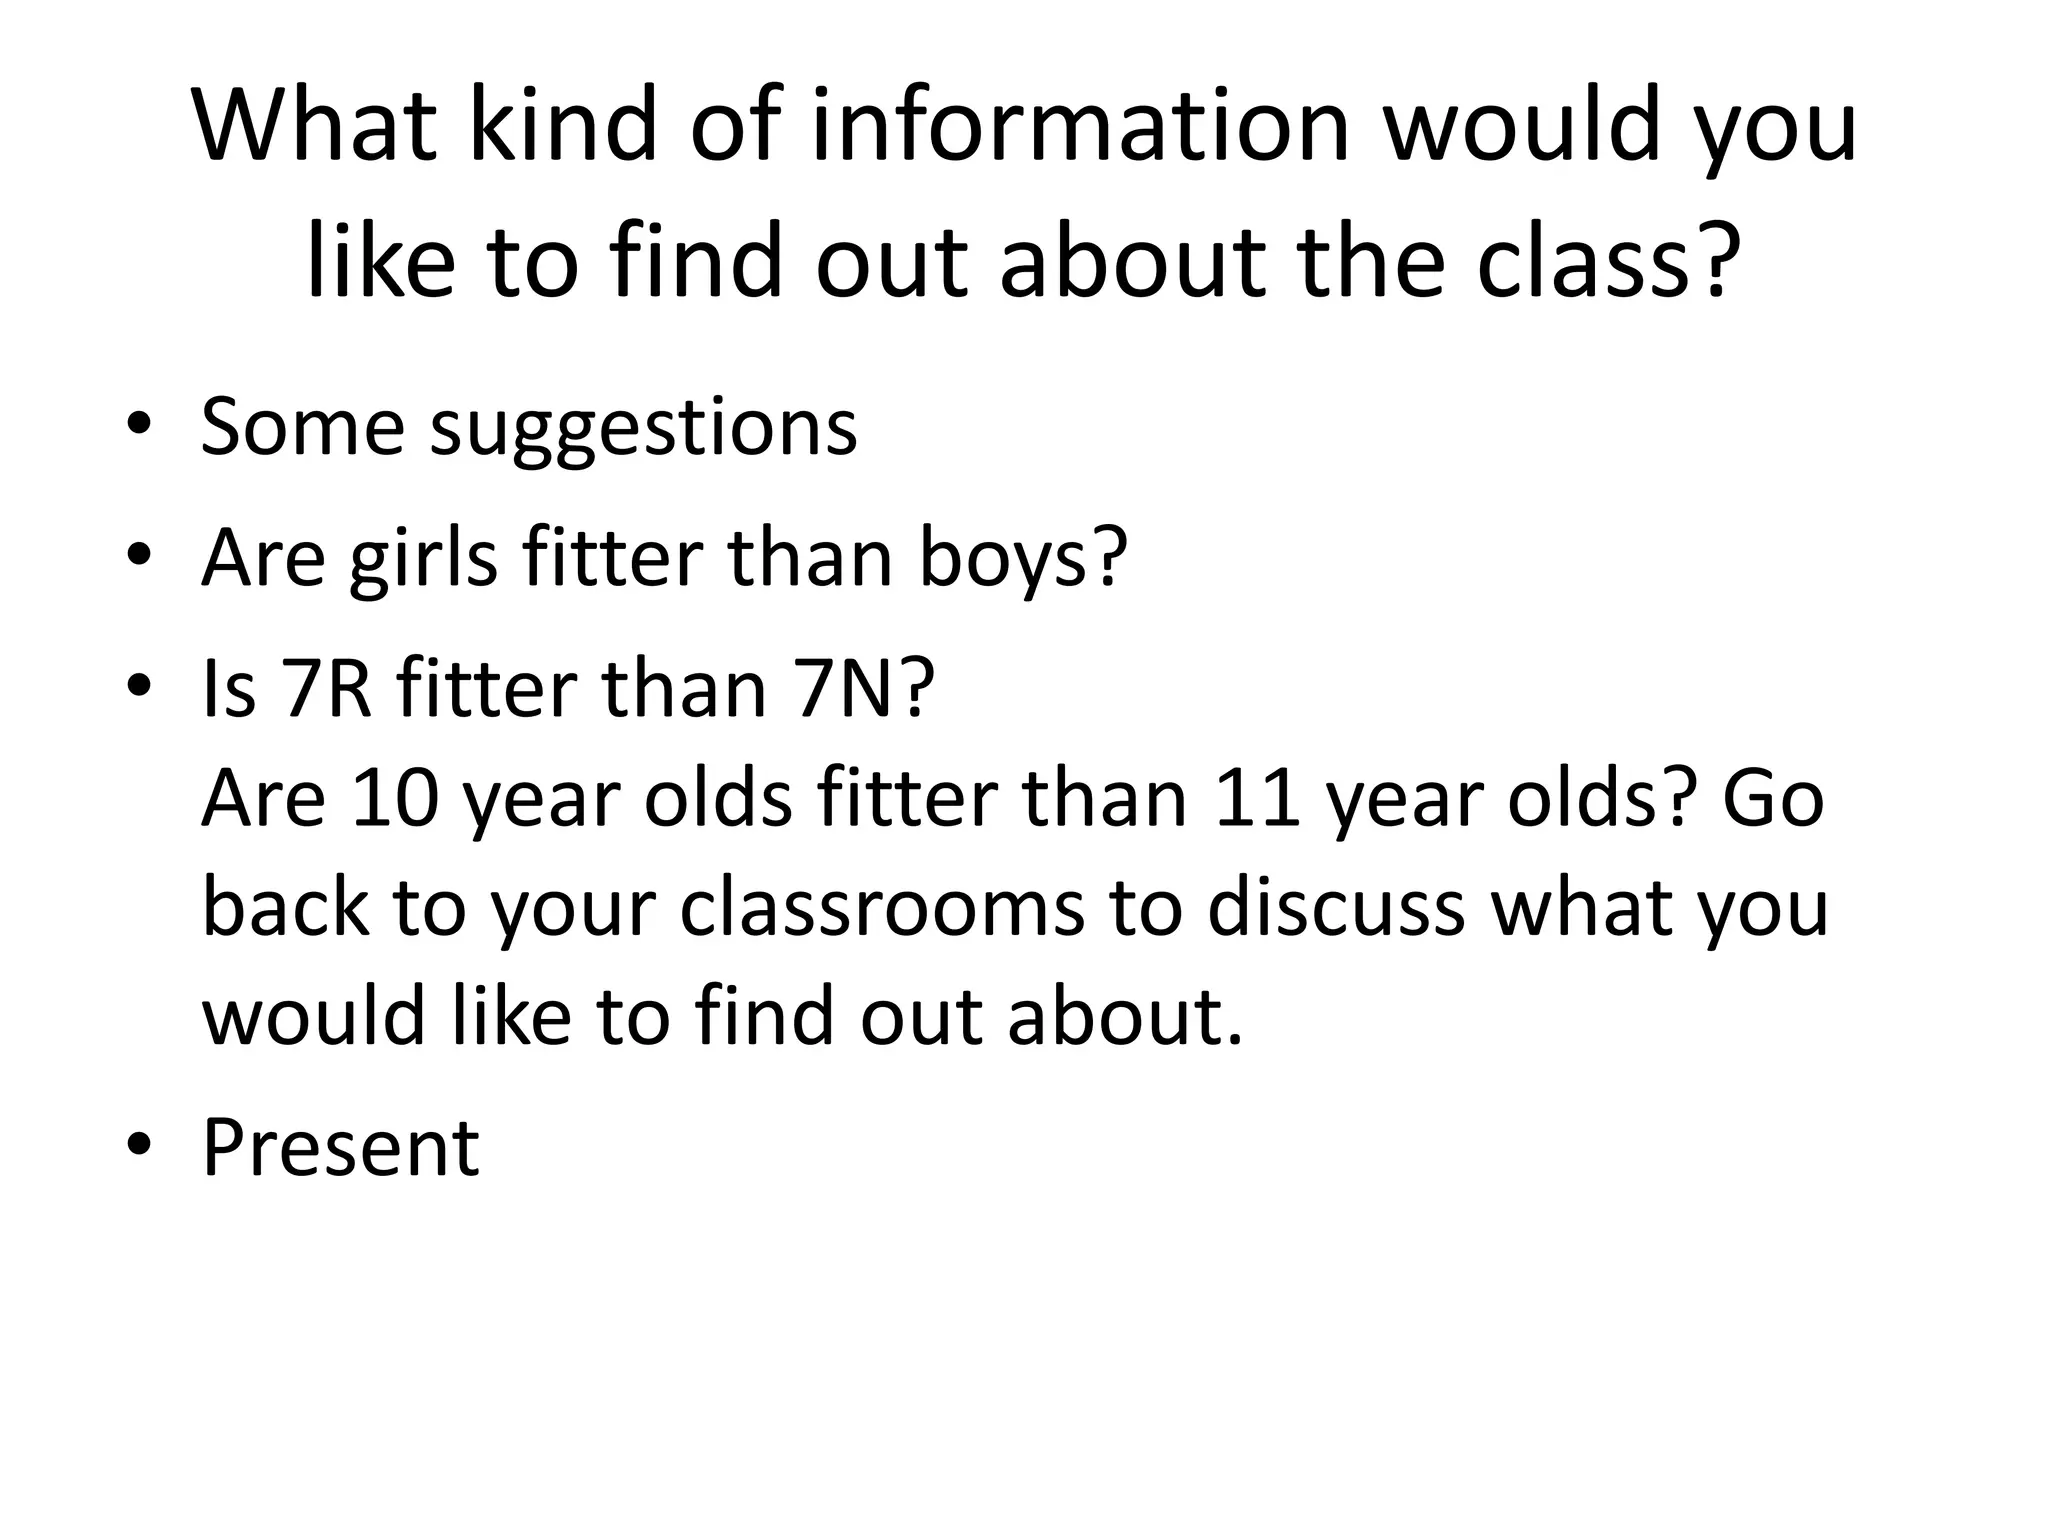
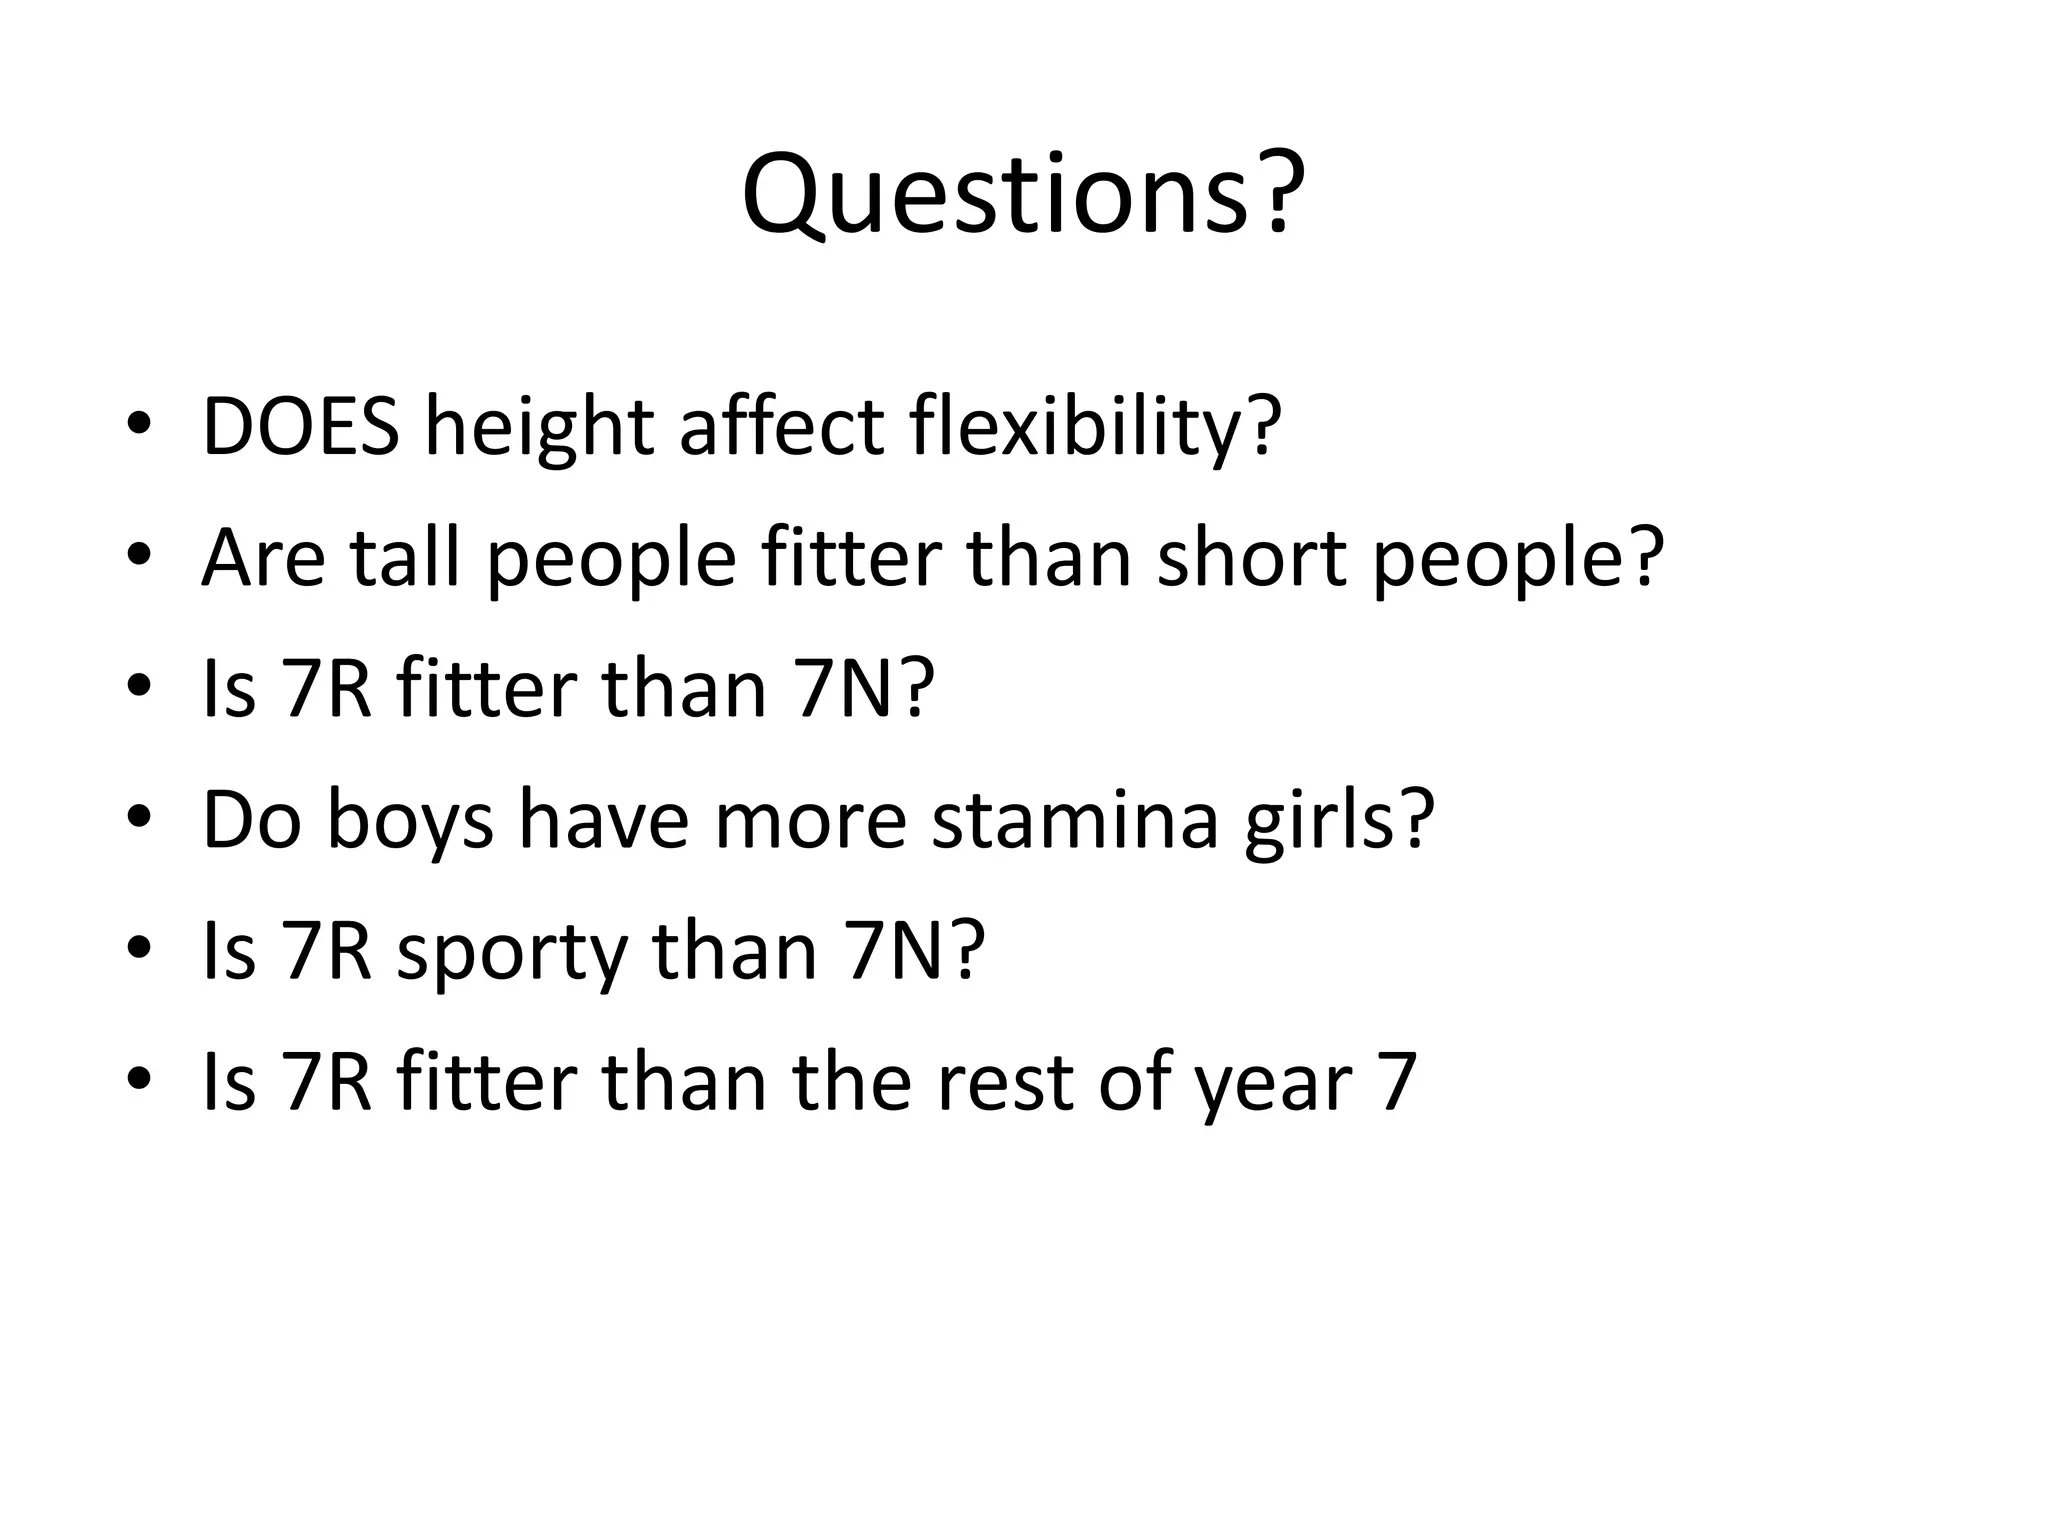
Analysing Our Results From
         Our Tests

     Looking at our data!
What is
Mean, Median,
Mode and
Range?
Give examples
Which is the best
average
Mean, Median
and Mode? Why?
The mean

 The mean is the most commonly used average.
 To calculate the mean of a set of values we add
 together the values and divide by the total number of
 values.
                            Sum of values
                 Mean =   Number of values


 For example, the mean of 3, 6, 7, 9 and 9 is
             3+6+7+9+9                 34
                                  =          = 6.8
                    5                   5
Finding the mode

 The mode or modal value in a set of
 data is the data value that appears the
 most often.
 For example, the number of goals scored
 by the local football team in the last ten
 games is:
   2,       1,      2,       0,       0,         2,    3,   1,     2,          1.

                           The modal score is 2.


   Is it possible to have more than one modal value?                    Yes.


        Is it possible to have no modal value?              Yes.
Finding the median

 The median is the middle value of a set of numbers
 arranged in order. For example:
      Find the median of


        10,            7,    9,    12,        7,     8,   6,


 Write the values in order:

        6,        7,        7,    8,     9,        10,    12.


  The median is the middle value.
Finding the median


 When there is an even number of values, there will be
 two values in the middle.
 In this case, we have to find the mean of the two middle
 values.
            Find the median of 56, 42, 47, 51, 65 and 43.


 The values in order are:

              42,           43,      47,        51,         56,   65.

 There are two middle values, 47 and 51.
Rogue values

 The median is often used when there is a rogue value –
 that is, a value that is much smaller or larger than the
 rest.
                    What is the rogue value in the following data set:
                      192, 183, 201, 177, 193, 197, 4, 186, 179?

 The median of this data set is:

          4, 177, 179, 183, 186, 192, 193, 197, 201.


 The median of the data set is not affected by the rogue value, 4.


 The mean of the data set is 168. This is not representative of the set because it is lower
 than almost all the data values.
Finding the range

 The range of a set of data is a measure of how
 the data is spread across the distribution.
 To find the range we subtract the lowest value in the set
 from the highest value.

            Range = highest value – lowest value


 If the range is small, it tells us that the values are
 similar in size.
 If the range is large, it tells us that the values vary
 widely in size.
Mean or median?

     Would it be better to use the median or the mean to represent the following
                                     data sets?


   34.2, 36.8, 29.7, 356, 42.5, 37.1?                    median


   0.4, 0.5, 0.3, 0.8, 0.7, 1.0?                mean


   892, 954, 1026, 908, 871, 930?                      mean


   3.12, 3.15, 3.23, 9.34, 3.16, 3.20?                   median


   97.85, 95.43, 102.45, 98.02, 97.92, 99.38?                         mean


   87634, 9321, 78265, 83493, 91574, 90046?                             median
Mean, Median or Mode?


   Transport   Car   Train   Bus   Tram
   Number of 8       5       13    5
   people
Mean, Median or Mode?
Problem 2
Calculating the mean using a spreadsheet

 When processing large amounts of data it is often helpful to use a spreadsheet to
 help us calculate the mean.


 For example, 500 households were asked how many children under the age of 16
 lived in the home. The results were collected in a spreadsheet.
How do we Measure Health and
          Fitness?
The tests
Beep test
                                  Ruler Drop test


Vertical Jump test


                                    Sit & Reach test

       Standing Broad Jump test
What kind of information would you
  like to find out about the class?
• Some suggestions
• Are girls fitter than boys?
• Is 7R fitter than 7N?
  Are 10 year olds fitter than 11 year olds? Go
  back to your classrooms to discuss what you
  would like to find out about.
• Present
Questions?
•   DOES height affect flexibility?
•   Are tall people fitter than short people?
•   Is 7R fitter than 7N?
•   Do boys have more stamina girls?
•   Is 7R sporty than 7N?
•   Is 7R fitter than the rest of year 7

Analysing our results

  • 1.
    Analysing Our ResultsFrom Our Tests Looking at our data!
  • 2.
    What is Mean, Median, Modeand Range? Give examples
  • 3.
    Which is thebest average Mean, Median and Mode? Why?
  • 4.
    The mean Themean is the most commonly used average. To calculate the mean of a set of values we add together the values and divide by the total number of values. Sum of values Mean = Number of values For example, the mean of 3, 6, 7, 9 and 9 is 3+6+7+9+9 34 = = 6.8 5 5
  • 5.
    Finding the mode The mode or modal value in a set of data is the data value that appears the most often. For example, the number of goals scored by the local football team in the last ten games is: 2, 1, 2, 0, 0, 2, 3, 1, 2, 1. The modal score is 2. Is it possible to have more than one modal value? Yes. Is it possible to have no modal value? Yes.
  • 6.
    Finding the median The median is the middle value of a set of numbers arranged in order. For example: Find the median of 10, 7, 9, 12, 7, 8, 6, Write the values in order: 6, 7, 7, 8, 9, 10, 12. The median is the middle value.
  • 7.
    Finding the median When there is an even number of values, there will be two values in the middle. In this case, we have to find the mean of the two middle values. Find the median of 56, 42, 47, 51, 65 and 43. The values in order are: 42, 43, 47, 51, 56, 65. There are two middle values, 47 and 51.
  • 8.
    Rogue values Themedian is often used when there is a rogue value – that is, a value that is much smaller or larger than the rest. What is the rogue value in the following data set: 192, 183, 201, 177, 193, 197, 4, 186, 179? The median of this data set is: 4, 177, 179, 183, 186, 192, 193, 197, 201. The median of the data set is not affected by the rogue value, 4. The mean of the data set is 168. This is not representative of the set because it is lower than almost all the data values.
  • 9.
    Finding the range The range of a set of data is a measure of how the data is spread across the distribution. To find the range we subtract the lowest value in the set from the highest value. Range = highest value – lowest value If the range is small, it tells us that the values are similar in size. If the range is large, it tells us that the values vary widely in size.
  • 10.
    Mean or median? Would it be better to use the median or the mean to represent the following data sets? 34.2, 36.8, 29.7, 356, 42.5, 37.1? median 0.4, 0.5, 0.3, 0.8, 0.7, 1.0? mean 892, 954, 1026, 908, 871, 930? mean 3.12, 3.15, 3.23, 9.34, 3.16, 3.20? median 97.85, 95.43, 102.45, 98.02, 97.92, 99.38? mean 87634, 9321, 78265, 83493, 91574, 90046? median
  • 11.
    Mean, Median orMode? Transport Car Train Bus Tram Number of 8 5 13 5 people
  • 12.
    Mean, Median orMode? Problem 2
  • 13.
    Calculating the meanusing a spreadsheet When processing large amounts of data it is often helpful to use a spreadsheet to help us calculate the mean. For example, 500 households were asked how many children under the age of 16 lived in the home. The results were collected in a spreadsheet.
  • 14.
    How do weMeasure Health and Fitness?
  • 15.
    The tests Beep test Ruler Drop test Vertical Jump test Sit & Reach test Standing Broad Jump test
  • 16.
    What kind ofinformation would you like to find out about the class? • Some suggestions • Are girls fitter than boys? • Is 7R fitter than 7N? Are 10 year olds fitter than 11 year olds? Go back to your classrooms to discuss what you would like to find out about. • Present
  • 17.
    Questions? • DOES height affect flexibility? • Are tall people fitter than short people? • Is 7R fitter than 7N? • Do boys have more stamina girls? • Is 7R sporty than 7N? • Is 7R fitter than the rest of year 7