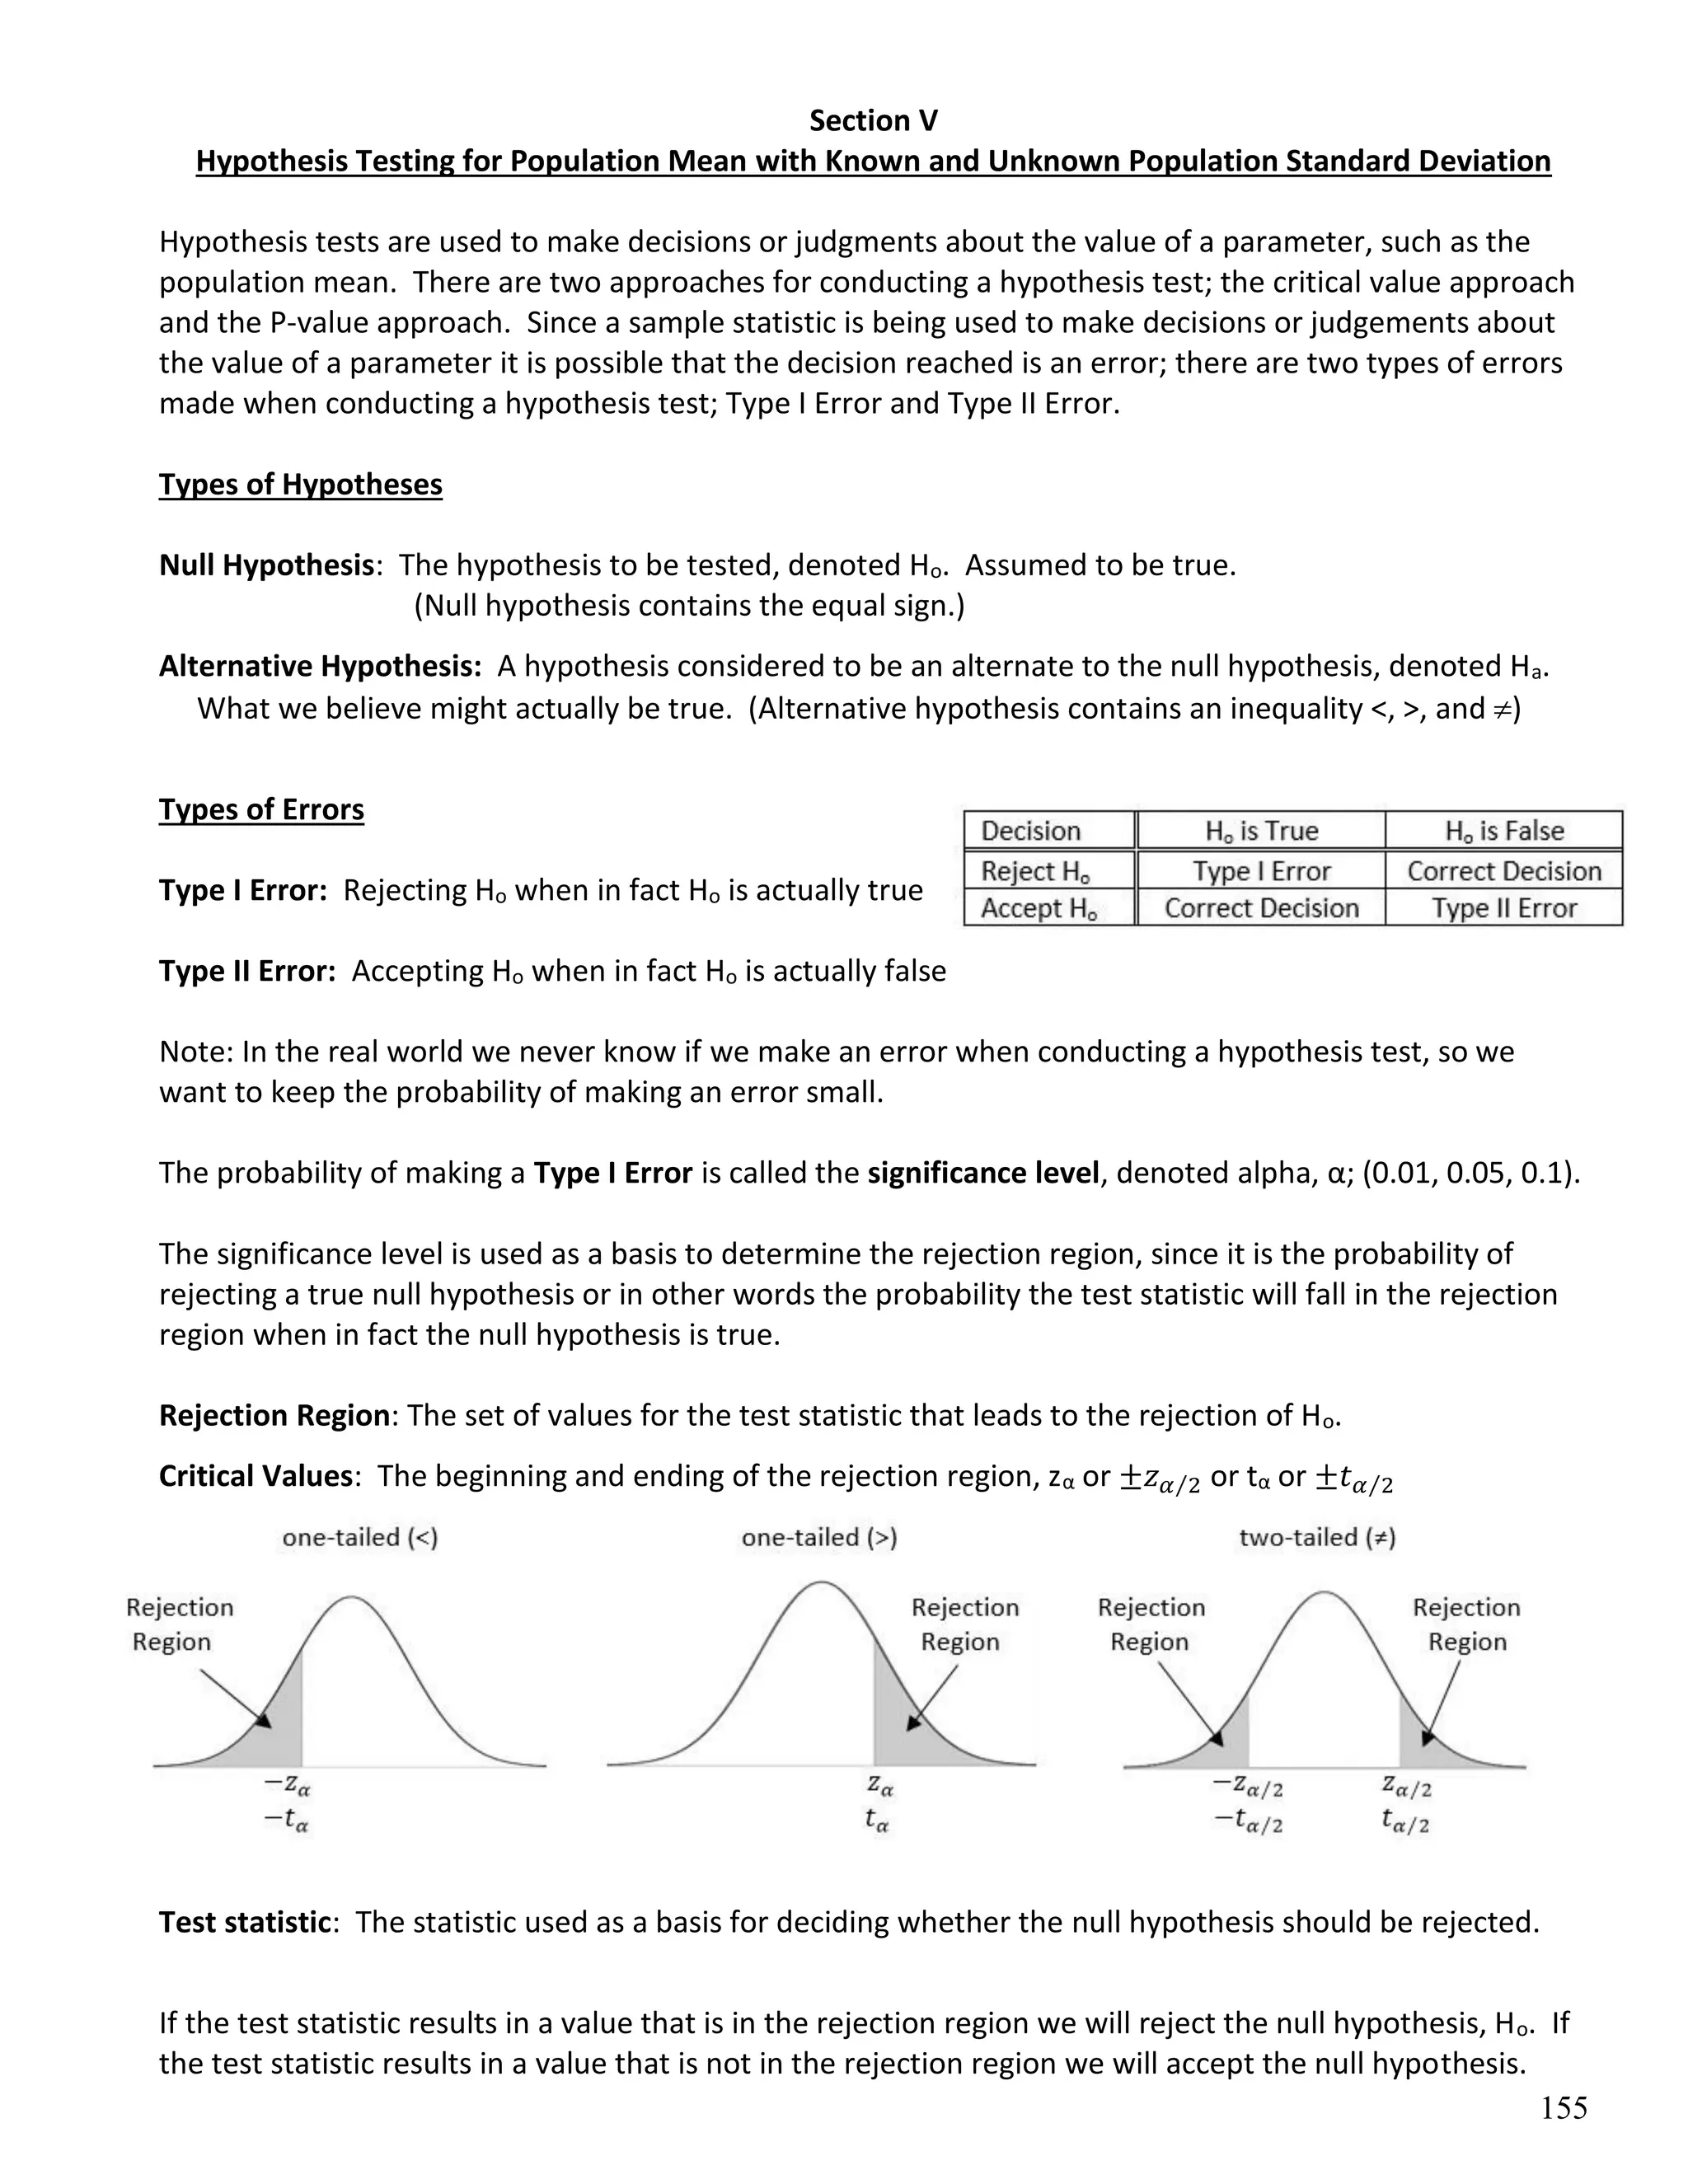
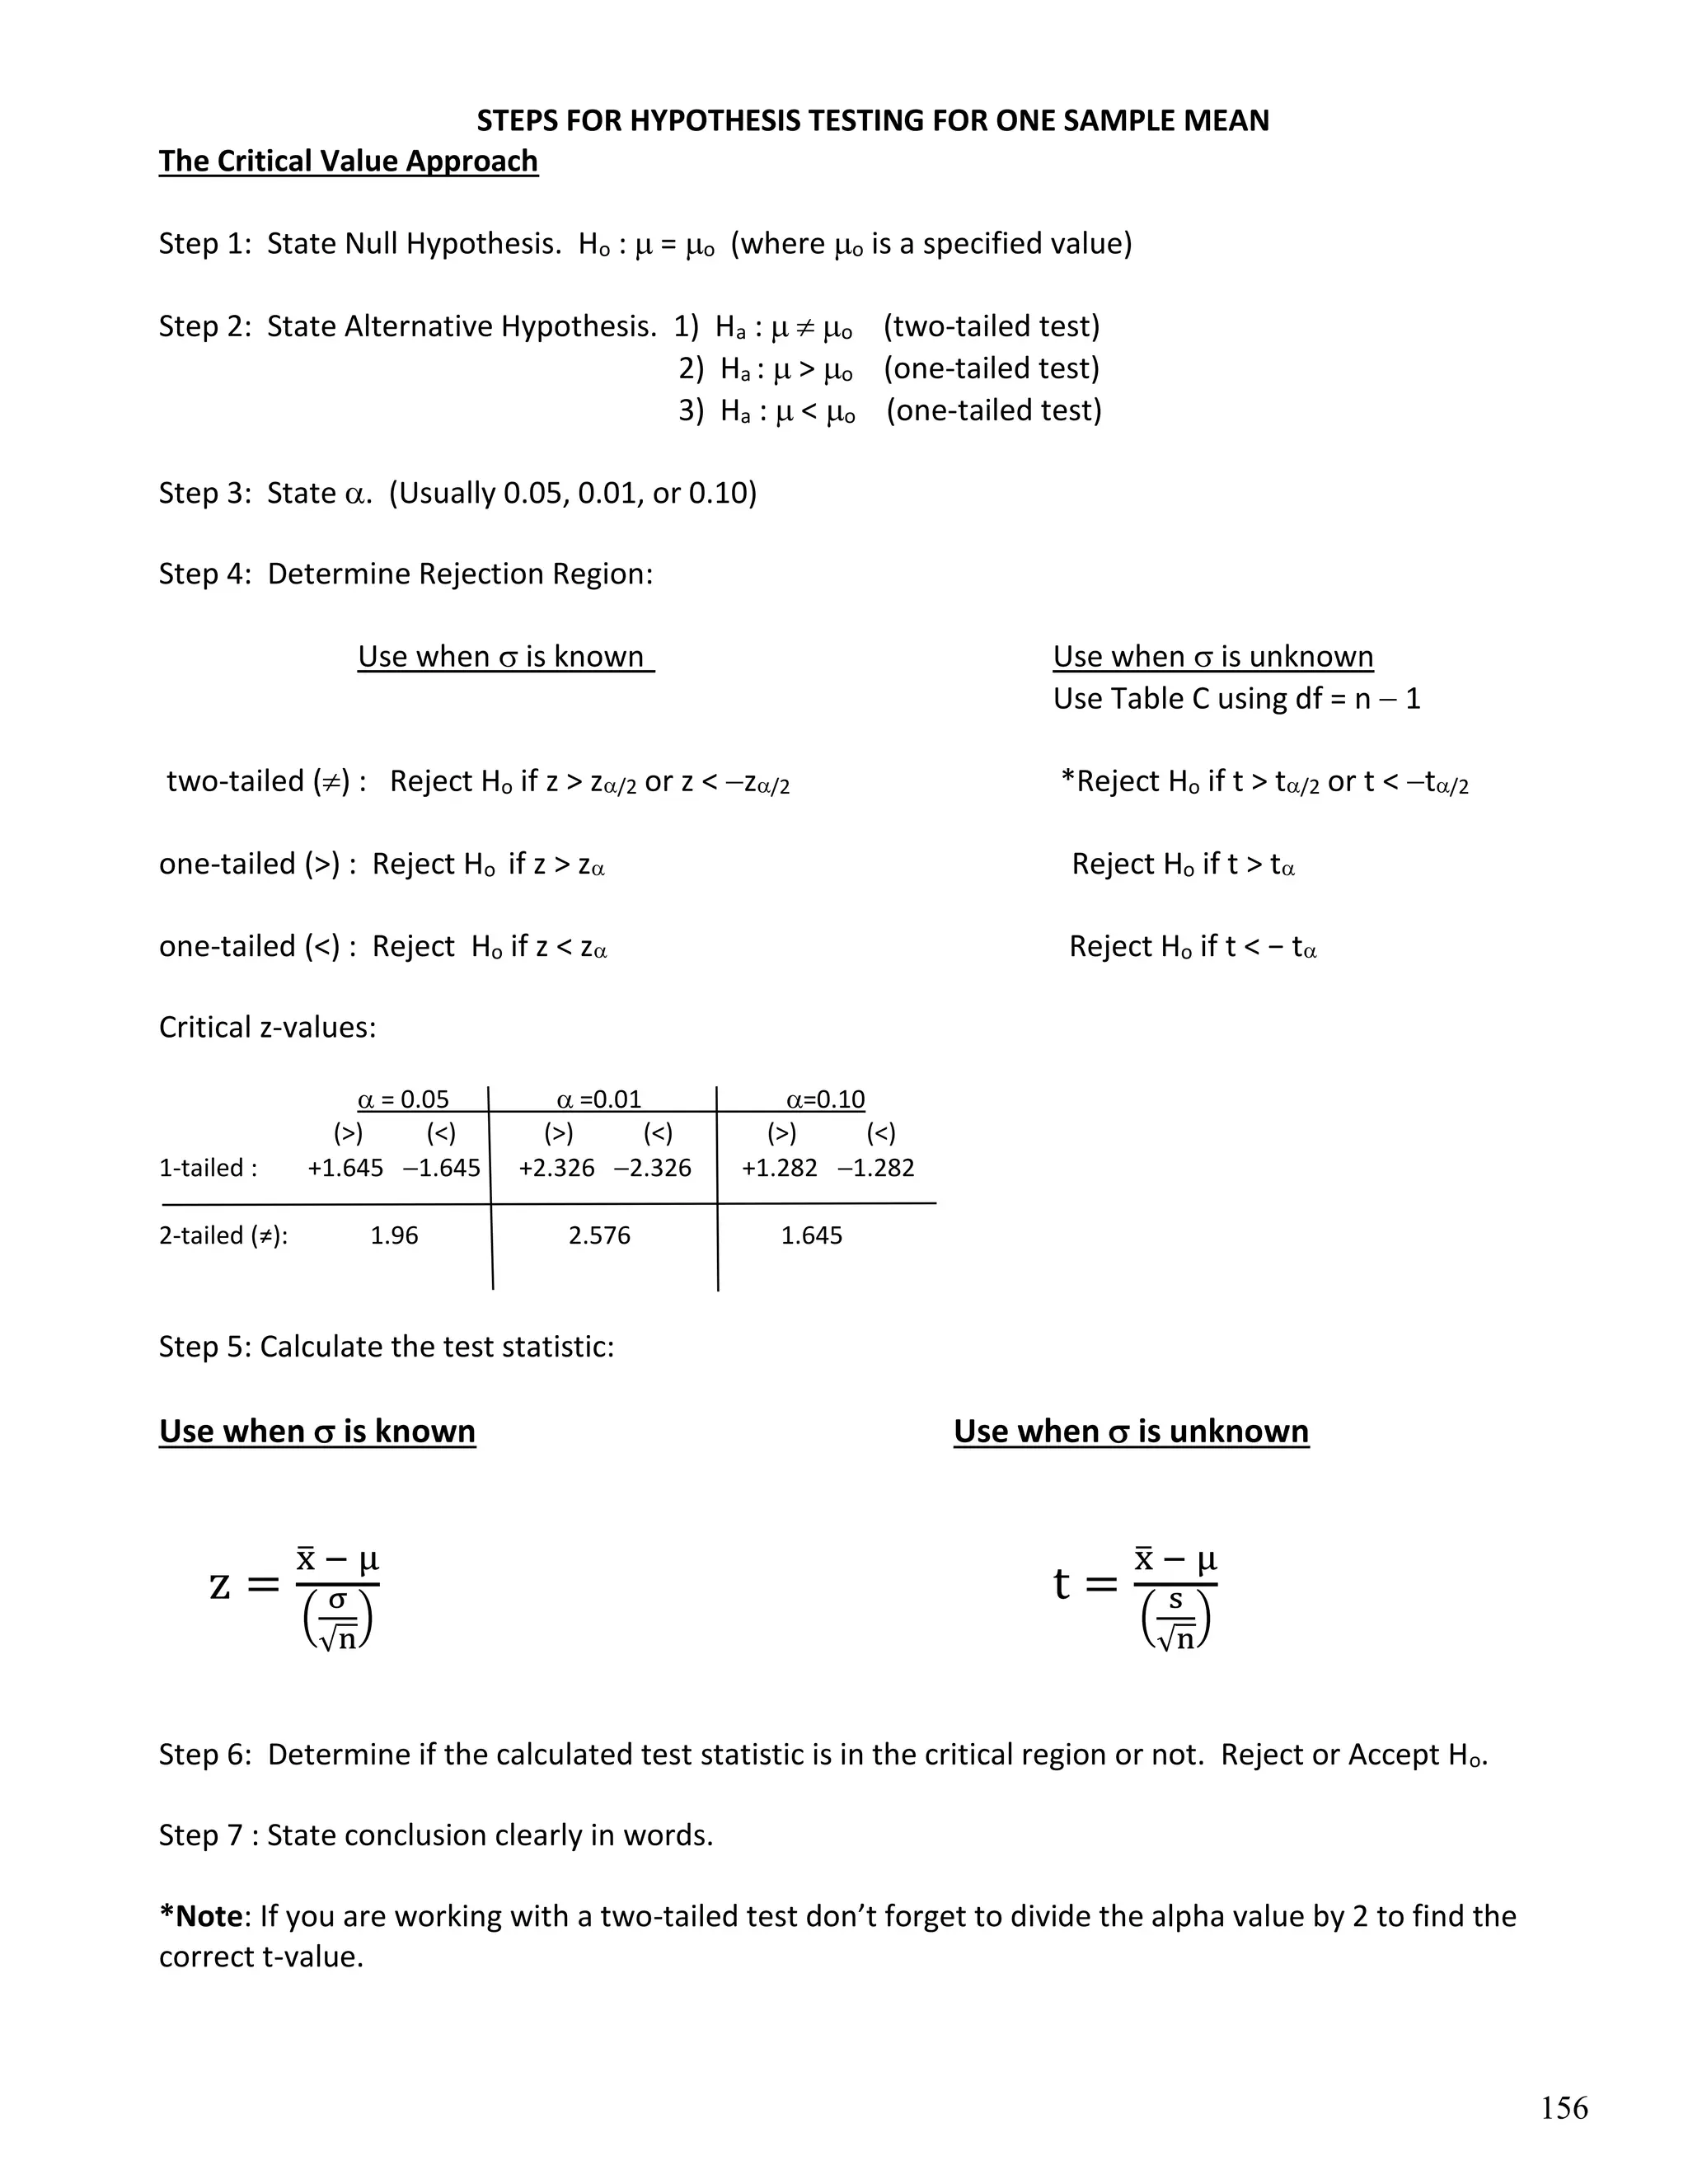
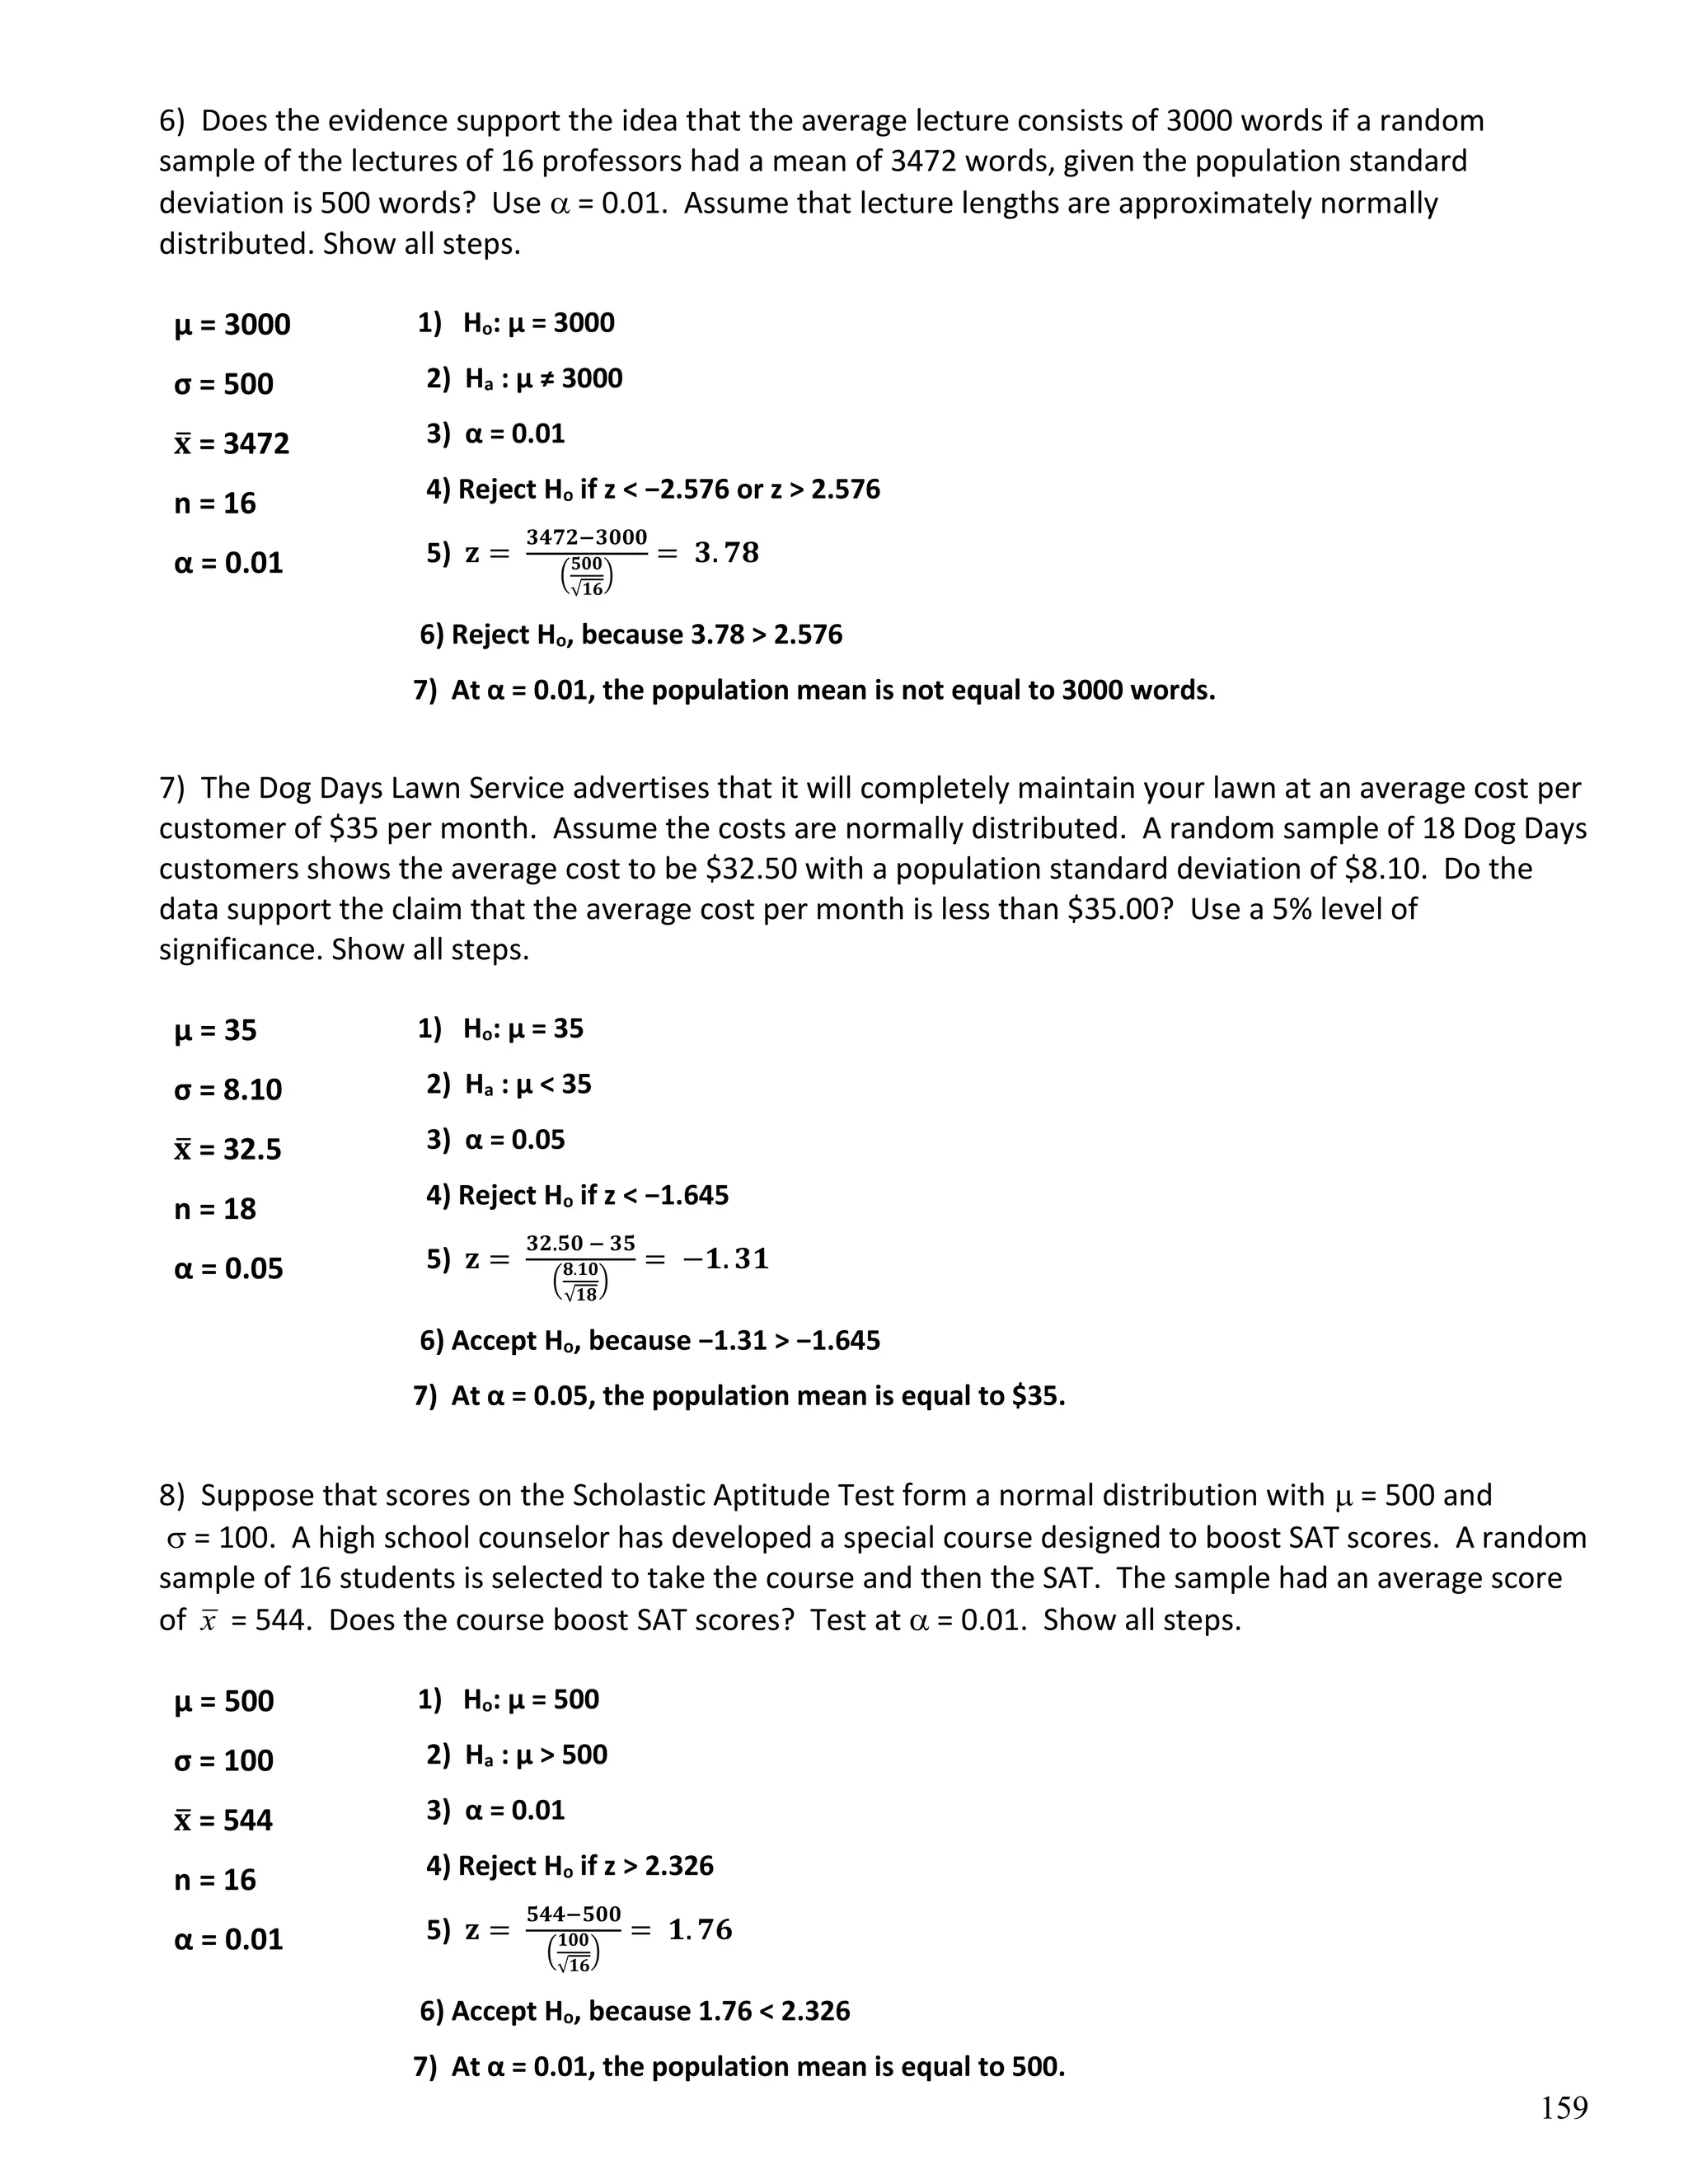
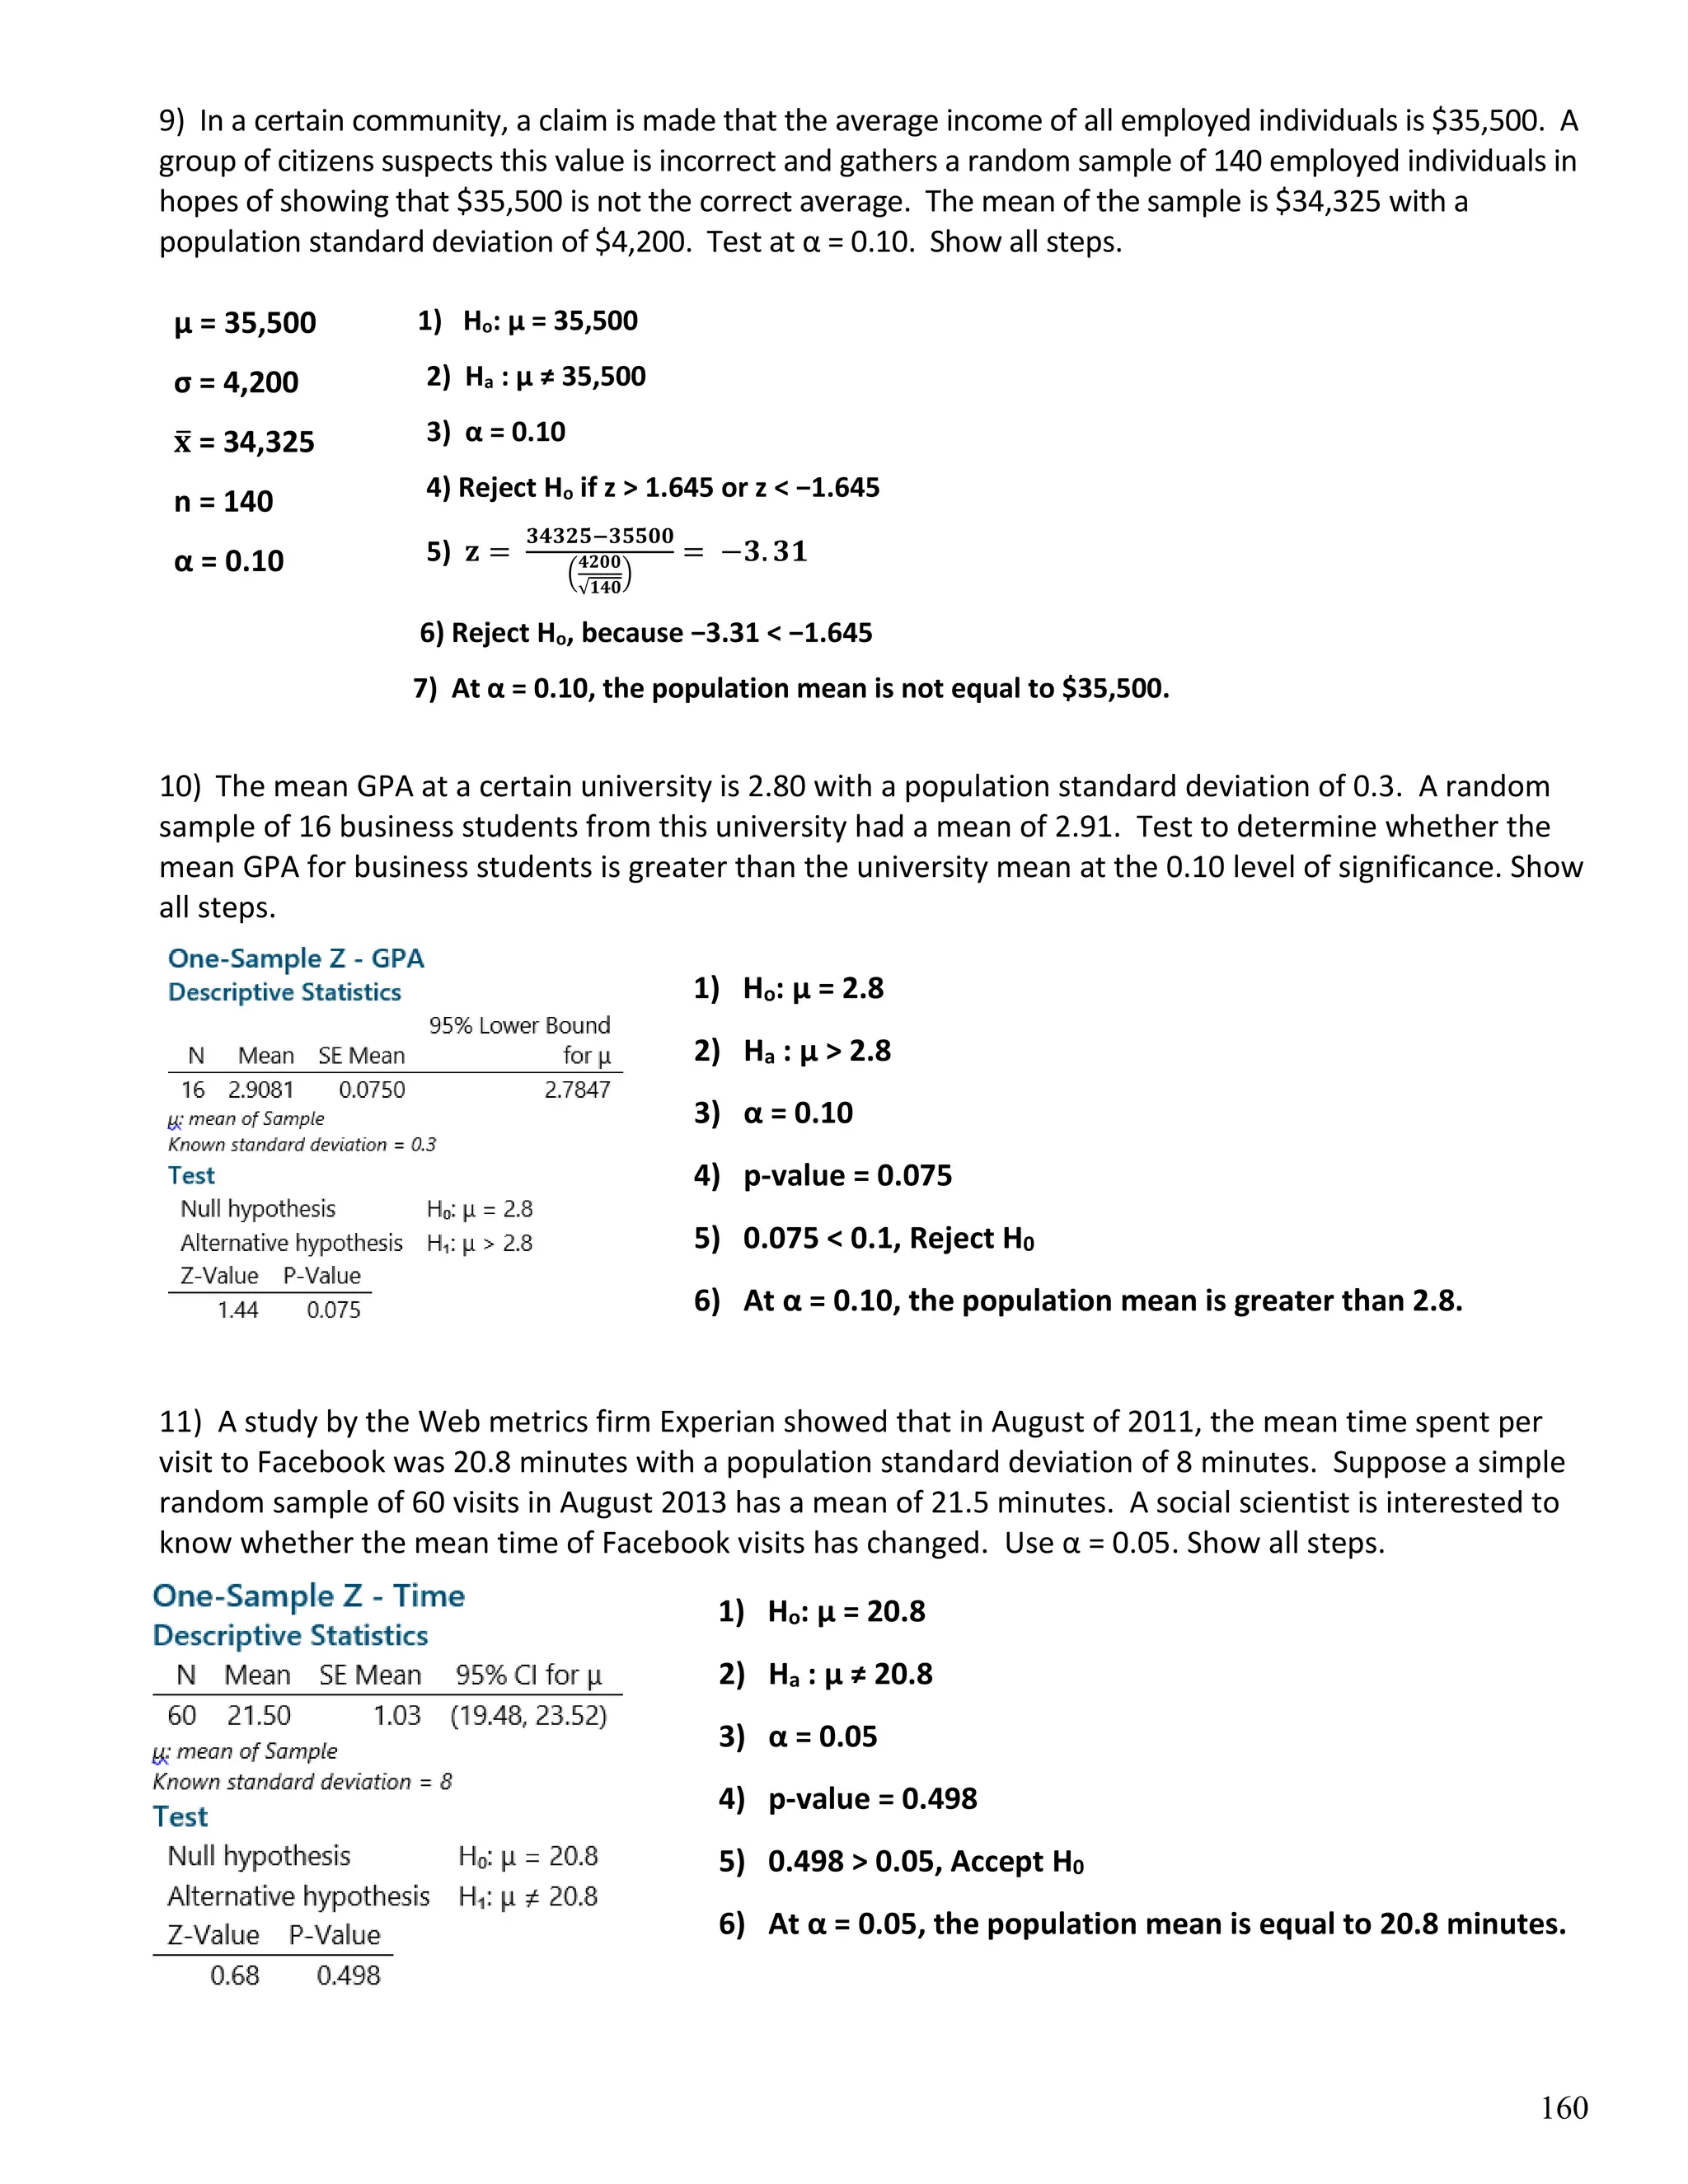
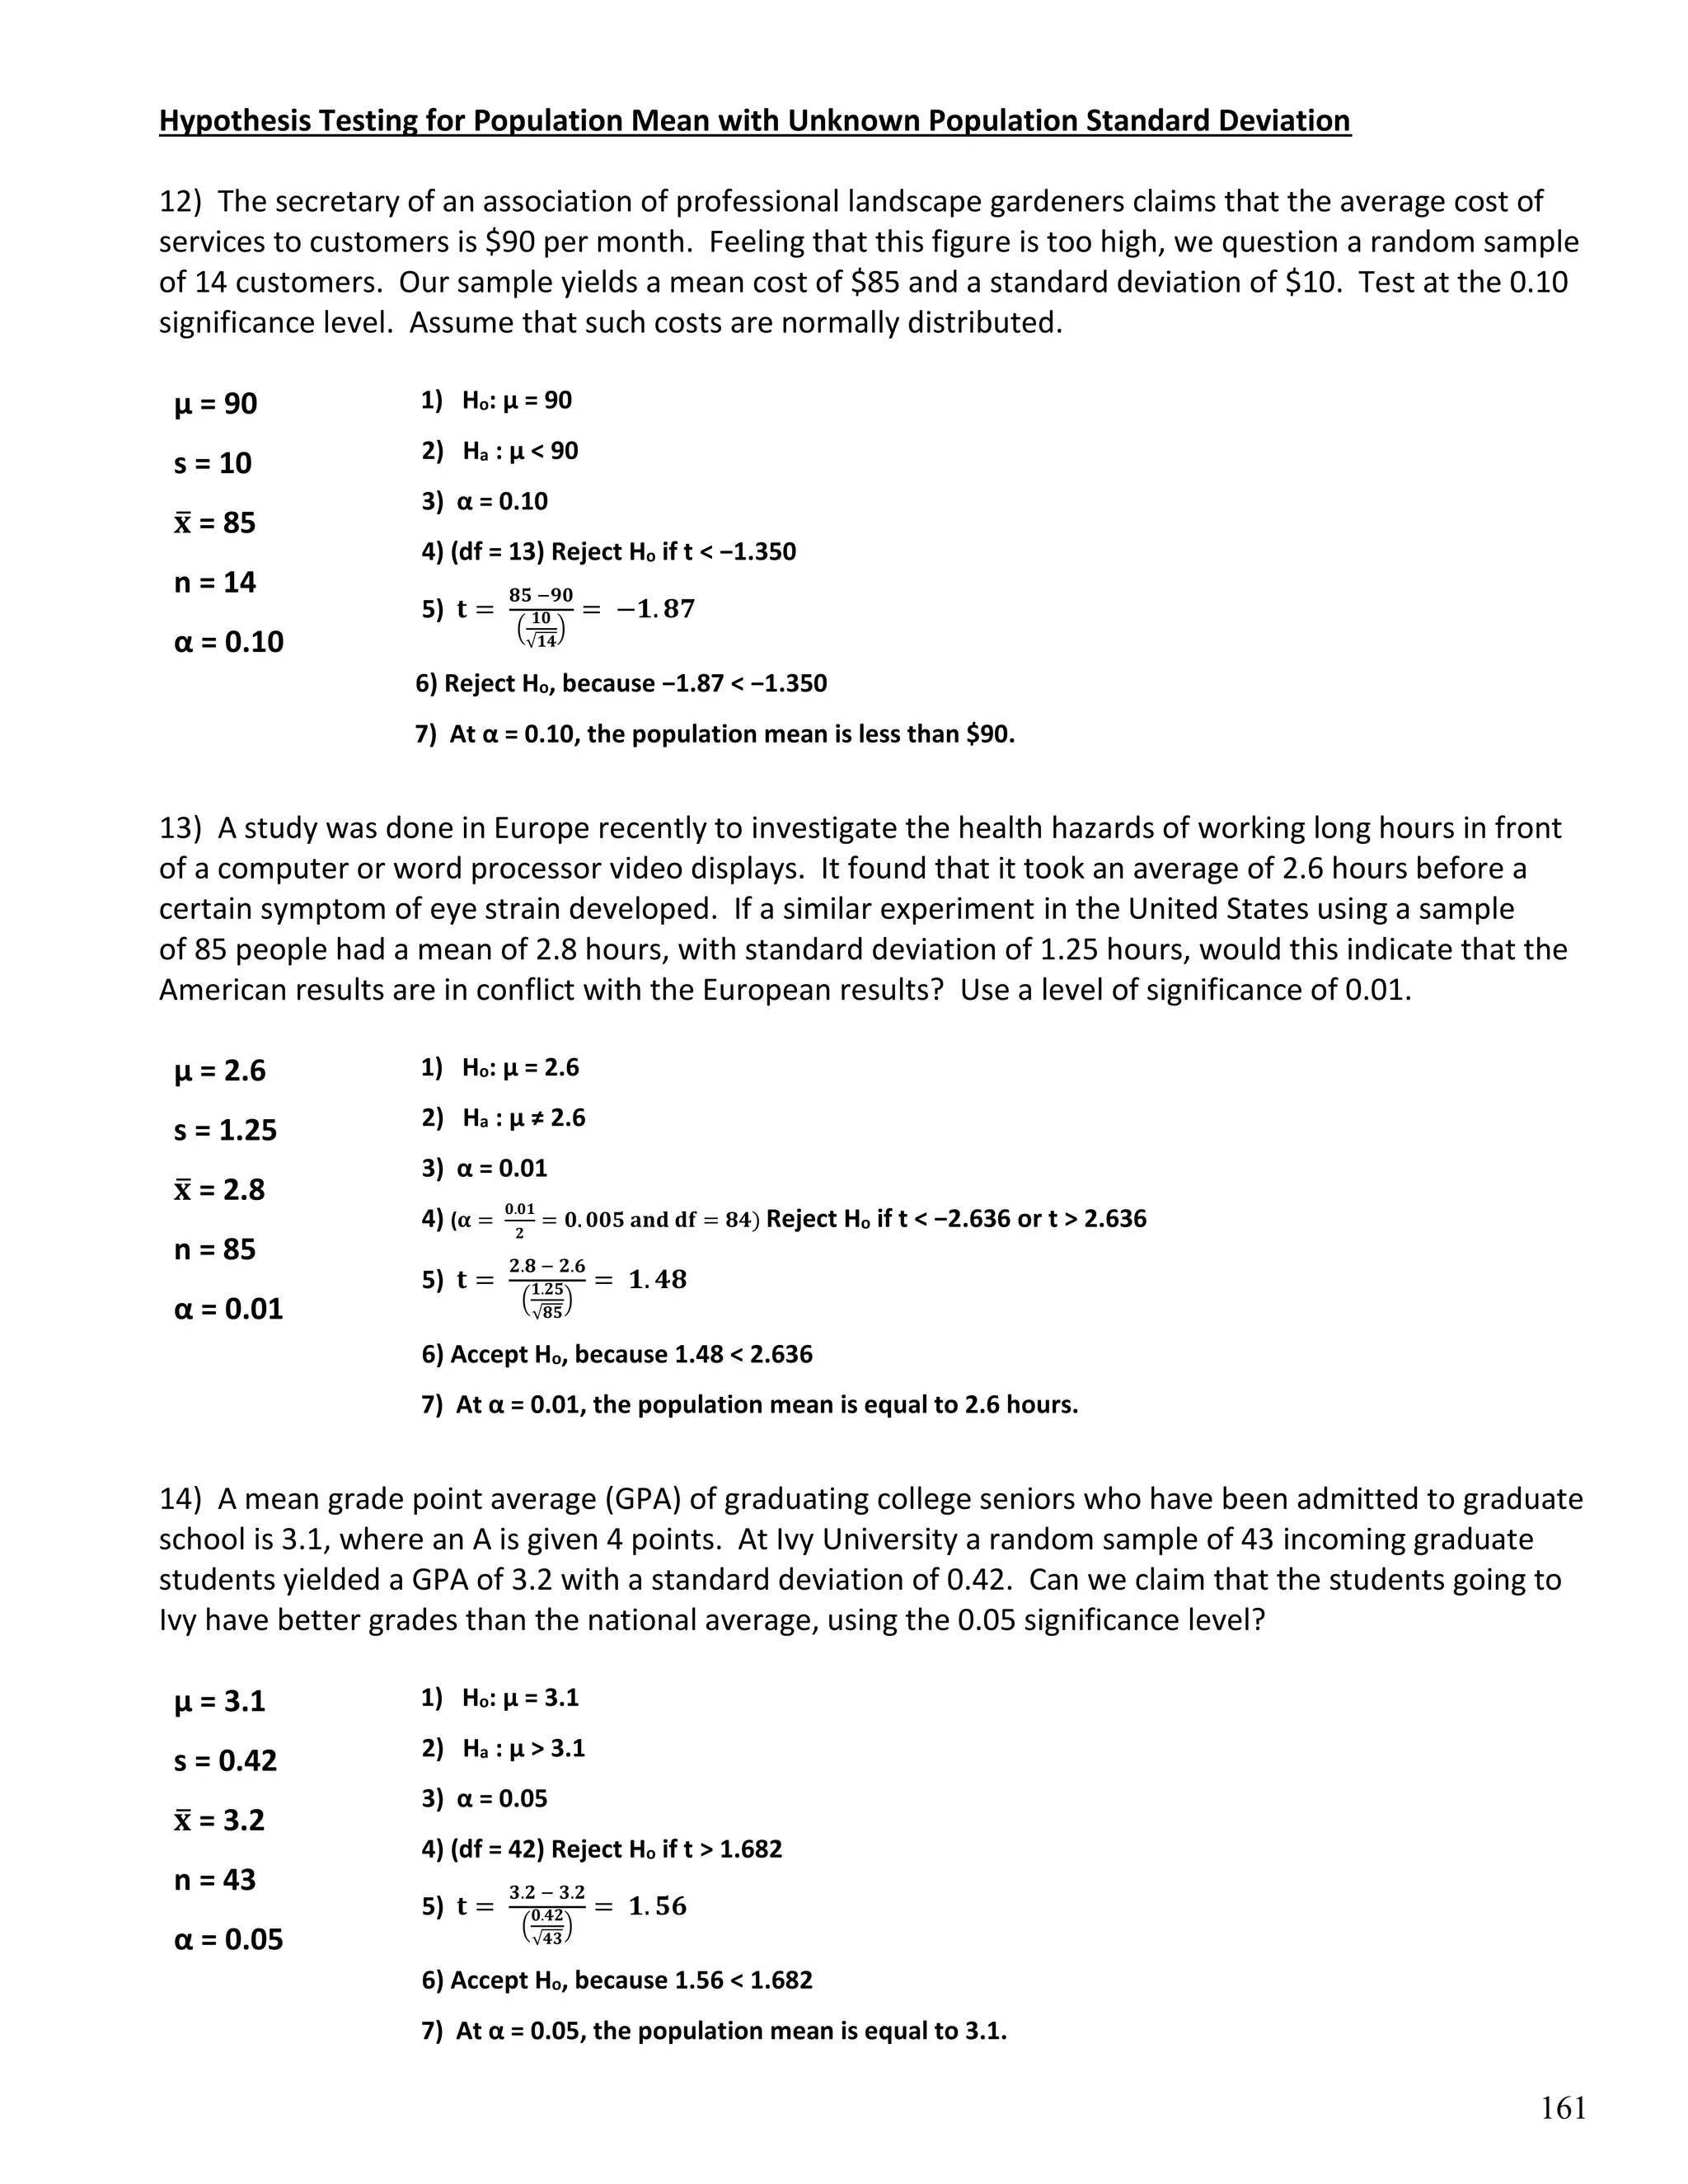
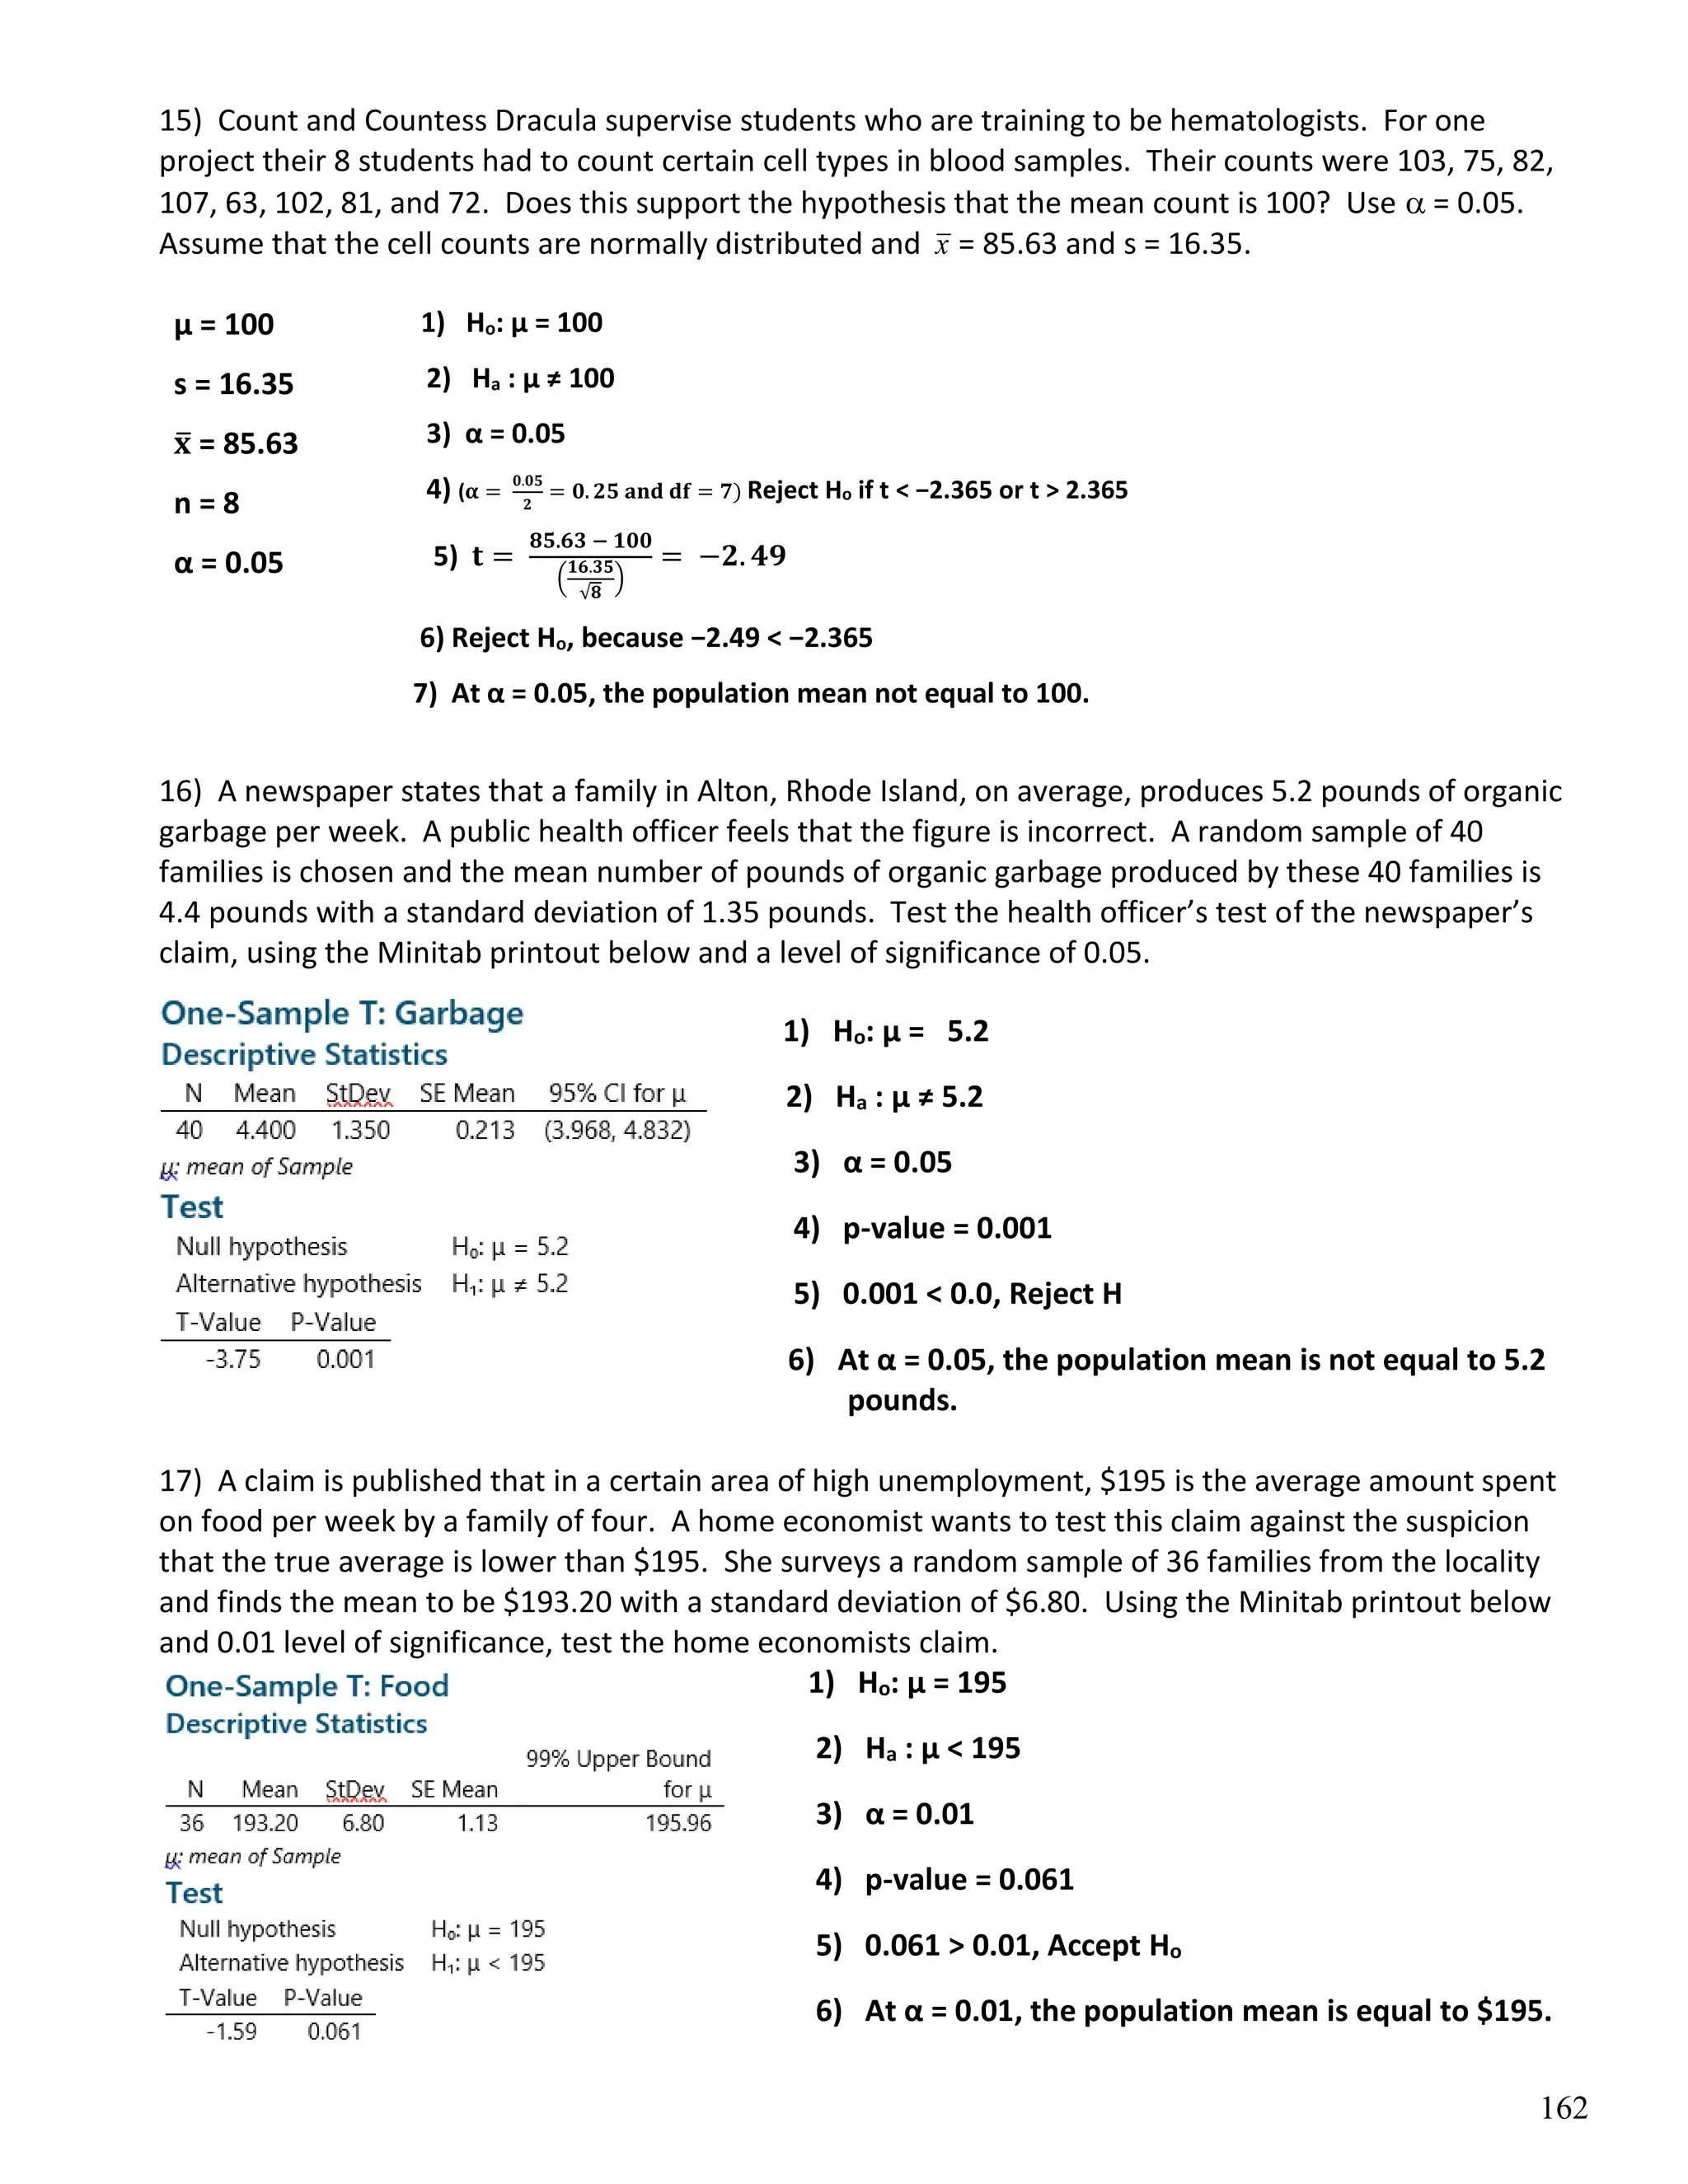
155
Section V
Hypothesis Testing for Population Mean with Known and Unknown Population Standard Deviation
Hypothesis tests are used to make decisions or judgments about the value of a parameter, such as the
population mean. There are two approaches for conducting a hypothesis test; the critical value approach
and the P-value approach. Since a sample statistic is being used to make decisions or judgements about
the value of a parameter it is possible that the decision reached is an error; there are two types of errors
made when conducting a hypothesis test; Type I Error and Type II Error.
Types of Hypotheses
Null Hypothesis: The hypothesis to be tested, denoted Ho. Assumed to be true.
(Null hypothesis contains the equal sign.)
Alternative Hypothesis: A hypothesis considered to be an alternate to the null hypothesis, denoted Ha.
What we believe might actually be true. (Alternative hypothesis contains an inequality <, >, and )
Types of Errors
Type I Error: Rejecting Ho when in fact Ho is actually true
Type II Error: Accepting Ho when in fact Ho is actually false
Note: In the real world we never know if we make an error when conducting a hypothesis test, so we
want to keep the probability of making an error small.
The probability of making a Type I Error is called the significance level, denoted alpha, α; (0.01, 0.05, 0.1).
The significance level is used as a basis to determine the rejection region, since it is the probability of
rejecting a true null hypothesis or in other words the probability the test statistic will fall in the rejection
region when in fact the null hypothesis is true.
Rejection Region: The set of values for the test statistic that leads to the rejection of Ho.
Critical Values: The beginning and ending of the rejection region, zα or ±𝑧𝛼 2
⁄ or tα or ±𝑡𝛼 2
⁄
Test statistic: The statistic used as a basis for deciding whether the null hypothesis should be rejected.
If the test statistic results in a value that is in the rejection region we will reject the null hypothesis, Ho. If
the test statistic results in a value that is not in the rejection region we will accept the null hypothesis.
156
STEPS FOR HYPOTHESIS TESTING FOR ONE SAMPLE MEAN
The Critical Value Approach
Step 1: State Null Hypothesis. Ho :  = o (where o is a specified value)
Step 2: State Alternative Hypothesis. 1) Ha :   o (two-tailed test)
2) Ha :  > o (one-tailed test)
3) Ha :  < o (one-tailed test)
Step 3: State . (Usually 0.05, 0.01, or 0.10)
Step 4: Determine Rejection Region:
Use when  is known Use when  is unknown
Use Table C using df = n  1
two-tailed () : Reject Ho if z > z/2 or z < z/2 *Reject Ho if t > t/2 or t < t/2
one-tailed (>) : Reject Ho if z > z Reject Ho if t > t
one-tailed (<) : Reject Ho if z < z Reject Ho if t < − t
Critical z-values:
 = 0.05  =0.01 =0.10
(>) (<) (>) (<) (>) (<)
1-tailed : +1.645 1.645 +2.326 2.326 +1.282 1.282
2-tailed (≠): 1.96 2.576 1.645
Step 5: Calculate the test statistic:
Use when  is known Use when  is unknown
z =
x
̅ − μ
(
σ
√n
)
t =
x
̅ − μ
(
s
√n
)
Step 6: Determine if the calculated test statistic is in the critical region or not. Reject or Accept Ho.
Step 7 : State conclusion clearly in words.
*Note: If you are working with a two-tailed test don’t forget to divide the alpha value by 2 to find the
correct t-value.
157
P-value approach to hypothesis testing: P-value is the probability of observing a value of the test statistic
as extreme or more extreme than that observed, assuming Ho is true.
One Tailed (>): P(z > zo) = P-value, (<) P(z < zo) = P-value, Two Tailed (): 2P(z > zo) = P-value
Therefore, if the P-value is less than the significance level you would reject the null hypothesis and if the
P-value is greater than the significance level you would accept the null hypothesis.
The P-value Approach – Use when you are given a Minitab Printout
Step 1: State Null Hypothesis. Ho :  = o (where o is a specified value)
Step 2: State Alternative Hypothesis. 1) Ha :   o (two-tailed test)
2) Ha :  > o (one-tailed test)
3) Ha :  < o (one-tailed test)
Step 3: State . (Usually 0.05, 0.01, or 0.10)
Step 4: Determine p-value from Minitab printout
Step 5: Compare the p-value with the α value; If P−value   reject Ho, otherwise accept Ho.
Step 6: State your conclusion in words.
Examples of Type I and Type II Errors
1) According to popcorn.org, the mean consumption of popcorn annually by Americans is 54 quarts. The
marketing division of popcorn.org unleashes an aggressive campaign designed to get Americans to
consume even more popcorn. The hypotheses are:
Ho :  = 54 quarts
Ha :  > 54 quarts
Suppose that the results of sampling lead to non-rejection of the null hypothesis. Classify that conclusion
as a Type I Error, a Type II Error, or a correct decision, if in fact the average popcorn consumption by
Americans has increased.
Type II Error
2) The mean score on the SAT Math Reasoning exam is 516. A test preparation company states that the
mean score of students who take its course is higher than 516. The hypotheses are:
Ho :  = 516
Ha :  > 516
Suppose that the results of sampling lead to rejection of the null hypothesis. Classify that conclusion as a
Type I Error, a Type II Error, or a correct decision, if in fact the average SAT score has increased.
Correct Decision
158
3) According to the CTIA-The Wireless Association, the mean monthly cell phone bill was $95 in 2013. A
researcher suspects the mean monthly cell phone bill is different today. The hypotheses are:
Ho :  = $95
Ha :   $95
Suppose that the results of the sampling lead to rejection of the null hypothesis. Classify that conclusion
as a Type I Error, a Type II Error, or a correct decision, if in fact the mean cell phone bill is not different
than in 2013.
Type I Error
4) According to the National Association of Home Builders, the mean price of an existing single-family
home in 2009 was $238,600. A real estate broker believes that the mean price has decreased since then.
The hypotheses are:
Ho :  = $238,600
Ha :  < $238,600
Suppose that the results of the sampling lead to non-rejection of the null hypothesis. Classify that
conclusion as a Type I Error, a Type II Error, or a correct decision, if in fact the mean the mean price has
not decreased since 2009.
Correct Decision
Hypothesis Testing for Population Mean with Known Population Standard Deviation
5) Jim Nasium claims that the mean A.C.T. score attained by two year college students is 22.
Al Dente suspects this claim is too low and selects a random sample of 121 two year college students. The
mean of the sample is 23.3 and the population standard deviation is assumed to be 3.3. Test at the 5%
significance level. Show all steps.
1) Ho: µ = 22
2) Ha : µ > 22
3) α = 0.05
4) Reject Ho if z > 1.645
5) 𝐳 =
𝟐𝟑.𝟑 − 𝟐𝟐
(
𝟑.𝟑
√𝟏𝟐𝟏
)
= 𝟒. 𝟑𝟑
6) Reject Ho, because 4.33 > 1.645
7) At α = 0.05, the population mean is greater than 22.
µ = 22
σ = 3.3
𝐱
̅ = 23.3
n = 121
α = 0.05
159
6) Does the evidence support the idea that the average lecture consists of 3000 words if a random
sample of the lectures of 16 professors had a mean of 3472 words, given the population standard
deviation is 500 words? Use  = 0.01. Assume that lecture lengths are approximately normally
distributed. Show all steps.
1) Ho: µ = 3000
2) Ha : µ ≠ 3000
3) α = 0.01
4) Reject Ho if z < −2.576 or z > 2.576
5) 𝐳 =
𝟑𝟒𝟕𝟐−𝟑𝟎𝟎𝟎
(
𝟓𝟎𝟎
√𝟏𝟔
)
= 𝟑. 𝟕𝟖
6) Reject Ho, because 3.78 > 2.576
7) At α = 0.01, the population mean is not equal to 3000 words.
7) The Dog Days Lawn Service advertises that it will completely maintain your lawn at an average cost per
customer of $35 per month. Assume the costs are normally distributed. A random sample of 18 Dog Days
customers shows the average cost to be $32.50 with a population standard deviation of $8.10. Do the
data support the claim that the average cost per month is less than $35.00? Use a 5% level of
significance. Show all steps.
1) Ho: µ = 35
2) Ha : µ < 35
3) α = 0.05
4) Reject Ho if z < −1.645
5) 𝐳 =
𝟑𝟐.𝟓𝟎 − 𝟑𝟓
(
𝟖.𝟏𝟎
√𝟏𝟖
)
= −𝟏. 𝟑𝟏
6) Accept Ho, because −1.31 > −1.645
7) At α = 0.05, the population mean is equal to $35.
8) Suppose that scores on the Scholastic Aptitude Test form a normal distribution with  = 500 and
 = 100. A high school counselor has developed a special course designed to boost SAT scores. A random
sample of 16 students is selected to take the course and then the SAT. The sample had an average score
of x = 544. Does the course boost SAT scores? Test at  = 0.01. Show all steps.
1) Ho: µ = 500
2) Ha : µ > 500
3) α = 0.01
4) Reject Ho if z > 2.326
5) 𝐳 =
𝟓𝟒𝟒−𝟓𝟎𝟎
(
𝟏𝟎𝟎
√𝟏𝟔
)
= 𝟏. 𝟕𝟔
6) Accept Ho, because 1.76 < 2.326
7) At α = 0.01, the population mean is equal to 500.
µ = 3000
σ = 500
𝐱
̅ = 3472
n = 16
α = 0.01
µ = 35
σ = 8.10
𝐱
̅ = 32.5
n = 18
α = 0.05
µ = 500
σ = 100
𝐱
̅ = 544
n = 16
α = 0.01
160
9) In a certain community, a claim is made that the average income of all employed individuals is $35,500. A
group of citizens suspects this value is incorrect and gathers a random sample of 140 employed individuals in
hopes of showing that $35,500 is not the correct average. The mean of the sample is $34,325 with a
population standard deviation of $4,200. Test at α = 0.10. Show all steps.
1) Ho: µ = 35,500
2) Ha : µ ≠ 35,500
3) α = 0.10
4) Reject Ho if z > 1.645 or z < −1.645
5) 𝐳 =
𝟑𝟒𝟑𝟐𝟓−𝟑𝟓𝟓𝟎𝟎
(
𝟒𝟐𝟎𝟎
√𝟏𝟒𝟎
)
= −𝟑. 𝟑𝟏
6) Reject Ho, because −3.31 < −1.645
7) At α = 0.10, the population mean is not equal to $35,500.
10) The mean GPA at a certain university is 2.80 with a population standard deviation of 0.3. A random
sample of 16 business students from this university had a mean of 2.91. Test to determine whether the
mean GPA for business students is greater than the university mean at the 0.10 level of significance. Show
all steps.
1) Ho: µ = 2.8
2) Ha : µ > 2.8
3) α = 0.10
4) p-value = 0.075
5) 0.075 < 0.1, Reject H0
6) At α = 0.10, the population mean is greater than 2.8.
11) A study by the Web metrics firm Experian showed that in August of 2011, the mean time spent per
visit to Facebook was 20.8 minutes with a population standard deviation of 8 minutes. Suppose a simple
random sample of 60 visits in August 2013 has a mean of 21.5 minutes. A social scientist is interested to
know whether the mean time of Facebook visits has changed. Use α = 0.05. Show all steps.
1) Ho: µ = 20.8
2) Ha : µ ≠ 20.8
3) α = 0.05
4) p-value = 0.498
5) 0.498 > 0.05, Accept H0
6) At α = 0.05, the population mean is equal to 20.8 minutes.
µ = 35,500
σ = 4,200
𝐱
̅ = 34,325
n = 140
α = 0.10
161
Hypothesis Testing for Population Mean with Unknown Population Standard Deviation
12) The secretary of an association of professional landscape gardeners claims that the average cost of
services to customers is $90 per month. Feeling that this figure is too high, we question a random sample
of 14 customers. Our sample yields a mean cost of $85 and a standard deviation of $10. Test at the 0.10
significance level. Assume that such costs are normally distributed.
1) Ho: µ = 90
2) Ha : µ < 90
3) α = 0.10
4) (df = 13) Reject Ho if t < −1.350
5) 𝐭 =
𝟖𝟓 −𝟗𝟎
(
𝟏𝟎
√𝟏𝟒
)
= −𝟏. 𝟖𝟕
6) Reject Ho, because −1.87 < −1.350
7) At α = 0.10, the population mean is less than $90.
13) A study was done in Europe recently to investigate the health hazards of working long hours in front
of a computer or word processor video displays. It found that it took an average of 2.6 hours before a
certain symptom of eye strain developed. If a similar experiment in the United States using a sample
of 85 people had a mean of 2.8 hours, with standard deviation of 1.25 hours, would this indicate that the
American results are in conflict with the European results? Use a level of significance of 0.01.
1) Ho: µ = 2.6
2) Ha : µ ≠ 2.6
3) α = 0.01
4) (𝛂 =
𝟎.𝟎𝟏
𝟐
= 𝟎. 𝟎𝟎𝟓 𝐚𝐧𝐝 𝐝𝐟 = 𝟖𝟒) Reject Ho if t < −2.636 or t > 2.636
5) 𝐭 =
𝟐.𝟖 − 𝟐.𝟔
(
𝟏.𝟐𝟓
√𝟖𝟓
)
= 𝟏. 𝟒𝟖
6) Accept Ho, because 1.48 < 2.636
7) At α = 0.01, the population mean is equal to 2.6 hours.
14) A mean grade point average (GPA) of graduating college seniors who have been admitted to graduate
school is 3.1, where an A is given 4 points. At Ivy University a random sample of 43 incoming graduate
students yielded a GPA of 3.2 with a standard deviation of 0.42. Can we claim that the students going to
Ivy have better grades than the national average, using the 0.05 significance level?
1) Ho: µ = 3.1
2) Ha : µ > 3.1
3) α = 0.05
4) (df = 42) Reject Ho if t > 1.682
5) 𝐭 =
𝟑.𝟐 − 𝟑.𝟐
(
𝟎.𝟒𝟐
√𝟒𝟑
)
= 𝟏. 𝟓𝟔
6) Accept Ho, because 1.56 < 1.682
7) At α = 0.05, the population mean is equal to 3.1.
µ = 90
s = 10
𝐱
̅ = 85
n = 14
α = 0.10
µ = 2.6
s = 1.25
𝐱
̅ = 2.8
n = 85
α = 0.01
µ = 3.1
s = 0.42
𝐱
̅ = 3.2
n = 43
α = 0.05
162
15) Count and Countess Dracula supervise students who are training to be hematologists. For one
project their 8 students had to count certain cell types in blood samples. Their counts were 103, 75, 82,
107, 63, 102, 81, and 72. Does this support the hypothesis that the mean count is 100? Use  = 0.05.
Assume that the cell counts are normally distributed and x = 85.63 and s = 16.35.
1) Ho: µ = 100
2) Ha : µ ≠ 100
3) α = 0.05
4) (𝛂 =
𝟎.𝟎𝟓
𝟐
= 𝟎. 𝟐𝟓 𝐚𝐧𝐝 𝐝𝐟 = 𝟕) Reject Ho if t < −2.365 or t > 2.365
5) 𝐭 =
𝟖𝟓.𝟔𝟑 − 𝟏𝟎𝟎
(
𝟏𝟔.𝟑𝟓
√𝟖
)
= −𝟐. 𝟒𝟗
6) Reject Ho, because −2.49 < −2.365
7) At α = 0.05, the population mean not equal to 100.
16) A newspaper states that a family in Alton, Rhode Island, on average, produces 5.2 pounds of organic
garbage per week. A public health officer feels that the figure is incorrect. A random sample of 40
families is chosen and the mean number of pounds of organic garbage produced by these 40 families is
4.4 pounds with a standard deviation of 1.35 pounds. Test the health officer’s test of the newspaper’s
claim, using the Minitab printout below and a level of significance of 0.05.
1) Ho: µ = 5.2
2) Ha : µ ≠ 5.2
3) α = 0.05
4) p-value = 0.001
5) 0.001 < 0.0, Reject H
6) At α = 0.05, the population mean is not equal to 5.2
pounds.
17) A claim is published that in a certain area of high unemployment, $195 is the average amount spent
on food per week by a family of four. A home economist wants to test this claim against the suspicion
that the true average is lower than $195. She surveys a random sample of 36 families from the locality
and finds the mean to be $193.20 with a standard deviation of $6.80. Using the Minitab printout below
and 0.01 level of significance, test the home economists claim.
1) Ho: µ = 195
2) Ha : µ < 195
3) α = 0.01
4) p-value = 0.061
5) 0.061 > 0.01, Accept Ho
6) At α = 0.01, the population mean is equal to $195.
µ = 100
s = 16.35
𝐱
̅ = 85.63
n = 8
α = 0.05

SectionVNoteswithAnswers STATS _000 (1).pdf

  • 1.
    155 Section V Hypothesis Testingfor Population Mean with Known and Unknown Population Standard Deviation Hypothesis tests are used to make decisions or judgments about the value of a parameter, such as the population mean. There are two approaches for conducting a hypothesis test; the critical value approach and the P-value approach. Since a sample statistic is being used to make decisions or judgements about the value of a parameter it is possible that the decision reached is an error; there are two types of errors made when conducting a hypothesis test; Type I Error and Type II Error. Types of Hypotheses Null Hypothesis: The hypothesis to be tested, denoted Ho. Assumed to be true. (Null hypothesis contains the equal sign.) Alternative Hypothesis: A hypothesis considered to be an alternate to the null hypothesis, denoted Ha. What we believe might actually be true. (Alternative hypothesis contains an inequality <, >, and ) Types of Errors Type I Error: Rejecting Ho when in fact Ho is actually true Type II Error: Accepting Ho when in fact Ho is actually false Note: In the real world we never know if we make an error when conducting a hypothesis test, so we want to keep the probability of making an error small. The probability of making a Type I Error is called the significance level, denoted alpha, α; (0.01, 0.05, 0.1). The significance level is used as a basis to determine the rejection region, since it is the probability of rejecting a true null hypothesis or in other words the probability the test statistic will fall in the rejection region when in fact the null hypothesis is true. Rejection Region: The set of values for the test statistic that leads to the rejection of Ho. Critical Values: The beginning and ending of the rejection region, zα or ±𝑧𝛼 2 ⁄ or tα or ±𝑡𝛼 2 ⁄ Test statistic: The statistic used as a basis for deciding whether the null hypothesis should be rejected. If the test statistic results in a value that is in the rejection region we will reject the null hypothesis, Ho. If the test statistic results in a value that is not in the rejection region we will accept the null hypothesis.
  • 2.
    156 STEPS FOR HYPOTHESISTESTING FOR ONE SAMPLE MEAN The Critical Value Approach Step 1: State Null Hypothesis. Ho :  = o (where o is a specified value) Step 2: State Alternative Hypothesis. 1) Ha :   o (two-tailed test) 2) Ha :  > o (one-tailed test) 3) Ha :  < o (one-tailed test) Step 3: State . (Usually 0.05, 0.01, or 0.10) Step 4: Determine Rejection Region: Use when  is known Use when  is unknown Use Table C using df = n  1 two-tailed () : Reject Ho if z > z/2 or z < z/2 *Reject Ho if t > t/2 or t < t/2 one-tailed (>) : Reject Ho if z > z Reject Ho if t > t one-tailed (<) : Reject Ho if z < z Reject Ho if t < − t Critical z-values:  = 0.05  =0.01 =0.10 (>) (<) (>) (<) (>) (<) 1-tailed : +1.645 1.645 +2.326 2.326 +1.282 1.282 2-tailed (≠): 1.96 2.576 1.645 Step 5: Calculate the test statistic: Use when  is known Use when  is unknown z = x ̅ − μ ( σ √n ) t = x ̅ − μ ( s √n ) Step 6: Determine if the calculated test statistic is in the critical region or not. Reject or Accept Ho. Step 7 : State conclusion clearly in words. *Note: If you are working with a two-tailed test don’t forget to divide the alpha value by 2 to find the correct t-value.
  • 3.
    157 P-value approach tohypothesis testing: P-value is the probability of observing a value of the test statistic as extreme or more extreme than that observed, assuming Ho is true. One Tailed (>): P(z > zo) = P-value, (<) P(z < zo) = P-value, Two Tailed (): 2P(z > zo) = P-value Therefore, if the P-value is less than the significance level you would reject the null hypothesis and if the P-value is greater than the significance level you would accept the null hypothesis. The P-value Approach – Use when you are given a Minitab Printout Step 1: State Null Hypothesis. Ho :  = o (where o is a specified value) Step 2: State Alternative Hypothesis. 1) Ha :   o (two-tailed test) 2) Ha :  > o (one-tailed test) 3) Ha :  < o (one-tailed test) Step 3: State . (Usually 0.05, 0.01, or 0.10) Step 4: Determine p-value from Minitab printout Step 5: Compare the p-value with the α value; If P−value   reject Ho, otherwise accept Ho. Step 6: State your conclusion in words. Examples of Type I and Type II Errors 1) According to popcorn.org, the mean consumption of popcorn annually by Americans is 54 quarts. The marketing division of popcorn.org unleashes an aggressive campaign designed to get Americans to consume even more popcorn. The hypotheses are: Ho :  = 54 quarts Ha :  > 54 quarts Suppose that the results of sampling lead to non-rejection of the null hypothesis. Classify that conclusion as a Type I Error, a Type II Error, or a correct decision, if in fact the average popcorn consumption by Americans has increased. Type II Error 2) The mean score on the SAT Math Reasoning exam is 516. A test preparation company states that the mean score of students who take its course is higher than 516. The hypotheses are: Ho :  = 516 Ha :  > 516 Suppose that the results of sampling lead to rejection of the null hypothesis. Classify that conclusion as a Type I Error, a Type II Error, or a correct decision, if in fact the average SAT score has increased. Correct Decision
  • 4.
    158 3) According tothe CTIA-The Wireless Association, the mean monthly cell phone bill was $95 in 2013. A researcher suspects the mean monthly cell phone bill is different today. The hypotheses are: Ho :  = $95 Ha :   $95 Suppose that the results of the sampling lead to rejection of the null hypothesis. Classify that conclusion as a Type I Error, a Type II Error, or a correct decision, if in fact the mean cell phone bill is not different than in 2013. Type I Error 4) According to the National Association of Home Builders, the mean price of an existing single-family home in 2009 was $238,600. A real estate broker believes that the mean price has decreased since then. The hypotheses are: Ho :  = $238,600 Ha :  < $238,600 Suppose that the results of the sampling lead to non-rejection of the null hypothesis. Classify that conclusion as a Type I Error, a Type II Error, or a correct decision, if in fact the mean the mean price has not decreased since 2009. Correct Decision Hypothesis Testing for Population Mean with Known Population Standard Deviation 5) Jim Nasium claims that the mean A.C.T. score attained by two year college students is 22. Al Dente suspects this claim is too low and selects a random sample of 121 two year college students. The mean of the sample is 23.3 and the population standard deviation is assumed to be 3.3. Test at the 5% significance level. Show all steps. 1) Ho: µ = 22 2) Ha : µ > 22 3) α = 0.05 4) Reject Ho if z > 1.645 5) 𝐳 = 𝟐𝟑.𝟑 − 𝟐𝟐 ( 𝟑.𝟑 √𝟏𝟐𝟏 ) = 𝟒. 𝟑𝟑 6) Reject Ho, because 4.33 > 1.645 7) At α = 0.05, the population mean is greater than 22. µ = 22 σ = 3.3 𝐱 ̅ = 23.3 n = 121 α = 0.05
  • 5.
    159 6) Does theevidence support the idea that the average lecture consists of 3000 words if a random sample of the lectures of 16 professors had a mean of 3472 words, given the population standard deviation is 500 words? Use  = 0.01. Assume that lecture lengths are approximately normally distributed. Show all steps. 1) Ho: µ = 3000 2) Ha : µ ≠ 3000 3) α = 0.01 4) Reject Ho if z < −2.576 or z > 2.576 5) 𝐳 = 𝟑𝟒𝟕𝟐−𝟑𝟎𝟎𝟎 ( 𝟓𝟎𝟎 √𝟏𝟔 ) = 𝟑. 𝟕𝟖 6) Reject Ho, because 3.78 > 2.576 7) At α = 0.01, the population mean is not equal to 3000 words. 7) The Dog Days Lawn Service advertises that it will completely maintain your lawn at an average cost per customer of $35 per month. Assume the costs are normally distributed. A random sample of 18 Dog Days customers shows the average cost to be $32.50 with a population standard deviation of $8.10. Do the data support the claim that the average cost per month is less than $35.00? Use a 5% level of significance. Show all steps. 1) Ho: µ = 35 2) Ha : µ < 35 3) α = 0.05 4) Reject Ho if z < −1.645 5) 𝐳 = 𝟑𝟐.𝟓𝟎 − 𝟑𝟓 ( 𝟖.𝟏𝟎 √𝟏𝟖 ) = −𝟏. 𝟑𝟏 6) Accept Ho, because −1.31 > −1.645 7) At α = 0.05, the population mean is equal to $35. 8) Suppose that scores on the Scholastic Aptitude Test form a normal distribution with  = 500 and  = 100. A high school counselor has developed a special course designed to boost SAT scores. A random sample of 16 students is selected to take the course and then the SAT. The sample had an average score of x = 544. Does the course boost SAT scores? Test at  = 0.01. Show all steps. 1) Ho: µ = 500 2) Ha : µ > 500 3) α = 0.01 4) Reject Ho if z > 2.326 5) 𝐳 = 𝟓𝟒𝟒−𝟓𝟎𝟎 ( 𝟏𝟎𝟎 √𝟏𝟔 ) = 𝟏. 𝟕𝟔 6) Accept Ho, because 1.76 < 2.326 7) At α = 0.01, the population mean is equal to 500. µ = 3000 σ = 500 𝐱 ̅ = 3472 n = 16 α = 0.01 µ = 35 σ = 8.10 𝐱 ̅ = 32.5 n = 18 α = 0.05 µ = 500 σ = 100 𝐱 ̅ = 544 n = 16 α = 0.01
  • 6.
    160 9) In acertain community, a claim is made that the average income of all employed individuals is $35,500. A group of citizens suspects this value is incorrect and gathers a random sample of 140 employed individuals in hopes of showing that $35,500 is not the correct average. The mean of the sample is $34,325 with a population standard deviation of $4,200. Test at α = 0.10. Show all steps. 1) Ho: µ = 35,500 2) Ha : µ ≠ 35,500 3) α = 0.10 4) Reject Ho if z > 1.645 or z < −1.645 5) 𝐳 = 𝟑𝟒𝟑𝟐𝟓−𝟑𝟓𝟓𝟎𝟎 ( 𝟒𝟐𝟎𝟎 √𝟏𝟒𝟎 ) = −𝟑. 𝟑𝟏 6) Reject Ho, because −3.31 < −1.645 7) At α = 0.10, the population mean is not equal to $35,500. 10) The mean GPA at a certain university is 2.80 with a population standard deviation of 0.3. A random sample of 16 business students from this university had a mean of 2.91. Test to determine whether the mean GPA for business students is greater than the university mean at the 0.10 level of significance. Show all steps. 1) Ho: µ = 2.8 2) Ha : µ > 2.8 3) α = 0.10 4) p-value = 0.075 5) 0.075 < 0.1, Reject H0 6) At α = 0.10, the population mean is greater than 2.8. 11) A study by the Web metrics firm Experian showed that in August of 2011, the mean time spent per visit to Facebook was 20.8 minutes with a population standard deviation of 8 minutes. Suppose a simple random sample of 60 visits in August 2013 has a mean of 21.5 minutes. A social scientist is interested to know whether the mean time of Facebook visits has changed. Use α = 0.05. Show all steps. 1) Ho: µ = 20.8 2) Ha : µ ≠ 20.8 3) α = 0.05 4) p-value = 0.498 5) 0.498 > 0.05, Accept H0 6) At α = 0.05, the population mean is equal to 20.8 minutes. µ = 35,500 σ = 4,200 𝐱 ̅ = 34,325 n = 140 α = 0.10
  • 7.
    161 Hypothesis Testing forPopulation Mean with Unknown Population Standard Deviation 12) The secretary of an association of professional landscape gardeners claims that the average cost of services to customers is $90 per month. Feeling that this figure is too high, we question a random sample of 14 customers. Our sample yields a mean cost of $85 and a standard deviation of $10. Test at the 0.10 significance level. Assume that such costs are normally distributed. 1) Ho: µ = 90 2) Ha : µ < 90 3) α = 0.10 4) (df = 13) Reject Ho if t < −1.350 5) 𝐭 = 𝟖𝟓 −𝟗𝟎 ( 𝟏𝟎 √𝟏𝟒 ) = −𝟏. 𝟖𝟕 6) Reject Ho, because −1.87 < −1.350 7) At α = 0.10, the population mean is less than $90. 13) A study was done in Europe recently to investigate the health hazards of working long hours in front of a computer or word processor video displays. It found that it took an average of 2.6 hours before a certain symptom of eye strain developed. If a similar experiment in the United States using a sample of 85 people had a mean of 2.8 hours, with standard deviation of 1.25 hours, would this indicate that the American results are in conflict with the European results? Use a level of significance of 0.01. 1) Ho: µ = 2.6 2) Ha : µ ≠ 2.6 3) α = 0.01 4) (𝛂 = 𝟎.𝟎𝟏 𝟐 = 𝟎. 𝟎𝟎𝟓 𝐚𝐧𝐝 𝐝𝐟 = 𝟖𝟒) Reject Ho if t < −2.636 or t > 2.636 5) 𝐭 = 𝟐.𝟖 − 𝟐.𝟔 ( 𝟏.𝟐𝟓 √𝟖𝟓 ) = 𝟏. 𝟒𝟖 6) Accept Ho, because 1.48 < 2.636 7) At α = 0.01, the population mean is equal to 2.6 hours. 14) A mean grade point average (GPA) of graduating college seniors who have been admitted to graduate school is 3.1, where an A is given 4 points. At Ivy University a random sample of 43 incoming graduate students yielded a GPA of 3.2 with a standard deviation of 0.42. Can we claim that the students going to Ivy have better grades than the national average, using the 0.05 significance level? 1) Ho: µ = 3.1 2) Ha : µ > 3.1 3) α = 0.05 4) (df = 42) Reject Ho if t > 1.682 5) 𝐭 = 𝟑.𝟐 − 𝟑.𝟐 ( 𝟎.𝟒𝟐 √𝟒𝟑 ) = 𝟏. 𝟓𝟔 6) Accept Ho, because 1.56 < 1.682 7) At α = 0.05, the population mean is equal to 3.1. µ = 90 s = 10 𝐱 ̅ = 85 n = 14 α = 0.10 µ = 2.6 s = 1.25 𝐱 ̅ = 2.8 n = 85 α = 0.01 µ = 3.1 s = 0.42 𝐱 ̅ = 3.2 n = 43 α = 0.05
  • 8.
    162 15) Count andCountess Dracula supervise students who are training to be hematologists. For one project their 8 students had to count certain cell types in blood samples. Their counts were 103, 75, 82, 107, 63, 102, 81, and 72. Does this support the hypothesis that the mean count is 100? Use  = 0.05. Assume that the cell counts are normally distributed and x = 85.63 and s = 16.35. 1) Ho: µ = 100 2) Ha : µ ≠ 100 3) α = 0.05 4) (𝛂 = 𝟎.𝟎𝟓 𝟐 = 𝟎. 𝟐𝟓 𝐚𝐧𝐝 𝐝𝐟 = 𝟕) Reject Ho if t < −2.365 or t > 2.365 5) 𝐭 = 𝟖𝟓.𝟔𝟑 − 𝟏𝟎𝟎 ( 𝟏𝟔.𝟑𝟓 √𝟖 ) = −𝟐. 𝟒𝟗 6) Reject Ho, because −2.49 < −2.365 7) At α = 0.05, the population mean not equal to 100. 16) A newspaper states that a family in Alton, Rhode Island, on average, produces 5.2 pounds of organic garbage per week. A public health officer feels that the figure is incorrect. A random sample of 40 families is chosen and the mean number of pounds of organic garbage produced by these 40 families is 4.4 pounds with a standard deviation of 1.35 pounds. Test the health officer’s test of the newspaper’s claim, using the Minitab printout below and a level of significance of 0.05. 1) Ho: µ = 5.2 2) Ha : µ ≠ 5.2 3) α = 0.05 4) p-value = 0.001 5) 0.001 < 0.0, Reject H 6) At α = 0.05, the population mean is not equal to 5.2 pounds. 17) A claim is published that in a certain area of high unemployment, $195 is the average amount spent on food per week by a family of four. A home economist wants to test this claim against the suspicion that the true average is lower than $195. She surveys a random sample of 36 families from the locality and finds the mean to be $193.20 with a standard deviation of $6.80. Using the Minitab printout below and 0.01 level of significance, test the home economists claim. 1) Ho: µ = 195 2) Ha : µ < 195 3) α = 0.01 4) p-value = 0.061 5) 0.061 > 0.01, Accept Ho 6) At α = 0.01, the population mean is equal to $195. µ = 100 s = 16.35 𝐱 ̅ = 85.63 n = 8 α = 0.05