Downloaded 114 times


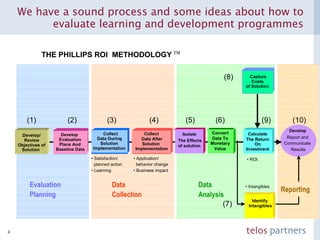


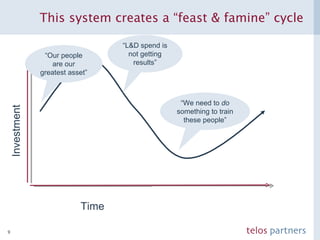
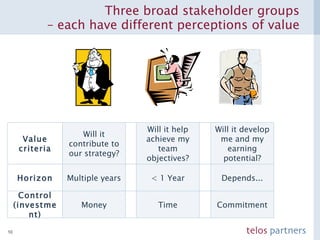

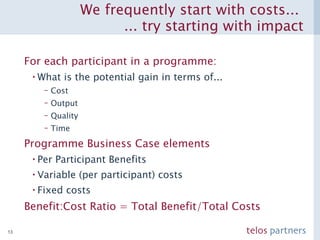

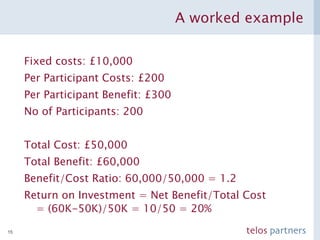
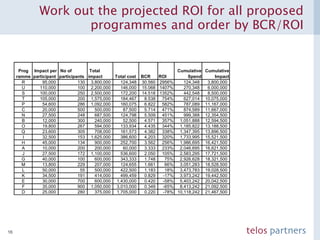
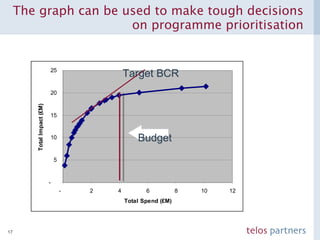
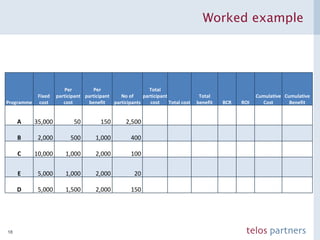
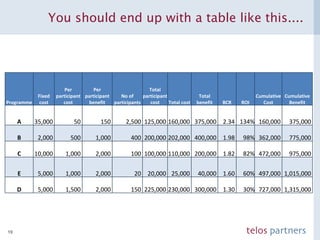


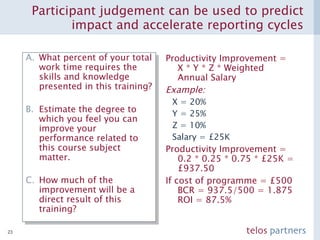
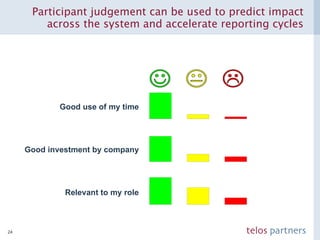

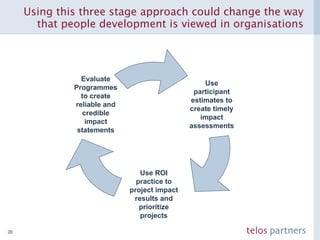

The document discusses how to build a strategic business case for learning and development (L&D) investments in organizations. It suggests starting with the potential impact of L&D programs rather than just costs. It provides a framework to calculate return on investment and benefit-cost ratios for L&D programs to prioritize investments. The framework includes estimating fixed costs, per-participant costs and benefits, and number of participants to calculate total costs and benefits. It also discusses using participant feedback and estimates shortly after training to predict longer-term impacts and communicate performance against plans.


