Download as PDF, PPTX
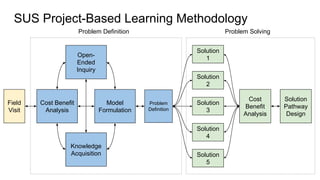
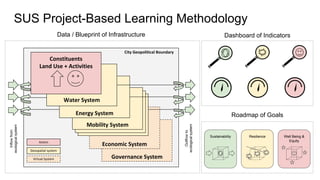
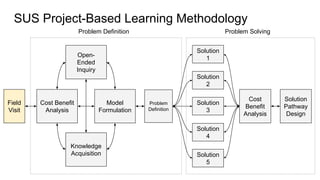
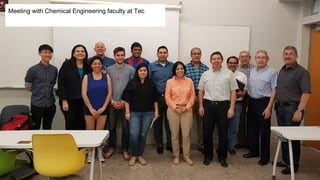
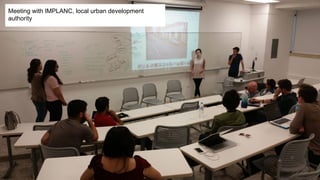
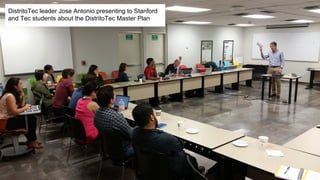
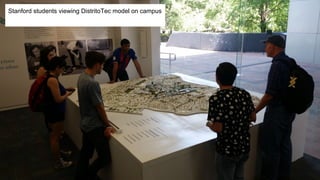
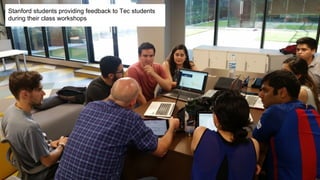
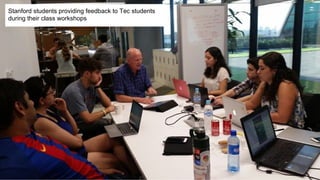
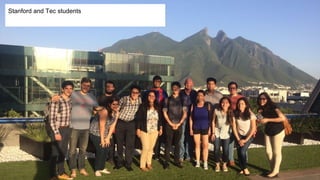
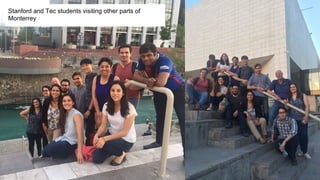

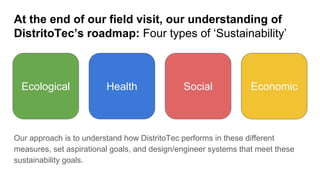
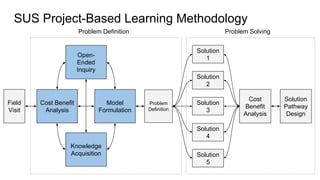
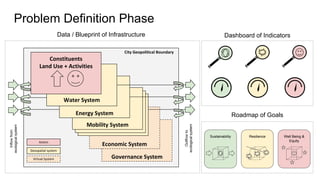
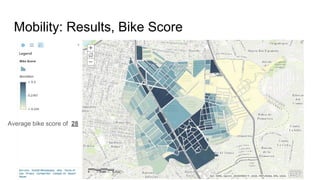
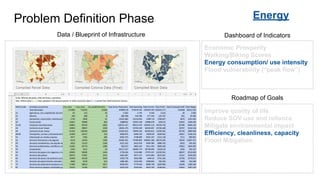
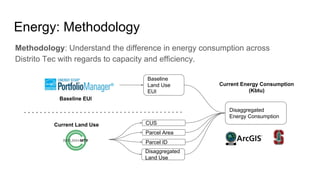
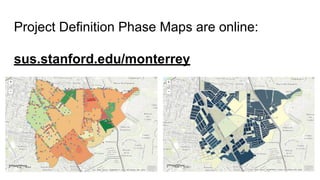
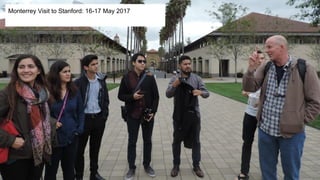
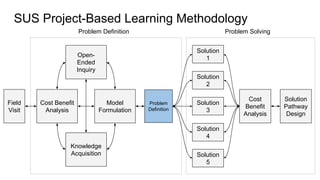
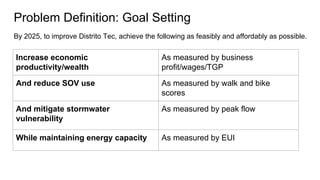
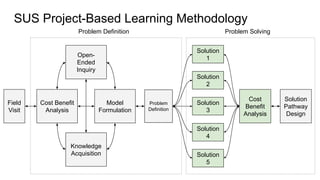
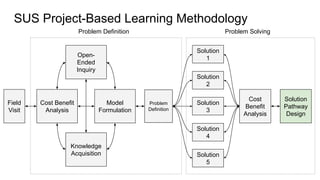
This presentation summarizes work done by Stanford and Tec de Monterrey students on analyzing and defining sustainability problems in Distrito Tec, Monterrey, Mexico. The students used a project-based learning methodology involving problem definition, field visits, and developing analysis on land use, mobility, energy, and water systems. For each topic, the students outlined their methodology, key results, and next steps to further define the problems and pathways to solutions. The goal is to help Distrito Tec set sustainability goals and design infrastructure to meet those goals across health, ecological, social and economic dimensions.