
Download to read offline
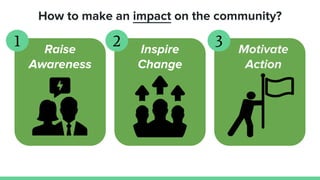
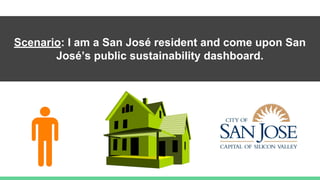
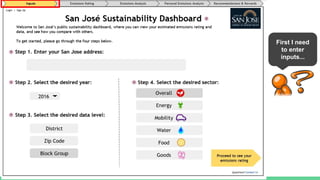
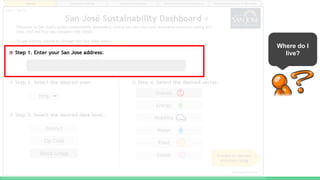
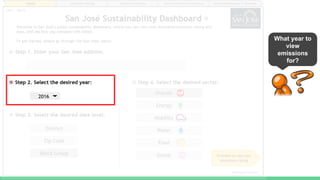
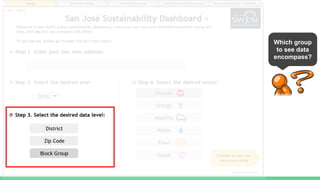
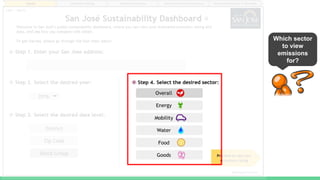
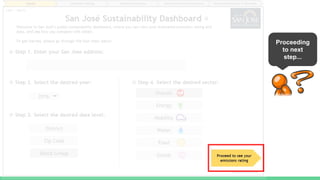
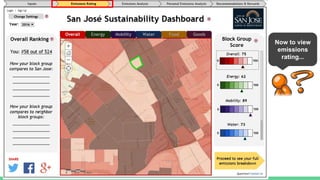
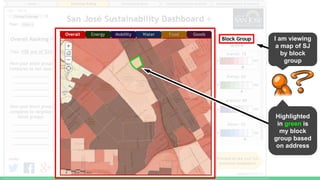
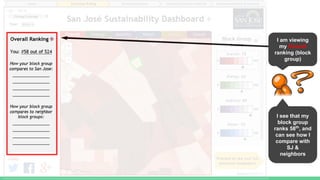
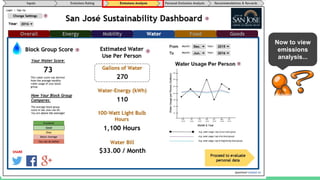
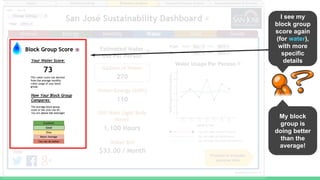
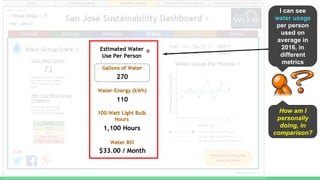
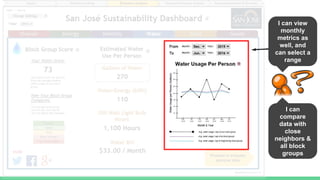
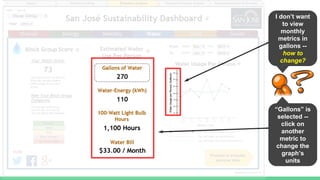
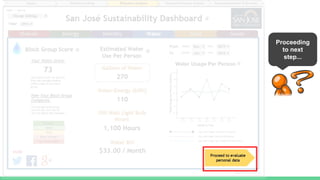
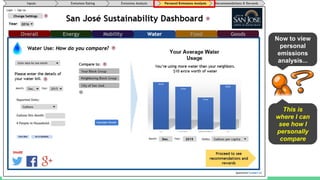
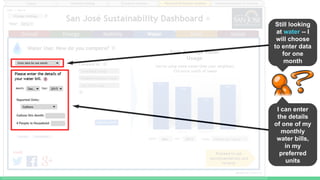
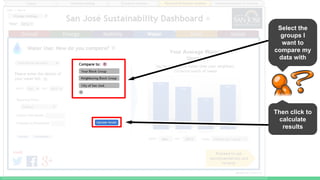
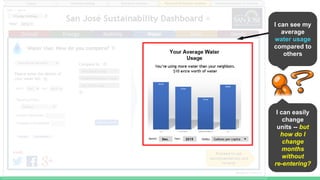
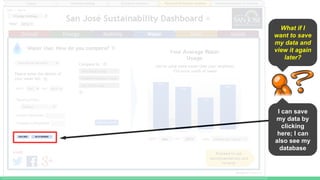
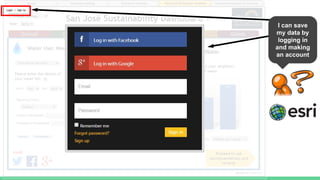
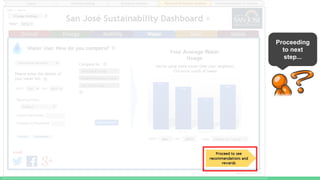
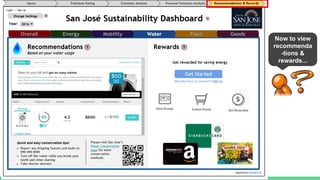
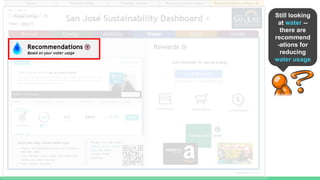
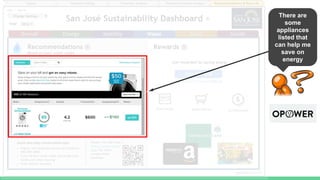
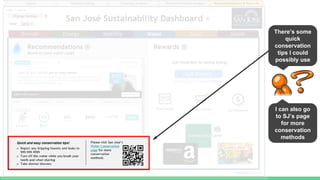
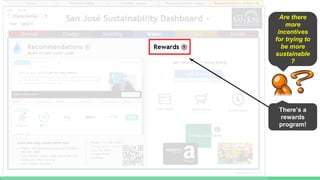
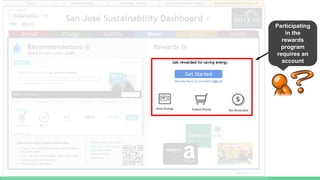
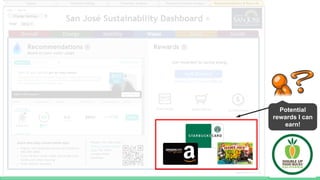
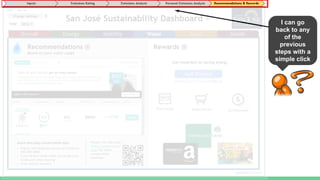


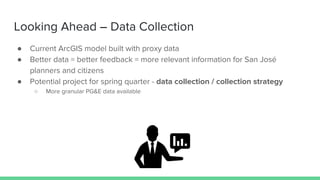


The San José Sustainability Project aims to engage residents in sustainability efforts through an interactive dashboard that displays public emissions data and personal usage metrics. It encourages community involvement, offers recommendations for reducing usage, and features a rewards program. Future developments include improved data collection and feedback mechanisms to enhance the dashboard's effectiveness.


![Dunedin presentation.pptx[14276]](https://cdn.slidesharecdn.com/ss_thumbnails/dunedinpresentation-190725170838-thumbnail.jpg?width=640&height=640&fit=bounds)


