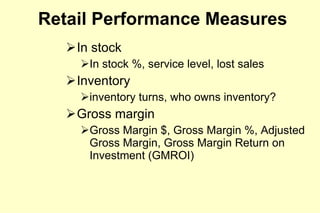
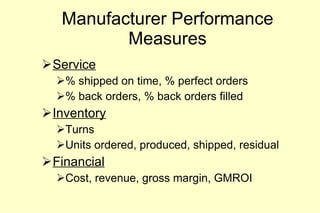
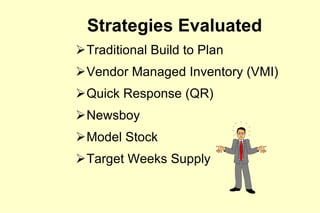
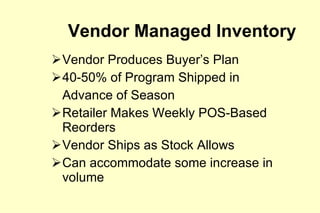
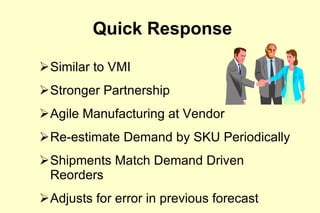
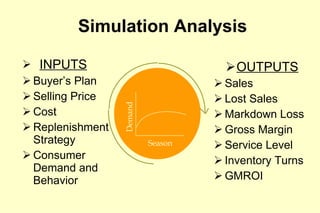
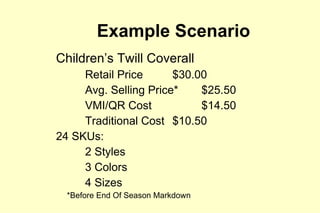
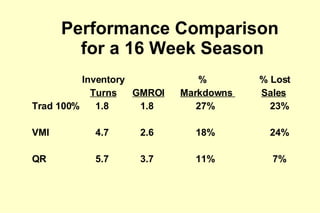
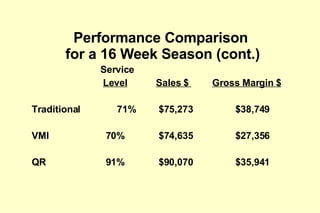
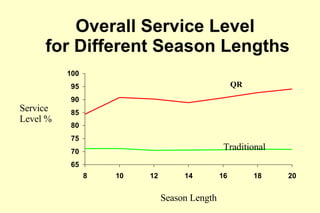
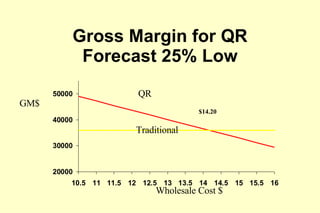
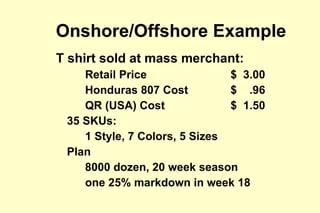
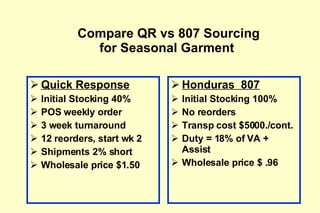
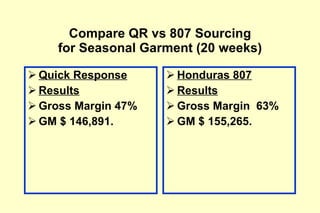
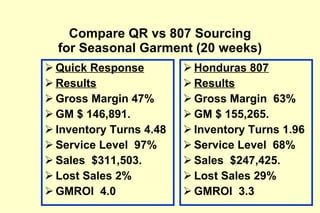
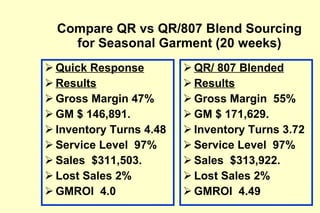
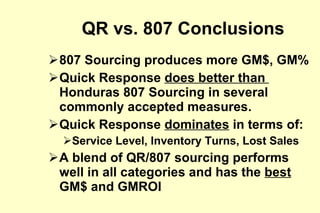
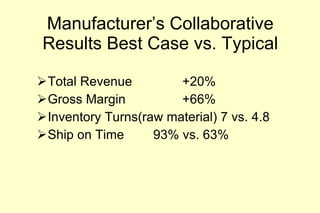
Analyzing Sourcing and Manufacturing Strategies for Better Financial Performance   Jim Lovejoy Textile/Clothing Technology Corp.
Research Agenda Compare Sourcing Strategies  Evaluate impact of Manufacturing Lead-time Investigate the Impact of Forecast Error Investigate the Impact of Collaboration Identify top ten financial levers (other than price)
Retail Performance Measures In stock Inventory turns Gross Margin
Retail Performance Measures In stock In stock %, service level, lost sales Inventory  inventory turns, who owns inventory?  Gross margin Gross Margin $, Gross Margin %, Adjusted Gross Margin, Gross Margin Return on Investment (GMROI)
Key Retail Planning Strategies Plan assortment strategy Plan merchandise pricing strategy Plan delivery strategy Evaluate vendor offerings
Manufacturer Performance Measures Service % shipped on time, % perfect orders % back orders, % back orders filled Inventory Turns Units ordered, produced, shipped, residual Financial Cost, revenue, gross margin, GMROI
Strategies Evaluated Traditional Build to Plan Vendor Managed Inventory (VMI) Quick Response (QR) Newsboy Model Stock Target Weeks Supply
Program Received in Advance of Season Mix and Volume of Garments Based upon Buyer’s Plan No reordering, no re-estimation of demand Traditional Build to Plan
Vendor Produces Buyer’s Plan 40-50% of Program Shipped in  Advance of Season Retailer Makes Weekly POS-Based Reorders Vendor Ships as Stock Allows Can accommodate some increase in volume Vendor Managed Inventory
Similar to VMI Stronger Partnership Agile Manufacturing at Vendor Re-estimate Demand by SKU Periodically Shipments Match Demand Driven Reorders Adjusts for error in previous forecast Quick Response
Newsboy Similar to Quick Response Reorder quantity based on target service level considering time until next reorder delivered or end of season
Model Stock No demand re-estimation Replenish to model stock quantities in buyers plan Equivalent to ordering to maintain a presentation stock
Target Weeks Supply Re-estimate demand periodically based on POS Order enough to satisfy demand for a fixed number of weeks after order is received
Forecast Error Volume Error - Difference between Total Demand and Forecast for the entire line Mix Error - Difference in the Fraction of Demand for each SKU “ 1% improvement in forecast accuracy can equal  a 2% inventory savings”  Ernst & Young
Forecast vs. Actual Demand SKU Mix Error Forecast   Actual  Absolute Size   Demand Demand Difference   S   10%   10%   0% M   25%   35%   10%   L   35%   30%   5%   XL   30%   25%   5% Total   100%   100%   20% Example of a “20%” Size Error
Seasonality Curves % of Total Sales % of Total Sales
Importance of Speed & Flexibility Cannot predict future Forecasting is based on history POS data is not 100% accurate Consumer is fickle Buyers have performance measures Offshore sources are cheaper
Simulation Analysis INPUTS Buyer’s Plan Selling Price Cost Replenishment Strategy Consumer Demand and Behavior OUTPUTS Sales Lost Sales Markdown Loss Gross Margin Service Level Inventory Turns GMROI Demand Season Demand Season
Example Scenario Children’s Twill Coverall Retail Price $30.00 Avg. Selling Price* $25.50 VMI/QR Cost $14.50 Traditional Cost $10.50 24 SKUs: 2 Styles 3 Colors 4 Sizes *Before End Of Season Markdown
Performance Comparison  for a 16 Week Season   Inventory   %   % Lost    Turns   GMROI   Markdowns  Sales Trad 100%   1.8   1.8   27%   23% VMI   4.7   2.6   18%   24%  QR   5.7   3.7   11%   7%
Performance Comparison  for a 16 Week Season (cont.)   Service   Level   Sales $  Gross Margin $ Traditional  71%   $75,273 $38,749 VMI   70%   $74,635 $27,356 QR   91%   $90,070 $35,941
Overall Service Level  for Different Season Lengths QR Traditional Season Length Service Level %
Gross Margin for QR Perfect Volume Forecast Traditional GM$ Wholesale Price QR $13.65
Gross Margin for QR Forecast 25% Low Traditional QR Wholesale Cost $ GM$ $14.20
Gross Margin for QR Forecast 25% High QR Traditional $16.00
Are we using a complete scorecard in our sourcing decisions?
Onshore/Offshore Example  T shirt sold at mass merchant: Retail Price   $  3.00 Honduras 807 Cost $  .96 QR (USA) Cost $  1.50 35 SKUs: 1 Style, 7 Colors, 5 Sizes Plan   8000 dozen, 20 week season one 25% markdown in week 18
Compare QR vs 807 Sourcing for Seasonal Garment  Quick Response Initial Stocking 40% POS weekly order 3 week turnaround 12 reorders, start wk 2 Shipments 2% short Wholesale price $1.50 Honduras  807 Initial Stocking 100% No reorders Transp cost $5000./cont. Duty = 18% of VA + Assist Wholesale price $ .96
Compare QR vs 807 Sourcing for Seasonal Garment (20 weeks) Quick Response Results Gross Margin 47% GM $ 146,891. Honduras 807 Results Gross Margin  63% GM $ 155,265.
Compare QR vs 807 Sourcing for Seasonal Garment (20 weeks) Quick Response Results Gross Margin 47% GM $ 146,891. Inventory Turns 4.48 Service Level  97% Sales  $311,503. Lost Sales 2% GMROI  4.0 Honduras 807 Results Gross Margin  63% GM $ 155,265. Inventory Turns 1.96 Service Level  68% Sales  $247,425. Lost Sales 29% GMROI  3.3
Compare QR vs QR/807 Blend Sourcing for Seasonal Garment (20 weeks) Quick Response Results Gross Margin 47% GM $ 146,891. Inventory Turns 4.48 Service Level  97% Sales  $311,503. Lost Sales 2% GMROI  4.0 QR/ 807 Blended Results Gross Margin  55% GM $ 171,629. Inventory Turns 3.72 Service Level  97% Sales  $313,922. Lost Sales 2% GMROI  4.49
QR vs. 807 Conclusions 807 Sourcing produces more GM$, GM% Quick Response  does better than  Honduras 807 Sourcing in several commonly accepted measures. Quick Response  dominates  in terms of: Service Level, Inventory Turns, Lost Sales A blend of QR/807 sourcing performs well in all categories and has the  best  GM$ and GMROI
Value of Collaboration  -  Case Study What is the value of reducing the lead times for raw materials and manufacturing process time in a textile supply chain?
Collaborative  Supply Chain Results Best Lead Time Fabric 2 weeks + 1 Apparel 1 week + 1 Min Order Fabric 1,000/500 Apparel 1/1 Typical Lead Time Fabric 6 weeks + 1 Apparel 2 weeks + 1 Min Order Fabric 10,000/5,000 Apparel  960/12
Collaborative Supply Chain Results
Manufacturer’s Collaborative Results Best Case vs. Typical Total Revenue +20% Gross Margin +66% Inventory Turns(raw material) 7 vs. 4.8 Ship on Time 93% vs. 63%
Research Results - General Replenishment increases Gross Margin $ Speed of replenishment & flexibility increases GM$ Assortment diversity decreases Gross Margin $ Price sensitivity  vs. markdown strategy Not getting revenue return from markdowns Better strategy to collaborate and replenish
Top Ten Levers for Financial Performance (other than price) 1.  Replenishment strategy 2.  Service level 3.  Assortment strategy 4.  Forecasting 5.  Make to order/make to stock 6.  Lead time 7.  Initial inventory 8.  Minimum order quantities 9.  Collaboration 10. Supply chain inventory placement
References King, Nuttle, Hunter, 1991,  A Stochastic Model of the Apparel-retailing Process for Seasonal Apparel , Textile Institute Whalen, Gilreath, Reeve, 1995,  Time is Money , Bobbin  March 1995 Hunter, King, 1997,  Retail Performance Measures and the Sourcing Decision , National Textile Center Pinnow, King, 1997,  Break Even Costs for Traditional versus Quick Response Apparel Suppliers , North Carolina State University IE Technical Report #97-4 King, Hunter, 1997,  Quick Response Beats Importing in Retail Sourcing Analysis , Bobbin March 1997 Koloszyc, 1998,  Apparel Retailers Use Simulator to Improve Sourcing Decisions , Stores August 1998 Kunz, 1998,  Merchandising Theory Principles and Practice , Fairchild Books Maddalena, King, 1998,  Replenishment Rules , Bobbin May 1998 Moon, Gokce, Maddalena, King, 1998,  Proplenishment Makes a Payoff , Bobbin May 1999
Thank you!  Questions? Jim Lovejoy [TC] 2 919-380-2184 Russ King,  NC State University 919-515-5186

Ss Case Studies

  • 1.
    Analyzing Sourcing andManufacturing Strategies for Better Financial Performance Jim Lovejoy Textile/Clothing Technology Corp.
  • 2.
    Research Agenda CompareSourcing Strategies Evaluate impact of Manufacturing Lead-time Investigate the Impact of Forecast Error Investigate the Impact of Collaboration Identify top ten financial levers (other than price)
  • 3.
    Retail Performance MeasuresIn stock Inventory turns Gross Margin
  • 4.
    Retail Performance MeasuresIn stock In stock %, service level, lost sales Inventory inventory turns, who owns inventory? Gross margin Gross Margin $, Gross Margin %, Adjusted Gross Margin, Gross Margin Return on Investment (GMROI)
  • 5.
    Key Retail PlanningStrategies Plan assortment strategy Plan merchandise pricing strategy Plan delivery strategy Evaluate vendor offerings
  • 6.
    Manufacturer Performance MeasuresService % shipped on time, % perfect orders % back orders, % back orders filled Inventory Turns Units ordered, produced, shipped, residual Financial Cost, revenue, gross margin, GMROI
  • 7.
    Strategies Evaluated TraditionalBuild to Plan Vendor Managed Inventory (VMI) Quick Response (QR) Newsboy Model Stock Target Weeks Supply
  • 8.
    Program Received inAdvance of Season Mix and Volume of Garments Based upon Buyer’s Plan No reordering, no re-estimation of demand Traditional Build to Plan
  • 9.
    Vendor Produces Buyer’sPlan 40-50% of Program Shipped in Advance of Season Retailer Makes Weekly POS-Based Reorders Vendor Ships as Stock Allows Can accommodate some increase in volume Vendor Managed Inventory
  • 10.
    Similar to VMIStronger Partnership Agile Manufacturing at Vendor Re-estimate Demand by SKU Periodically Shipments Match Demand Driven Reorders Adjusts for error in previous forecast Quick Response
  • 11.
    Newsboy Similar toQuick Response Reorder quantity based on target service level considering time until next reorder delivered or end of season
  • 12.
    Model Stock Nodemand re-estimation Replenish to model stock quantities in buyers plan Equivalent to ordering to maintain a presentation stock
  • 13.
    Target Weeks SupplyRe-estimate demand periodically based on POS Order enough to satisfy demand for a fixed number of weeks after order is received
  • 14.
    Forecast Error VolumeError - Difference between Total Demand and Forecast for the entire line Mix Error - Difference in the Fraction of Demand for each SKU “ 1% improvement in forecast accuracy can equal a 2% inventory savings” Ernst & Young
  • 15.
    Forecast vs. ActualDemand SKU Mix Error Forecast Actual Absolute Size Demand Demand Difference S 10% 10% 0% M 25% 35% 10% L 35% 30% 5% XL 30% 25% 5% Total 100% 100% 20% Example of a “20%” Size Error
  • 16.
    Seasonality Curves %of Total Sales % of Total Sales
  • 17.
    Importance of Speed& Flexibility Cannot predict future Forecasting is based on history POS data is not 100% accurate Consumer is fickle Buyers have performance measures Offshore sources are cheaper
  • 18.
    Simulation Analysis INPUTSBuyer’s Plan Selling Price Cost Replenishment Strategy Consumer Demand and Behavior OUTPUTS Sales Lost Sales Markdown Loss Gross Margin Service Level Inventory Turns GMROI Demand Season Demand Season
  • 19.
    Example Scenario Children’sTwill Coverall Retail Price $30.00 Avg. Selling Price* $25.50 VMI/QR Cost $14.50 Traditional Cost $10.50 24 SKUs: 2 Styles 3 Colors 4 Sizes *Before End Of Season Markdown
  • 20.
    Performance Comparison for a 16 Week Season Inventory % % Lost Turns GMROI Markdowns Sales Trad 100% 1.8 1.8 27% 23% VMI 4.7 2.6 18% 24% QR 5.7 3.7 11% 7%
  • 21.
    Performance Comparison for a 16 Week Season (cont.) Service Level Sales $ Gross Margin $ Traditional 71% $75,273 $38,749 VMI 70% $74,635 $27,356 QR 91% $90,070 $35,941
  • 22.
    Overall Service Level for Different Season Lengths QR Traditional Season Length Service Level %
  • 23.
    Gross Margin forQR Perfect Volume Forecast Traditional GM$ Wholesale Price QR $13.65
  • 24.
    Gross Margin forQR Forecast 25% Low Traditional QR Wholesale Cost $ GM$ $14.20
  • 25.
    Gross Margin forQR Forecast 25% High QR Traditional $16.00
  • 26.
    Are we usinga complete scorecard in our sourcing decisions?
  • 27.
    Onshore/Offshore Example T shirt sold at mass merchant: Retail Price $ 3.00 Honduras 807 Cost $ .96 QR (USA) Cost $ 1.50 35 SKUs: 1 Style, 7 Colors, 5 Sizes Plan 8000 dozen, 20 week season one 25% markdown in week 18
  • 28.
    Compare QR vs807 Sourcing for Seasonal Garment Quick Response Initial Stocking 40% POS weekly order 3 week turnaround 12 reorders, start wk 2 Shipments 2% short Wholesale price $1.50 Honduras 807 Initial Stocking 100% No reorders Transp cost $5000./cont. Duty = 18% of VA + Assist Wholesale price $ .96
  • 29.
    Compare QR vs807 Sourcing for Seasonal Garment (20 weeks) Quick Response Results Gross Margin 47% GM $ 146,891. Honduras 807 Results Gross Margin 63% GM $ 155,265.
  • 30.
    Compare QR vs807 Sourcing for Seasonal Garment (20 weeks) Quick Response Results Gross Margin 47% GM $ 146,891. Inventory Turns 4.48 Service Level 97% Sales $311,503. Lost Sales 2% GMROI 4.0 Honduras 807 Results Gross Margin 63% GM $ 155,265. Inventory Turns 1.96 Service Level 68% Sales $247,425. Lost Sales 29% GMROI 3.3
  • 31.
    Compare QR vsQR/807 Blend Sourcing for Seasonal Garment (20 weeks) Quick Response Results Gross Margin 47% GM $ 146,891. Inventory Turns 4.48 Service Level 97% Sales $311,503. Lost Sales 2% GMROI 4.0 QR/ 807 Blended Results Gross Margin 55% GM $ 171,629. Inventory Turns 3.72 Service Level 97% Sales $313,922. Lost Sales 2% GMROI 4.49
  • 32.
    QR vs. 807Conclusions 807 Sourcing produces more GM$, GM% Quick Response does better than Honduras 807 Sourcing in several commonly accepted measures. Quick Response dominates in terms of: Service Level, Inventory Turns, Lost Sales A blend of QR/807 sourcing performs well in all categories and has the best GM$ and GMROI
  • 33.
    Value of Collaboration - Case Study What is the value of reducing the lead times for raw materials and manufacturing process time in a textile supply chain?
  • 34.
    Collaborative SupplyChain Results Best Lead Time Fabric 2 weeks + 1 Apparel 1 week + 1 Min Order Fabric 1,000/500 Apparel 1/1 Typical Lead Time Fabric 6 weeks + 1 Apparel 2 weeks + 1 Min Order Fabric 10,000/5,000 Apparel 960/12
  • 35.
  • 36.
  • 37.
    Manufacturer’s Collaborative ResultsBest Case vs. Typical Total Revenue +20% Gross Margin +66% Inventory Turns(raw material) 7 vs. 4.8 Ship on Time 93% vs. 63%
  • 38.
    Research Results -General Replenishment increases Gross Margin $ Speed of replenishment & flexibility increases GM$ Assortment diversity decreases Gross Margin $ Price sensitivity vs. markdown strategy Not getting revenue return from markdowns Better strategy to collaborate and replenish
  • 39.
    Top Ten Leversfor Financial Performance (other than price) 1. Replenishment strategy 2. Service level 3. Assortment strategy 4. Forecasting 5. Make to order/make to stock 6. Lead time 7. Initial inventory 8. Minimum order quantities 9. Collaboration 10. Supply chain inventory placement
  • 40.
    References King, Nuttle,Hunter, 1991, A Stochastic Model of the Apparel-retailing Process for Seasonal Apparel , Textile Institute Whalen, Gilreath, Reeve, 1995, Time is Money , Bobbin March 1995 Hunter, King, 1997, Retail Performance Measures and the Sourcing Decision , National Textile Center Pinnow, King, 1997, Break Even Costs for Traditional versus Quick Response Apparel Suppliers , North Carolina State University IE Technical Report #97-4 King, Hunter, 1997, Quick Response Beats Importing in Retail Sourcing Analysis , Bobbin March 1997 Koloszyc, 1998, Apparel Retailers Use Simulator to Improve Sourcing Decisions , Stores August 1998 Kunz, 1998, Merchandising Theory Principles and Practice , Fairchild Books Maddalena, King, 1998, Replenishment Rules , Bobbin May 1998 Moon, Gokce, Maddalena, King, 1998, Proplenishment Makes a Payoff , Bobbin May 1999
  • 41.
    Thank you! Questions? Jim Lovejoy [TC] 2 919-380-2184 Russ King, NC State University 919-515-5186

Editor's Notes