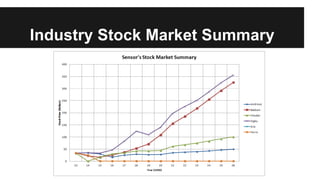
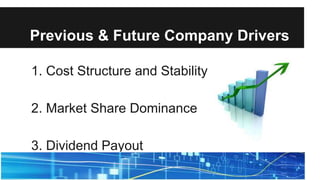
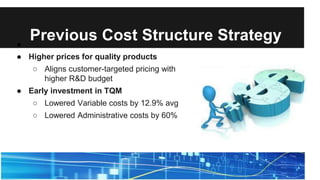
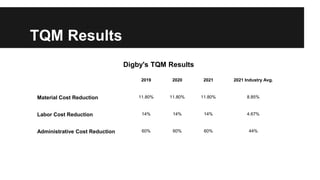
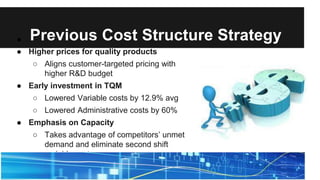
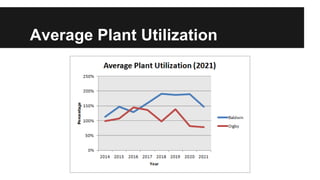
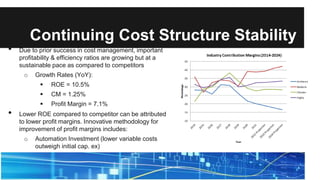
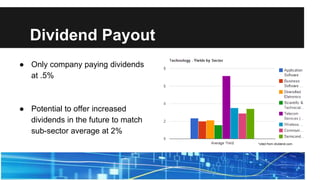
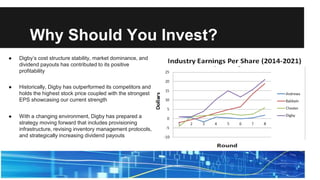
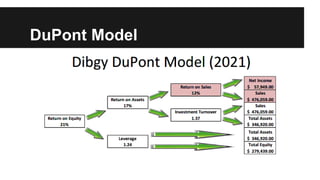
Digby’s Report to Shareholders
Industry #C59908
Presented by Eric Willinsky, Francis Naccarati, Maite Schloesser,
Clare Singley, Stephanie Radziminski, Mark Rapposelli
Promise to our Shareholders
Steady 10% annual increase
in stock prices over 5 years
Industry Stock Market Summary
Previous & Future Company Drivers
1. Cost Structure and Stability
2. Market Share Dominance
3. Dividend Payout
Previous Cost Structure Strategy●
● Higher prices for quality products
○ Aligns customer-targeted pricing with
higher R&D budget
● Early investment in TQM
○ Lowered Variable costs by 12.9% avg
○ Lowered Administrative costs by 60%
TQM Results
Digby's TQM Results
2019 2020 2021 2021 Industry Avg.
Material Cost Reduction 11.80% 11.80% 11.80% 8.85%
Labor Cost Reduction 14% 14% 14% 4.67%
Administrative Cost Reduction 60% 60% 60% 44%
Previous Cost Structure Strategy●
● Higher prices for quality products
○ Aligns customer-targeted pricing with
higher R&D budget
● Early investment in TQM
○ Lowered Variable costs by 12.9% avg
○ Lowered Administrative costs by 60%
● Emphasis on Capacity
○ Takes advantage of competitors’ unmet
demand and eliminate second shift
variable costs
Average Plant Utilization
Continuing Cost Structure Stability
• Due to prior success in cost management, important
profitability & efficiency ratios are growing but at a
sustainable pace as compared to competitors
o Growth Rates (YoY):
 ROE = 10.5%
 CM = 1.25%
 Profit Margin = 7.1%
• Lower ROE compared to competitor can be attributed
to lower profit margins. Innovative methodology for
improvement of profit margins includes:
o Automation Investment (lower variable costs
outweigh initial cap. ex)
o Inventory Management (targeted inventory levels
to prevent excess inventory costs)
ROE & Profit Margins for Industry
Market Share Dominance
● Focus on high market share to offset fixed costs
● Differentiate semi-homogenous product lines in a
competitive market through early promotional
marketing and bolstering R&D to mitigate
competitors power
● Digby’s Accessibility rate of 100% and Awareness
rate of 83% ultimately resulted in Market
Dominance
Average Product Awareness
Average Product Awareness (2019-2021)
2019 2020 2021
Andrews 41.60% 51.30% 51%
Baldwin 92.30% 94.70% 96%
Chester 54.70% 54% 55%
Digby 81% 81.80% 82.60%
Market Share Moving Forward
• Lower ROE also attributed to lower sales than competitor
• Opportunity to gain additional awareness and increase competitive
advantage by increasing the promotional budget & reducing sales budget
• Continued adherence on R&D and increased focus on catering product
lines to consumer demands mitigate customer power
o Product Age
o Product Price
o Product Reliability
Dividend Payout
● Only company paying dividends
at .5%
● Potential to offer increased
dividends in the future to match
sub-sector average at 2%
*cited from dividend.com
Why Should You Invest?
● Digby’s cost structure stability, market dominance, and
dividend payouts has contributed to its positive
profitability
● Historically, Digby has outperformed its competitors and
holds the highest stock price coupled with the strongest
EPS showcasing our current strength
● With a changing environment, Digby has prepared a
strategy moving forward that includes provisioning
infrastructure, revising inventory management protocols,
and strategically increasing dividend payouts
Appendix
● Dupont Model
● SWOT Analysis
● Porter’s Model
DuPont Model
DuPont Model
SWOT Analysis
Porter’s Model

Digby report to shareholders

  • 1.
    Digby’s Report toShareholders Industry #C59908 Presented by Eric Willinsky, Francis Naccarati, Maite Schloesser, Clare Singley, Stephanie Radziminski, Mark Rapposelli
  • 2.
    Promise to ourShareholders Steady 10% annual increase in stock prices over 5 years
  • 3.
  • 4.
    Previous & FutureCompany Drivers 1. Cost Structure and Stability 2. Market Share Dominance 3. Dividend Payout
  • 5.
    Previous Cost StructureStrategy● ● Higher prices for quality products ○ Aligns customer-targeted pricing with higher R&D budget ● Early investment in TQM ○ Lowered Variable costs by 12.9% avg ○ Lowered Administrative costs by 60%
  • 6.
    TQM Results Digby's TQMResults 2019 2020 2021 2021 Industry Avg. Material Cost Reduction 11.80% 11.80% 11.80% 8.85% Labor Cost Reduction 14% 14% 14% 4.67% Administrative Cost Reduction 60% 60% 60% 44%
  • 7.
    Previous Cost StructureStrategy● ● Higher prices for quality products ○ Aligns customer-targeted pricing with higher R&D budget ● Early investment in TQM ○ Lowered Variable costs by 12.9% avg ○ Lowered Administrative costs by 60% ● Emphasis on Capacity ○ Takes advantage of competitors’ unmet demand and eliminate second shift variable costs
  • 8.
  • 9.
    Continuing Cost StructureStability • Due to prior success in cost management, important profitability & efficiency ratios are growing but at a sustainable pace as compared to competitors o Growth Rates (YoY):  ROE = 10.5%  CM = 1.25%  Profit Margin = 7.1% • Lower ROE compared to competitor can be attributed to lower profit margins. Innovative methodology for improvement of profit margins includes: o Automation Investment (lower variable costs outweigh initial cap. ex) o Inventory Management (targeted inventory levels to prevent excess inventory costs)
  • 10.
    ROE & ProfitMargins for Industry
  • 11.
    Market Share Dominance ●Focus on high market share to offset fixed costs ● Differentiate semi-homogenous product lines in a competitive market through early promotional marketing and bolstering R&D to mitigate competitors power ● Digby’s Accessibility rate of 100% and Awareness rate of 83% ultimately resulted in Market Dominance
  • 12.
    Average Product Awareness AverageProduct Awareness (2019-2021) 2019 2020 2021 Andrews 41.60% 51.30% 51% Baldwin 92.30% 94.70% 96% Chester 54.70% 54% 55% Digby 81% 81.80% 82.60%
  • 13.
    Market Share MovingForward • Lower ROE also attributed to lower sales than competitor • Opportunity to gain additional awareness and increase competitive advantage by increasing the promotional budget & reducing sales budget • Continued adherence on R&D and increased focus on catering product lines to consumer demands mitigate customer power o Product Age o Product Price o Product Reliability
  • 14.
    Dividend Payout ● Onlycompany paying dividends at .5% ● Potential to offer increased dividends in the future to match sub-sector average at 2% *cited from dividend.com
  • 15.
    Why Should YouInvest? ● Digby’s cost structure stability, market dominance, and dividend payouts has contributed to its positive profitability ● Historically, Digby has outperformed its competitors and holds the highest stock price coupled with the strongest EPS showcasing our current strength ● With a changing environment, Digby has prepared a strategy moving forward that includes provisioning infrastructure, revising inventory management protocols, and strategically increasing dividend payouts
  • 16.
    Appendix ● Dupont Model ●SWOT Analysis ● Porter’s Model
  • 17.
  • 18.
  • 19.
  • 20.