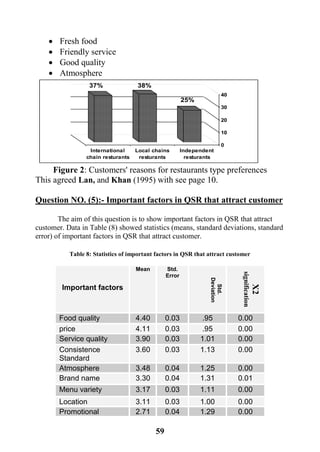
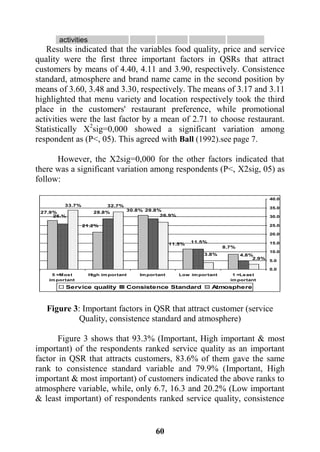
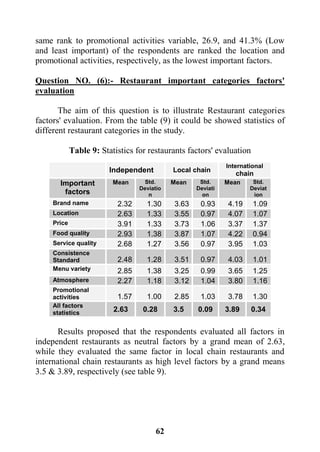
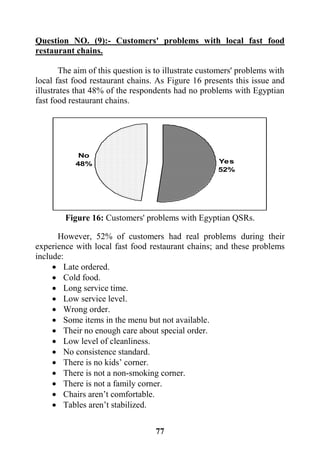
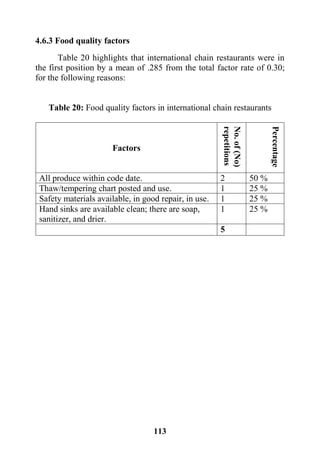
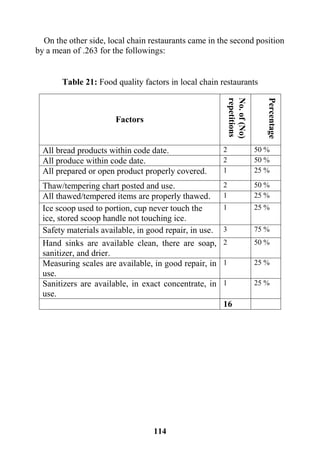
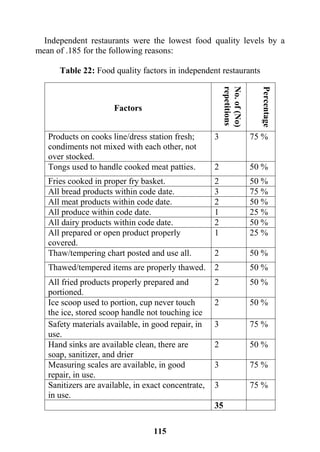
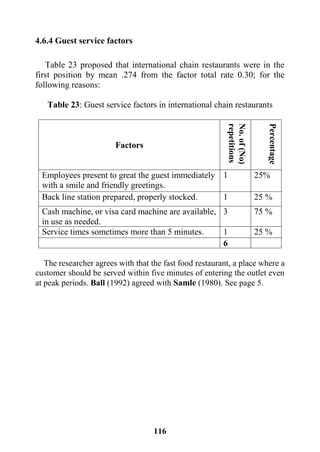
1
Faculty of Tourism &Hotel Management
Hotel Management Department
EVALUATING THE EXPERIMENT OF LOCAL
RESTAURANT CHAINS COMPARED WITH THE
INTERNATIONAL CHAINS IN EGYPT
Thesis
Submitted in partial fulfillment of the requirements of Helwan University for
Master of Science in Hotel Management
By
Hany Atef Kouzmal
B. Sc., Hotel Management, 2000
Under the Supervision of
Prof. Dr. Ahmed Nour El-Din Elias
Prof; Hotel Management Department
Faculty of Tourism & Hotel Management,
Helwan University.
Assistant prof. Rania Dinana
Assistant Prof; Hotel Management Department
Faculty of Tourism & Hotel Management,
Helwan University.
Dr. Mahmoud Roushdy El Maghraby
Regional Vice President of Finance Middle East,
Sonesta International
2009
2
APPROVAL SHEET
TITLE: EVALUATING THE EXPERIMENT OF LOCAL
RESTAURANT CHAINS COMPARED WITH THE
INTERNATIONAL CHAINS IN EGYPT
NAME: Hany Ateef Kouzmal Mikhaiel
This Thesis for the M.Sc. in Hotel Management has
been approved by:
Prof. Dr. ---------------------------------
Prof. Dr.----------------------------------
Prof. Dr.---------------------------------
Committee in Charge
Degree Conferred in / / 2009
3
DEDICATION
TO
MY DEAR WIFE
4
ACKNOWLEDGEMENTS
Primarily, I would like to express my deepest respect and
appreciation to Prof Dr Ahmed Nour El-Dein Elias Head of Hotel
Management and Ex Dean Faculty of Tourism and Hotel Management,
Helwan University, for his guidance, cooperation, and also his valuable
advice which helped point me in the right direction. Therefore, because
of his time, effort, and continual assistance brought about by his
knowledge of this subject, I offer to him my sincerest gratitude, with
great thanks.
Also, I would like to thank Dr Rania Dinana, Assistant Prof; in
Hotel Management, Faculty of Tourism and Hotel Management
Department, Helwan University, for her supervision, guidance,
encouragement, assistance, and her support throughout the preparation
of this Thesis.
Also, I would like to express my deepest respect and gratitude to
Dr. Mahmoud Roushdy El Maghraby, Regional Vice President of
Finance Middle East, Sonesta International, and Visitor lecturer, Hotel
Management Department, Faculty of Tourism and Hotel Management,
Helwan University, for his continuous support and encouragement,
coupled with his invaluable advice.
Finally I would like to express my deepest thanks to my dear
family, and my friends, who supported me and encouraged me
throughout the work on this Thesis.
5
Table of Contents
Page
CHAPTER ONE:
THE PROBLEM AND ITS SETTINGS
1.1. Introduction 1
1.2. Organization of the Research 2
1.3. Abbreviations 3
1.4. Limitation of the Research 4
1.5. The Research Objectives 4
CHAPTER TWO:
REVIEW OF LITERATURE
2.1. Overview on Fast-Food Operations
2.1.1 Fast Food Concept 5
2.1.2 Customers Perception on Fast-Food 8
2.1.3 Local and International Restaurant Chains 9
2.2. Quality of Food and Service
2.2.1 Quality Concept
2.2.2 Product Quality 11
2.2.3 Food Quality 12
2.2.4 Food Service Quality 14
2.3. Elements of Competition
2.3.1 Location 15
2.3.2 Pricing 16
2.3.3 Demand 16
2.3.4 Training 16
2.3.5 Operational Systems 17
2.3.6 The Element of Risk/Failure 18
2.3.7 Product Branding 21
2.3.8 Product Value 22
2.3.9 Marketing 24
2.3.10 Promotional Element 26
6
2.3.11 Services for Children 27
2.3.12 Atmosphere (Surroundings) 28
2.3.13 Customer Satisfaction 28
CHAPTER THREE:
MATERIALS AND METHODS
3.1. Materials
3.1.1 Population Survey 31
3.1.2 Samples 31
3.1.2.1 Samples from Independent Establishments
3.1.2.2 Samples from Local Establishments
3.1.2.3 Samples from International Establishments
3.2. Methods
3.2.1 Primary Data
3.2.1.1 Guest Questionnaire 34
3.2.1.2 In-depth Personal Interviews 35
3.2.1.3 Checklist 35
3.2.2. Secondary Sources 36
3.2.3. Pilot Study 36
3.2.4. Data Analysis 37
CHAPTER FOUR:
RESULTS AND DISCUSSIONS
4.1. Introduction 38
4.2. Questionnaire Response Rate 39
4.3. Questionnaire Analysis Results and Discussion 39
4.4. Interview Response Rate 67
4.5. Interview Analysis Results and Discussion 67
4.6. Checklist Analysis Results and Discussion 94
7
CHAPTER FIVE:
SUMMARY, CONCLUSION AND RECOMMENDATIONS
5.1. Summary 111
5.2. Conclusion 114
5.3. Recommendations 118
REFERENCES 119
APPENDICES
APPENDIX (A1) Guest Questionnaire Form 127
APPENDIX (A2) In-depth Personal Interviews Form 137
APPENDIX (A3) Checklist Form 143
ARABIC SUMMARY
8
List of Tables
Table Title Page
1 Abbreviations list 3
2 The main features of modern fast food concepts
3 Samples from the establishments 32
4 Menu specialty of the selected Quick Service
Restaurant QSR 33
5 Questionnaire response rate. 39
6 Customers' preferable meal 41
7 Statistics for customers' restaurants preferences 42
8 Statistics of important factors in QSR that attract
customer 44
9 Statistics for restaurants factors' evaluation 47
10 Restaurant categories factors' ranking 48
11 Personal data analysis 66
12 Interview's response rate 67
13 Statistics of restaurants factors' evaluation 75
14 Restaurant categories factors' ranking
according to their means 76
15 Checklist results 94
16 Exterior factors in independent restaurants 95
17 Interior factors in international chain restaurants 96
18 Interior factors in local chain restaurants 96
19 Interior factors in independent restaurants 97
20 Food quality factors in international
chain restaurants 98
21 Food quality factors in local chain restaurants 99
22 Food quality factors in independent restaurants 100
23 Guest service factors in international chain
restaurants 101
24 Guest service factors in local chain restaurants 102
25 Guest service factors in Independent restaurants 103
9
26 Employee appearance in international chain
restaurants 104
27 Employee appearance in local chain
restaurants 104
28 Employee appearance in independent
restaurants 105
29 Management behaviors/ functions in
International chain restaurants 106
30 Management behaviors/ functions in local
chain restaurants 107
31 Independent restaurants 108
32 Restaurant categories rating scale 107
11
List of Figures
Figure Title Page
1 Customer's preferences to eat fast food. 40
2 Customers' reasons for restaurants type
preferences. 44
3 Important factors in Quick Service Restaurant
QSR that attract customer (service quality,
consistence standard and atmosphere). 45
4 Important factors in QSR that attract customer
(brand name and menu variety). 46
5 Important factors in QSR that attract customer
(location and promotional activities). 46
6 Brand name factor's evaluation in QSRs. 50
7 Location factor's evaluation in QSRs. 51
8 Price factor's evaluation in QSRs. 52
9 Food quality factor's evaluation in QSRs. 53
10 Managers' evaluation for local fast food
operations. 54
11 Consistence standard factor's evaluation
in QSRs. 55
12 Menu variety factor's evaluation in QSRs. 56
13 Atmosphere factor's evaluation in QSRs. 57
14 Promotional activities factor's evaluation
in QSRs. 58
15 Customers' evaluation for the experiment of
Egyptian QSRs. 59
16 Customers' problems with Egyptian QSRs. 62
17 Managers evaluation for QSRs in Egypt. 68
18 Egyptian market expectations about fast
food concept. 69
19 Egyptian customers' needs and preferences. 70
11
20 Managers' ways to deal with customers' needs
and preferences. 71
21 International chain restaurants' attributes. 72
22 Managers' evaluation for local fast food
operations. 73
23 Managers' opinions in using international concept
by local fast food operations. 74
24 Managers' evaluation of brand name factor
in QSRs. 77
25 Managers' evaluation of location factor
in QSRs. 78
26 Managers' evaluation of price factor in QSRs. 79
27 Managers' evaluation of food quality factor
in QSRs 80
28 Managers' evaluation service quality factor
in QSRs. 81
29 Managers' evaluation consistence standard factor
in QSRs. 82
30 Managers' evaluation of atmosphere factor
in QSRs. 83
31 Managers' evaluation of promotional activities
factor in QSRs. 84
32 Labor turn over rate in QSRs . 85
33 Means to decrease turn over rate in QSRs. 86
34 Managers' evaluation of training level
in QSRs. 87
35 Managers' evaluation for marketing strategies
in QSRs. 88
36 Managers' evaluation for quality level
in QSRs. 89
37 The extent of product development to meet
customers' needs in QSRs. 90
38 Customers satisfaction measuring methods
in QSRs. 91
12
CHAPTER ONE
THE PROBLEM AND ITS SETTINGS
13
1.1 Introduction
Food service away from home is essential to tourism. Food
service industry becomes one of the fastest growing industries, because
of many social and commercial changes around the world. Most
modern industry requires that individual travel and work at a distance
from home; thus, food service industry plays a required supporting role
in providing food for these individuals. In addition to food and
beverage away from home, food service industry provides
convenience, communication settings and a wide variety of outputs
contributing to life's quality. Among the latter, entertainment /
diversions; and ambiances are contributing to variety in living
experiences. Food service industry is a major generator of jobs. The
group of firms providing food and restaurant supplies has been found a
substantial source of economic base in itself. Food service industry also
supports the community infrastructure through utility systems and local
taxes.
Recently, fast food restaurant chains have spread out,
blossoming all around the world. Such chains are based on some
factors for their success: such as cleanliness, food quality, value,
atmosphere, location, and speed of service. In Egypt there are many
of fast food restaurant chains; some of which are domestic in origin,
like Wessaya, Mo`Men, Cook Door, Felfela, Makani, and Gado, other
chains such as McDonald's, Burger King, Hardee's, and Kentucky
fried chicken (KFC), are international franchised operations.
These domestic chains are seeking to compete with the
international chains in quality, level of services offered, universal
reach and spreading around the Arab and foreign countries. This can
be achieved by a good reputation that will give better profits.
Therefore, it is necessary to carry out a comparative study to
evaluate the experiment of the local restaurant chains compared to the
international restaurant chains running in Egypt.
14
1.2. Organization of the Research
With regard to the organization of the paper, this thesis has been
developed over five chapters;
Chapter One: "the Problem and its Settings". This chapter sets
out the basic framework of the thesis. The components include an
introduction, organization, a definition of terms and abbreviations,
limitations, and objectives.
Chapter Two: "Review of Literature". This chapter looks at the
literature upon which the subject has been researched.
Chapter Three: "Materials and Methods". This shows the way in
which the data was collected. The information includes the population,
research, the design, treatment of the data and the instruments used for
the research.
Chapter Four: "Results and Discussion". This sets out the
analysis of the data in exactly the same way as chapter three
concerning the points of research.
Chapter Five: "Summary and Recommendations". This chapter
provides a summary based upon the information’s received or
suggested, the obtained results and recommendations of the study.
15
1.3. Abbreviations
Abbreviations used throughout the thesis are defined as follows:
Table 1: Abbreviations list
Professorprof
Quick Service RestaurantQSR
National Restaurant AssociationNRA
Information TechnologyIT
Quality ControlQC
Quality AssuranceQA
Total Quality ManagementTQM
Continuous Quality ImprovementCQI
NumberNO
Define - Measure - Analyze - Improve-
Control
DMAIC
Quality Function DevelopmentQFD
Product Life CyclePLC
Critical Control PointsCCPs
New Product DevelopmentNPD
Points of DistributionPODs
Hazard Analysis Critical Control PointHACCP
Designated Market AreaDMA
Strengths, Weaknesses, Opportunities, and
Threats
SWOT
On the Job TrainingOJT
Skills Based PaySBP
Electronic Point-of-SalesEPOS
Target RestaurantTR
Public RelationsPR
Product, Price, Place, and Promotion4Ps
Unique Servicing ProportionUSP
Point of SalesPOS
Identification DataID
Other People DataOPD
Chamber of Tourism EstablishmentsCTE
Statistical Package for Social ScienceSPSS
Standardstd
X2
SignificationX2
sig
16
1.4. Limitations of Research
Study limitations are represented in the following points:-
1.4.1. Place limitation: Unfortunately, it was difficult to assess
many of the fast food chains in Egypt due to, costs, time involved, and
the accessibility to these chains. For these reasons, the ones which were
looked at were limited to four samples from the independent fast food
restaurants in Sharm El Sheikh, four from the famous local fast food
chains as well as four international chains in Sharm El-Sheikh.
1.4.2. Time limitation: The field study was implemented in the
period from September 2006 to August 2007.
1.5. Research Objectives
 This study is aimed at :
1. Evaluating the experiment of local restaurant chains as
compared with the international ones.
2. Defining the factors needed to development the local
restaurant chains to reach the international standard.
3. Evaluating international chains product developing.
17
CHAPTER TWO
REVIEW OF LITERATURE
18
2.1. Overview on Fast-Food Operations
2.1.1 Fast Food Concept
The National Restaurant Association (NRA) defines the food
service industry as "encompassing all meals and snacks prepared outside
the home". This definition therefore includes all take – out meals and
beverages. Khan (1991)
Ball (1992) agreed with Samle (1980) that the fast food restaurant, a
place where a customer should be served within five minutes of entering
the outlet even at peak periods. While Melaniphy (2005) classified fast
food according to the product as it is prepared and cooked quickly, with a
service delivery varying between 2 to 15 minutes, a low price, easily
consumed with fingers or disposable cutlery. Brymer (1995) defined a
quick service restaurant as a "firm with a mission to provide quicker
service and core technology geared towards this mission. However,
Walker (2006) considering that quick-service restaurants offer a quick
service. Negl (2002) identified that as fast service restaurants in
recognition of the fact that the service is fast, not the food.
Lane and Duper (1997) explained that in preference to fast food
restaurant tend to be located near highways, malls and down town areas
which offer a standard menu with limited choices that attempt to satisfy a
hungry audience. Moreover, Walker (2006) highlighted that quick-
service restaurants have increased in popularity because of their
location strategies. They are situated for convenience in every possible
area. Their menus are limited, which makes it easy for customers to
make quick decisions on what to purchase.
 Classification of fast food operations according to according
menu specialty
Walker (2006) agreed with Brymer (1995) in that classifying the
quick service restaurants segments is according to the menu specialty.
That specialty could be hamburger, pizza, chicken, snacks, sandwich,
Mexican, or seafood. They are the leaders for each segment according to
the spread, the popularity, and the volume of sales
19
 Classification of fast food operations according to restaurant
characterization
Traditional fast-food restaurants
Ball (1992) reported that the traditional fast food operations include
fish and chip shops, ethnic, take away and sandwich bar operations, they
are mostly owned by individuals. Scanlon (1998) stated that the
traditional fast - food restaurants are concentrated on items from the menu
such as hamburgers, pizza and chicken,
Modern fast food restaurants
These have been identified with fast food chains, which are designed
around systems of catering which have been linked to
manufacturing production lines with the design and layout of
restaurants, the scheduling and planning of a work place, etc.,
being systematically planned to produce consistently standardized
products. Simplified menus characterize these restaurants and
chains which dominate a high standard of service, training and
decor. Modern operations usually offer a combination of eat on the
premises, take away drive. The main features of modern fast food
concepts are shown in Table 2 as suggested by Ball (1992).
21
Table 2: The main features of modern fast food concepts
Features Description
Food
materials
Consistent and controllable quality, precisely specified,
equally portioned.
Type of
products
Suitable for quick and retention for short periods
without deterioration.
Organization Highly organized routines with precise job
specifications and procedures.
Operation Usually planned for large throughput and high sales
volume (including counter sales)
Cost control Prices portion and cost control, permitting relatively
small margins and competitive pricing.
Quality
control
Standard preparation, cooking and serving routines laid
down, including the discarding or sub-standard food
(e.g. maximum time for keeping food before serving).
Hygiene Exacting equipments emphasized as a part of product
reliability, including measures to reduce litter (in store
and neighborhood).
Packing Products distinctively packaged (disposables), easy to
handle (usually finger held, suitable for over-the-
counter or table meals).
Research Product research and consumer response testing
essential. On-going research into changing food
preference sand attitudes is necessary to develop
concepts.
Variety May be provided in product range offered or by
variations in one basic product (dressings, fillings,
supplements).
Markets Usually targeted at wide, classless society, primarily
young of family group.
Promotion Emphasis is given to value for money, consistent
quality and cleanliness. Particular products may be
differentiated by originality, size, cost competitiveness,
variety of choices or fillings, healthy eating, and
friendly service.
Source : Ball (1992)
21
2.1.2 Customer Perceptions
Johnson and Clark (2005) illustrated that while the expectation-
perception approach to understanding service quality is extremely useful
in focusing on the outcome of customer satisfaction and helps identity on
mismatches between operational and customer views of quality, which
does have some downsides.
 Service could be perceived to be 'good' when it is 'bad'.
 Service could be perceived to be 'bad' when it is 'good'
 Service that was 'good' last time may only be 'OK' this time.
 Satisfied customers may switch.
King and Ronald (2006) differentiated between quality in fact and in
perception and they stated that quality in fact relates to our internal
standard, we get what we expect, so set high expectations. Quality in
perception is how our customers perceive our service.
Customer differences
Foster (1993) highlighted that different people have different nations
about what type of food tastes good, but a successful food and beverage
operation is able to consistently satisfy the majority of its guests. Peppers
and Rogers (1997) argued that customers are different in two primary
ways: They need different things from the enterprise, and they have
different value to the enterprise. A customer's value will depend largely
on how long the customer remains loyal, and even small increases in the
state of customer retention add significantly to customer's value. Knowing
what different customers need involves much more than simply tallying
what they've bought, because two customers might buy the same product
for quite different reasons. Powers and Barrows (2006) illustrated that
the guest is also apart of the service transaction. A guest who is not
feeding well or who takes a dislike to member of the staff may have a bad
experience in spite of all efforts to please.
22
2.1.3 Local and International Restaurant Chains
Independents restaurants
King and Ronald (2006) declared that independent is one who is not
bound by or definitively committed to another, and it a particular brand or
company. While Walker (2006) highlighted that one or more owners,
usually involved in the day-to-day operation of the business, typically
own individual restaurants (also called Indies). Even if the owners have
more than one store, each functions independently. These restaurants are
not affiliated with any national brand or name. They offer the owner
independence, creativity and flexibility, but with an element of risk.
Wade (2006) mentioned that between the independent and chains lies
at least two other possibilities, some dependent operations are so
successful that they open additional units without, however, becoming as
large as to lose the hands on approach of the owner operator. Independent
group operators are not exactly chains, but more a longer single unit. The
other possibility and one that is pursued by thousands of business people
are franchise operations.
Chains restaurants
King and Ronald (2006) defined chain as a group of enterprises or
institutions of the same kind of function usually under a single
ownership, management or control. Walker (2006) stated that chain
restaurant comprises a group of restaurants, each identical in market,
concept, design, service, food and name. Part of the marketing strategy
of a chain restaurant is to remove uncertainty from the dining
experience. The same menu, food quality, level of service and
atmosphere can be found in any one of the restaurants, regardless of its
location. Family run teams or other entrepreneurs usually own them.
Wade (2006) agreed with Powers and Barrows (1999) in that chain
are playing a growing role in food service. Moreover, they are prominent
among the companies that recruit graduates for hospitality programs.
23
Chains have strengths of seven different areas:
(1) Marketing and brand recognition
(2) Site selection expertise
(3) Access to capital
(4) Purchasing economies
(5) Centrally administered control and information systems
(6) New product development
(7) Human-resource development
International versus local fast food chain
According to Lan, and Khan (1995) fast food operations are divided
into two categories; international chains and local chains where each have
a different approach to the operating and management.
The international fast food chains have a core product (hamburger,
chicken or pizza). They focus on image building through progressive
marketing which gains mass production and the central distribution
international fast food chains are expanding through franchising.
Meanwhile the local fast food chains are expanding through private
ownership and building their image through products. Local fast food
operations do not have mass production or central distribution; therefore,
they became labor intensive.
24
2.2. Quality of Food and Service
Quality Concept
Wyckoff (2001) highlighted that quality is the degree of excellence
for what is intended add to this a controlled variation in order to
achieve that excellence, where the end result is meeting customer
requirements. While Schroeder (2004) stated that quality is meeting
and exceed customer requirements now and in the future." This means
that the product or service is fit for the customer's use. Fitness for use
has related to benefits received by the customer and to customer
satisfaction. Only the customer, not the producer, can determine it.
Noel and Cullen (1996) mentioned that quality is a process, not a
procedure and as such is never finished. The culture of quality promotes
and sustains change. Stutts and Wortman (2006) added that quality
could be defined as "The consistent delivery of product and services
according to expected standards. King and Ronald (2006) stated that the
other half of the definition of quality is "doing things right." Doing things
right simply means meeting customers needs and expectations more
rapidly and at a reduced cost. It is customer orientation, innovation,
teamwork, and everyone's responsibility.
Quality importance
Field (1999) reported that quality is the major driver of overall
satisfaction, while price and service tied for second place. Sideman and
Johnson (2002) argued that providing consistent quality service has
become a challenge for the quick service industry. Schroeder (2004)
indicated that quality can both improve revenues and reduce costs. The
cost of quality measures the lack of conformance to customer
requirements. Quality costs can be convention or appraisal. Failure costs
may be due to internal or external failures.
25
2.2.2. Product Quality
Product concept
The actual good or service offered for sale. It could include all of the
features of the good or service as well as the packaging and brand name
of the good or service. Powers and Barrows (1999) illustrated that in a
restaurant, this involves not only the food service the way the server and
guest interact and the atmosphere of the place. Reid and Bojanic (2006)
agreed with Etzel (2004) in that product refers to all of the goods and
services that are bundled together and offered to consumers. Nearly, every
product sold includes tangible and intangible elements.
Product Quality and Customer Satisfaction
Peppers and Rogers (1997) indicated that there is, of course, no
substitute for quality. No customer will return for more of a bad product,
so having product quality at least on a par with the competition is
essential for 1:1 enterprise. Customer satisfaction is the opposite of
customer dissatisfaction, and dissatisfaction is one sure route to defection.
Keep in mind, however, that customer satisfaction by itself is usually not
sufficient to generate loyalty. Wade (2006) agreed with Negl (2002) in
that customer feedback is vital to keep the menu fresh. Feedback from
customers helps to improve product quality, which in turn increases sales
and products higher profits.
2.2.3. Food Quality
Reay (1983) pinpointed that any food product specification involves
consideration of factors such as those set out below:
1. The quantity of goods – based on the standard recipe.
2. The quality and grade of ingredients.
3. The dimensions of the finished item, e.g. the thickness of the pastry
and the weight and type of filling.
4. The nature of the glaze.
5. The degree browning.
26
6. The type, size and shape of the garnish.
7. The type of packaging to be used
8. The layout and wording of labels
9. The product life
10.The storage requirements
Wiley and Sons (2006) illustrated that the quality of food depends on
two factors: the skill with which it's prepared, and the basic quality of the
foodstuffs use to this might be added the perception of novelty factor
Briggs (2000) stated that food, whether raw or cooked is a perishable
commodity and has a limited life and so caterers have to ensure that they
buy produce in the correct quality and quantity in relation to customer
demand and that it is correctly stored and processed. The choice of food
and drink revolves around the menu, which is limited or extensive, and
whether it concerns a particular product, if there is a varied choice, and
the quality of the product offered, and it is fresh or convenience. Other
factors include portion sizes and the availability of children's menus along
with consistency, range of tastes, textures, aromas, and colours and
presentation of the food and drink. Dharmaraj (2002) believes that poor
quality food can destroy the commercial credibility. Seidman and and
Johnson (2002) argued that keeping consistency of food quality is a
though task for all suick service restaurant QSR chains.
27
2.2.4 Food Service Quality
ConceptServiceFood
The service is all action and reactions that customers perceive
whichthey have purchased. In hospitality, service performed for the guest
by people or by systems. The emphasis in definition is on the guest's total
experience. Indeed, from the guest's point of view, service is the
performance of the organization and its staff. Schroeder (2004)
mentioned that most definitions of service stress the intangible and cannot
be easily quantified or defined. A better definition is that service is
produced and summed simultaneously, and consumption. Reid and
Bojanic (2006) defined a service as an intangible product that sold or
purchased in the marketplace.
Meanwhile Kotler and Armstrong (1996) stated that service means
"all features, acts, and information that augment the customer's ability to
realize the potential value of a product or service.
Powers and Barrows (2006) confirmed that the basis of service
strategy is market segmentation, largely on consumer service expectation.
Successful service companies develop a service culture cased on
commitment by top management. Consistency between policy and
practice and well developed channels of communication. Because service
people are a part of the product, a good service team is essential, service
teams based on careful selection, training, and on motivational programs
that include rewards and involvement in service planning. Because most
hospitality products are strikingly similar, service is the most significant
sustainable competitive advantage
Noel and Cullen (1996) stated that zero defects is the standard that
service organizations must set this very high standard, however, is set in
the context of customer expectations for a particular segment and
operation type. At a McDonald's waiting lines can expect during the rush
hour and will accept as long as they move with reasonable speed.
However, a dirty or cluttered McDonald's, even in a rush period, scents a
defect. Zero - defects committee should formed from members of the
quality improvement team.
28
2.3. Elements of Competition
2.3.1. Location
Powers and Barrows (2006) stated that marketing place refers to
the location, the place where the good or service is offered. Place refers
not only to the property's location, but also to the channels of distribution.
Reid and Bojanic (2006) agreed with Powers and Barrows (1999) in that
the place component refers to the manner in which the products and
services being delivered to consumers.
Ridgeway and Ridgeway (1994) indicated that location is, of course,
extremely important. All businesses are near potential customers but this
may be less important for an outside catering company than for a
restaurant. Moreover Briggs (2000) reported that the location of the food
service facility might said to be the most important feature. Services,
which are not appropriately located, may not successfully perform.
Powers and Barrows (1999) stated that the success of most
restaurants also enhanced by a location near the heart of major traffic
patterns. The technique for analyzing location potential requires a special
kind of knowledge, and chains can afford real estate departments that
possess that expertise.
Seidman and Johnson (2002) considered that location is an old
topic but with new content. Chinese QSR chains are entering various
non-traditional venues. These venues include shopping mall food
courts, leading supermarket, retail chains, neighborhood centers, key
intersections, university and college campuses, and airports, casinos,
and sports arenas. Powers and Barrows (2006) stated that restaurant
companies have developed downsized units for places where a traditional
unit will not fit. These units often take the form of a mobile cart requiring
minimal investment. The name given these new units is points of
distribution (PODs).
Wade (2006) argued that the presents of quick-service operations in
every market of any size is a key characteristic of quick service and one
29
of the main factors sporting its growth over the past 50 years. Because of
their many locations, they make eating out convenient.
2.3.2 Pricing
The price is the amount of money and/or other items with utility
needed to acquire a product. Recall that utility an attribute with the
potential to satisfy wants. The price has a tremendous impact on the
success or failure of a product.
Etzel (2004) mention that price is significant in economy, in the
costumer's mind, and in an individual firm let's consider each situation
some prospective customers are interested primarily in law prices,
whereas another segment is more concerned with other factors, such as
service, quality, value, and brand image. It is safe to say that few, if any
customers are attentive to price alone or are entirely oblivious to price.
Powers and Barrows (2006) confirmed that there is a risk in price
reduction, namely, that the lower price will denote a cheapened product to
the customer. As with virtually all marketing activities, the key is to keep
prices in line with customer expectations and to offer products that
perceived to be a good value to the customer.
2.3.3 Demand
The market demand is the demand for a product or service.
2.3.4. Training
Stutts and Wortman (2006) agreed with Noel and Cullen (1996) in
that training is the process of integrating personal and organizational
goals. Donnelly et al. (1998) indicated that inadequate training can be a
major barrier to quality. Hill and Jones (1998) found that a company that
employs individuals with high skills is likely to be more efficient than one
employing less skilled personnel.
31
2.3.5 Operational Systems
Powers (1995) declared that a standard exterior appearance gives
many chain operators a high recognition value. Hill and Jones (1998)
indicated that standardization refers to the degree to which a company
specifies how decisions are to been made so that employees' behaviour
becomes predictable. Gouville and Soman (2001) explained that the
hospitality industry commonly bundles goods and services. Firms
routinely offer single units of different products or multiple units of the
same product, for one price. Seidman and Johnson (2002) described that
the quick service industry is characterized by regular interaction between
customer and employee. Built around service encounters designed to be
consistent and predictable, the nations of reutilization and standardization
are central to the industry.
Donnelly et al. (1998) argued that once the quality characteristics
have defined, the next step is to determine the desired quality standards.
These standards quantify the specific quality requirements for the
organization's output. Quality standards serve as the reference point for
comparing what is "ideal" to what actually "is". Reid and Bojanic (2006)
considered that before you can evaluate the level of service provided by
employees within your organization, you must establish the standards by
which they will judge. Wade (2006) believes that the marketing plan
must specify the restaurant's standards for food quality and consistency,
beverage operations, cleanliness, and service. Clearly stating the
standards in the document provides management with a written document
to reference.
From point of view of Wade (2006) the broke bone of the operating
system is typicality a set of comprehensive operations manuals and a
complete set of recipes that cover all products on the menu. The operation
manual sets forth operating procedures from opening to closing and
nearly everything in between. All major equipment operations and routine
maintenance are been described in the operation manual or a separate
equipment manual. Define how things been done based on experience,
organization standards, and customer expectations. Organizational
systems also explain who is involved and why.
31
As the production is the process wherein the food is converted to the
state in which it will be served. Pepper et al. (1984) illustrated that fast
food operations handle huge amounts of food in a short time. They could
never keep up with their customer's demands if they did not use mass
production methods. Mass production means buying, preparing, and
serving in large quantities. Powers and Barrows (2006) confirmed that
some kinds of operations are ideally suited to the production-line
approach to service. Quick service restaurants amusement parks and
budget motels come to mind as having the need for the cost efficiency of
the production approach. Powers (1995) mentioned that all of the quick
service restaurants (QSR) operations try to simplify their production
processes and use self-service.
2.3.6 The Element of Risk and Failure
Risk concept
Wiley and Sons (2006) described that many people will tell that the
restaurant business is the highest-risk business in the retail spectrum. This
simply is not true. The failure rate for eating places in the general is
below the average business failure rate nationwide. Camera, furniture, and
apparel stores regularly top the failure list.
Powers and Barrows (1999) argued that franchising is not risk free.
The franchisee is generally completely dependent on the franchise
company for not only marketing but often or purchasing and other
operations-oriented assistance. Wade (2006) explained that failure is
much less common among franchised restaurants than among independent
operation.
Elements of restaurants success and failure
Powers and Barrows (1999) believed that all advertising will be
effective only if consumers get exactly what expect. Therefore, chains
concentrate on ensuring consistency of quality and service in operations.
Customers know what to expect in each of the units and, in an
increasingly mobile society that is important.
32
Parsa et al. (2005) pinpointed the elements of success and failure as
follows:
1. Elements of success
A. Have a distinctive concept that been well researched.
B. Ensure that all decision make long-term economic sense.
C. Adapt desirable technologies, especially for record keeping and
tracking customers.
D. Educate mangers through continuing education at trade shows and
workshops an environment that fosters professional growth has
better productivity
E. Effectively and regularly communicate values and objectives to
employees in one instance.
F. Maintain a clear vision, mission, and operation strategies, but be
willing to amend strategies as the situation changes.
G. Create a cost conscious culture, which includes stringent record
keeping.
H. Focus on one concentrated theme and develop it well.
I. Be willing to make a substantial time commitment both to the
restaurant and to family.
J. Create and build a positive organization culture through consistent
management.
K. Maintain management flexibility.
L. Choose the location carefully, although having a good location.
2. Elements of failure:
A. Lack of documented strategy; only informal or oral communication
of mission and vision; lack of an organizational culture fostering
success characteristics.
B. Inability or unwillingness to establish and formalize operational
standards; seat-of-the-pants management.
C. Frequent critical incidents; managing operations by "putting out
fires" appears to be a common practice.
D. Focusing on one aspect of the business at the expense of the others.
E. Poor choice of location.
F. Lack of match between restaurant concept and location.
G. Lack of business experience or knowledge of restaurant operations.
H. Poor communication with consumers. Negative consumer
perception of value price and product must match.
33
I. Inability to maintain operational standards leading to too many
service gaps. Poor sanitary standards are almost guaranteed to kill a
restaurant.
Wiley and Sons (2006) pointed out that the stark reasons for
business failure are worthy of study these include in competence,
lack of line experience, lack of managerial experience and quite
important, unbalanced experience. Inadequate funds run out of
money before the restaurant attracts enough customers to go into
profit. Poor management is a catchall phrase, but should not be
dismissed on those grounds.
The way to success
Hill and Jones (1998) considered that avoiding failure requires a
constant focus on the basic building blocks of competitive advantage,
continuous improvement, learning identification, adoption of the best
industrial practice, and victory over inertia. Huber and Pilmanis (2001)
mentioned that there are primarily five customer sale channels: delivery,
dining, takeout, pickup window and catering. In the QSR industry, IT has
been commonly used for order processing, accounting, purchasing,
marketing, consumer behavior and the location of new restaurants. Parsa
et al. (2005) explained that perhaps the key finding was that a successful
restaurant requires focus on a clear concept that drives all activities. In
this finding, concept is distinct from strategy. A remarkable outcome of
the interviews is that we found few differences in having a well-defined
strategy between successful and failed restaurants owners but
considerable differences in clarity
Negl (2002) believed that restaurants are been designed to serve a
basic meal quickly and affordably. Menus are usually limited and
kitchens are designed to produce high volume in short periods. The
customer expects quick service, low price, and consistency. Fast food
establishments are those that serve food for which there is little or no
waiting. From Wade (2006) point of view, the key to the success of quick
service, nevertheless, is its simplicity. A key simplification remains quick
services limited menu. Each item on the menu has been engineered to
simplify and standardize its purchasing, production and service.
34
Pepper et al. (1984) considered that a fast food operation has two
main aims: to please the customer and to make a profit. The giant fast
food chains were built on the belief that four things operating together
will bring them their success, these four things are:-
Limited menu
Fast service
Low price
High sales volume
Brian De Silva (2006) pointed the top tips of WOW success as follows:
 Research market and area.
 Establish budget.
 Brief designer: Make sure choose a good designer.
 Agree concept: What will be famous for?
 Recruit the right team.
 Inspire team and guests.
 Market restaurant: Public relation and collateral, guest and staff
incentives.
 Make changes when need to.
 Listen to staff and guests.
 Remember: you're only as good as your last drink.
2.3.7 Product Branding
Brand concept
According to King and Ronald (2006) image is a popular conception (as of a
person, institution, or nation) project especially through mass media importance of
brand. Martina (1958) defined image as "the way in which a store is
defined in the shopper's mined, partly by its functional qualities and partly
by an aural of psychological attributes. From this, two key elements in the
construction of image can be identified.
o Functional qualities such as the restaurant layout, menu range,
price levels and décor.
o Psychological attributes: The less tangible elements such as feeling
of friendliness or a sense of excitement.
35
Importance of brand
Blackett (2003) told that branding is a binary process. First the name,
logo, pack design, advertising and purchasing environment must create
the promise; and then the product or service concerned has to deliver. If
the brand lives up to expectations then trust been rewarded; if it does not
then the buyer will look elsewhere. So good brand management is all
about managing customer confidence so that he or she can buy without
fear of risk can be a source of strong cash flows
Brand marketing
Walker (2006) believed that brands are defined as unique that identify
a product and set it apart from those of other producers or service
providers. Today, brands are becoming a more and more important part of
a company's marketing strategy, mostly because having a well-known
brand tends to create brand identity. The most important considerations
when developing a brand are these:
 It must be easy to remember.
 Guests need to associate the brand with value.
 It must have a positive connotation.
Name selection and logo
Wade (2006) agreed with Ridgeway and Ridgway (1994) in that the
restaurant name and any subtitle it may use give people an immediate
impression as to the type of restaurant it is. A name must be memorable
and should be easy to pronounce, original, attractive, and easy to
remember and say. A logo is the restaurant's identifying mark that the
public will recognize. In restaurant industry, Mc Donald's has developed
its brand and logo-the golden arches - to be automatically identifiable
worldwide.
36
2.3.8 Product Value
Product value concept
Mattila (2001) mentioned that committed customers place a high
value on a restaurant's social benefits, such as friendship and familiarity,
in addition to good food and a fun atmosphere. Etzel (2004) defined that
value is the ratio of perceived benefits to price and any other incurred
costs. When we say a product has sample value, we do not necessarily
mean it is inexpensive nor has a very low price. Rather, good value
indicates that a particular product has the kinds and amounts of potential
benefits such as quality, image, and purchase convenience consumers
expect at a particular price level.
Foster (1993) believed that value is a customer's satisfaction with a
product in relation to the price. The value of a restaurant meal is a matter
of perception how the customer views the quality of the dining
experience. Johnson and Clark (2005) indicated that value is the
customer's assessment of the benefits of the service weighed against all
the costs involved. It is important to emphasis that the ultimate judge of
value is the customer.
Price value perception
Etzel (2004) reported that a product's price has been affected by
whether it is a new item or an established one. Over the course of a life
cycle, price changes are necessary to keep the product competitive. Wade
(2006) agreed with Negl (2002) in that price / value perception means
consumers believe that they are receiving value for the price that they are
paying, whether the customers are eating in a fast food restaurant or
dining in the finest restaurant in the area. The décor, ambience, and
service standards must all contribute to the customer's perception of the
dining experience.
37
2.3.9 Marketing
Marketing concept
Van Hoof et al. (1996) illustrated that marketing is all of activates
designed to move goods and services from the producer to the consumer.
Walker (2006) said that marketing is attracting guests and establishing a
relationship with the guests that ensure their continuous loyalty. Everyone
from the corporate executive to the line employee should be involved
with marketing.
Reid and Bojanic (2006) stated that:
 Marketing is the process of determining consumer needs, creating a
product service mix that satisfies these needs, and promoting the
product service mix in order to attain the goals and objectives of the
firm.
 Marketing concept is a framework for the marketing philosophy
that consists of three interrelated elements: an organization's basic
purpose is to satisfy customer needs; satisfying customer needs
requires integrated and coordinated efforts throughout the
organization; and organizations should focus on long-term success.
The marketing mix
Powers and Barrows (2006) agreed with Reid and Bojanic (2006) also
in that the marketing mix is conventionally though of as encompassing
the four Ps: product, price, place, and promotion. The researcher agree
with this opinion.
Ronald and Nykiel (2005) added that there are many different
perspectives on marketing and marketing strategy especially in ever-
changing environment. In the 1990s as we transitioned to a predominantly
service-oriented economy and marketing environment, marketing
strategies shifted to focus on the four Cs, as delineated by waterborne:
 Consumer wants and needs
 Cost to satisfy (want and needs)
 Convenience to buy
 Communication (creating a dialogue)
38
In the current decade, while marketing must still focus on the four Ps and
four Cs, marketing strategies appear to have shifted and are now more and
more based on the new five Ps:
 Preparation
 Positioning
 Perception
 Proclamation
 Power thrusts
Market segment
Walker (2006) defined that market segment is a smaller, identifiable
group that can be defined using any set of, such as moose found in
geographic, demographic, or psychographic.
Van Hoof, et al. (1996) indicated that marketers go through a process
called market segmentation and separate people into distinct group based
on their individual characteristics and buying habits.
The target market
Wade (2006) agreed with Negl (2002) in that the target market is the
type of customer who the restaurant is attempting to reach and entice to
frequent the establishment. Writing a menu requires understanding the
customer's wants, needs, and expectations. A customer will judge a
restaurant on several critical areas: food quality and presentation, service,
ambiance, cleanliness, and value. The menu informs customers of the
choices available to them. This is known as menu engineering. The goal
of menu engineering is not to force the customer to purchase an unwanted
item, but rather to place certain items in high visibility locations.
Marketing and selling
Reid and Bojanic (2006) agreed with Medik (1999) in that the
difference between selling and marketing is very simple. Selling focuses
mainly on the firm's desire to sell products for revenue. Marketing is
different from selling because marketing focuses on the needs of
consumers, whereas selling focuses on the needs of the seller. In addition,
39
the marketing concept advances the finical goals that the firm may have.
The concept holds that if the consumer's needs and wants are very
satisfied, then financial success will follow. The researcher agrees with
this opinion.
2.3.10 Promotional Element
Promotion concept
From Etzel (2004) point of view the extent to which the product is
promoted by the producer or intermediaries and the methods used are
added considerations in pricing if major promotional responsibility is
placed on retailers. Walker (2006) said that having an excellent
product at a good price and in the right place is not enough. Sales
goals will not be obtained unless the consumer is aware of the
product's existence. There are several ways of doing this with
promotion. Stutts and Wortman (2006) illustrated that have one
single overriding common purpose: to fulfill a marking need. This
need may be to build trial (new) business, develop a greater share of
existing business, keep businesses, or get repeat business regardless
of the type of promotion the objective is to help the overall
marketing effort.
Promotional mix
Reid and Bojanic (2006) agreed with Reid (1989) in that the
promotional mix elements include advertising, personal selling, sales
promotion, and public relations.
Sales promotion
Schultz et al. (1993) stated that sales promotion: usually short-term
tactical incentives offering something over and above the normal
product offering to encourage customers to act in particular ways.
Product-based sales promotions: sales promotions that centre on some
kind incentive connected with the product: extra product free, or
samples. In addition Reid (1989) agreed with Gottleb (1982) in that
sales promotion is a direct inducement offering an extra incentive to
41
take action. Sales promotions seek to accomplish several broad
objectives and can be used for several reasons:
 To increase consumer awareness
 To introduce new products and services
 To increase guest occupancy and customer counts.
 To combat competition
 To encourage present guests to purchase more.
 To stimulate demand in no peak periods.
2.3.11 Services for Children
Fast food restaurants and children
Spurlock (2005) said that fast food chains make no secret of the fact
that kids are their primary targets. Fast food restaurants are significantly
more likely to be visited by respondents with children than those without.
There is Happy Meal, launched nationally in 1979. It cost a buck in those
days. Inside a cardboard box with a circus theme, kids found a McDonald
stencil, a puzzle book, and a Mc Wrist wallet. The meal-plus-toys
packaging proved to be an instant hit with the first star trek Happy Meals
that very year.
Hahm and Khan (2001) considered that parents with young children
enjoy the conveniences of eating out, and they often take their young
families to quick serve restaurants. They especially like to take their
young families to those restaurants that are equipped with playgrounds or
play areas, and those that offer give – always to their children. From
Spurlock (2005) point of view, parents are their children's primary role
models kids learn their life habits, good and bad, from their parents.
Hahm and Khan (2001) stated that in the future healthy option for to
– go kids meals could include carrot sticks instead of French fires, hand
held yogurt stick such as Yoplait's Go-Curt, and flavored milks in
aseptically packaged containers, these options meet the demand for hand
held to – go food, but also provide a healthy alternative to traditional
quick service restaurant menu items.
41
2.3.12 Atmosphere (Surroundings)
Atmosphere
Briggs (2000) agreed with Pepper et al. (1984) in that atmosphere is
the overall effect created by a restaurant's lighting, color scheme,
furniture, and service. Wade (2006) highlighted that restaurant decor
should support the overall concept and not be a haphazard collection of
props, as the decor helps set the tone for the atmosphere.Wiley and Sons
(2006) declared that a restaurateur who is largely dependent upon
neighborhood business would do well to establish a friendly atmosphere,
maintain consistent standards, and offer good value. A friendly greeting is
the best possible start to a dining experience. People do not require heart,
soul, and internal devotion, just a smile and a cheerful greeting.
Cleanliness
Pepper et al. (1984) stated that customers would stop coming if they
feel a restaurant is not clean. Customers like to eat in clean surroundings.
Constant attention to cleanliness keeps luncheonettes and chain restaurant
dining areas attractive. Wade (2006) agreed with Negl (2002) in that the
incidence of food-borne illness has increased as the food service system
has become more complex and the number of operations has expanded.
One case of food poisoning can seriously injure a restaurant's reputation.
More than one can endanger an operation's survival.
2.3.13 Customer Satisfaction
Customer satisfaction
Johnson and Clark (2005) agreed with Cooper and Lawson (2004)
in that satisfaction is the outcome of the consumer's evaluation of a
service, which sometimes refer to as perceived service quality, and can be
represented on a continue from delight to extreme dissatisfaction.
Lillicrap et al. (2002) pinpointed the factors contributing to the meal
experience were summarized. Factors, which might affect the customer's
42
enjoyment of a specific meal experience in a particular operation, could
be:
 The welcome, the décor, and the ambience.
 Efficiency, has the booking been taken properly, using the
customer's name.
 Location of the table.
 Menu and drinks list (presentation and cleanliness).
 The order is been taken recognition of the host.
 Availability of dishes / items.
 Speed and efficiency of service.
 Quality of food and drink.
 Courteousness of staff.
 Obtrusive / attentiveness of staff.
 Ability to attract the attention of staff.
 Other customer's behaviour.
 Methods in which complaints are handled.
 Methods of presenting bill / recovery payment.
 Departure attentiveness.
Schroeder (2004) told that customer satisfaction is a relative
concept that varies from one customer to another. Also, a customer may
be satisfied with today's products but not satisfied in the future. For
example, while one customer may consider a Ford automobile perfectly
satisfactory, another may not. Seidman and Johnson (2002) argued that
customer satisfaction is regards as the highest mission by the chains.
Johnson and Clark (2005) described that customer satisfaction is
something that can be managed to some extent by influencing customers'
perceptions and expectations of service delivery. This demands in-depth
understanding of this subject. Pepper, et al. (1984) stated that satisfied
customers are return customers, which means good business.
Improving customer service and customer satisfaction
Bateson (1995) mentioned that customer satisfaction is depends on the
production of services as well as their consumption. Field (1999) pointed
out that a common five – step process for developing a customer
satisfaction program is:
43
 Identify the attributes of your product or service that are most
important to customers.
 Measure customer – satisfaction levels on these important
attributes.
 Link satisfactions levels to key customer behavior (use levels,
member retention).
 Identify and implement concrete actions that will improve
customer satisfaction and correspondingly, customer behavior.
 Track results.
Reid and Bojanic (2006) illustrated that improving customer service
should be a top priority of all managers working in the hospitality and
tourism industry. Walker (2006) said that we not only need to keep
guests happy during their stay, but also to keep them returning-with their
friends. It costs several times more to attract new guests than to retain
existing ones.
Employee satisfaction
Easerbrook (2006) agreed with Dube and Renaghan (1999) in
that the best way to drive growth and profit is by looking after the
company's staff. Healthy profit has to start with people, if you get the
people part right, the rest will follow. Gregory and Brieiter (2001) found
that satisfied employees are more likely to exhibit customer-oriented
behavior, which in turn will lead to guest satisfaction. Seidman and
Johnson (2002) agreed with Ghislli et al. (2001) in that job satisfaction
as one key to turnover seems to be a job's characteristics.
44
CHAPTER THREE
MATERIALS AND METHODS
45
Materials and Methods
Research methodology is the treatment that will be applied to the
data collected. This includes the population, instrument, and analysis of
the data.
The aim of this chapter is to assign and define the limits of the
sampling of the study, and to clarify the methods that will be used in
this research in order to collect the desired information and data.
3.1. Materials
3.1.1. Population survey:
The aim of this study is evaluating the experiment of the local
restaurant chains compared to the international ones in Egypt. To
obtain results representing enough the actual conditions. The research
conducted three groups’ four samples from each group. Four samples
from independent fast food restaurants in Sharm El Sheikh, four of the
famous local fast food restaurants chains as well as four international
chains in Sharm El Sheikh.
3.1.2. The Samples:
3.1.2.1. Samples from independent establishments
(Quick Meals, Sharmawy Sharm, El Sheikh, Naama)
3.1.2.2. Samples from local establishments
(Cook Door, Makani, Felfela, Gado)
3.1.2.3. Samples from international establishments (McDonald's,
46
Burger King, Hardee's, KFC)
Table 3: Samples from the establishments
Old Sharm Hadaba Marina
Samples from independent establishments
Quick Meals 1 - -
Sharmawy Sharm 1 1 -
El Sheikh 2 - -
Naama 1 - -
Samples from local establishments
Cook Door - 1 *
Makani - 1 1
Felfela 1 - -
Gado - 1 1
Samples from international establishments
McDonald's - 1 2
Burger King - 1 -
Hardee's - 1 1
KFC - 1 1
* Mean under preparation
47
According Menu Specialty of the selected QSR:
Table 4: Menu specialty of the selected QSR.
Restaurant
Burger
Pizza
Chicken
Snacks
Sandwich
Foul&
Falafel
Seafood
Independent restaurants
Quick Meals * - * * ** * *
Sharmawy
Sharm
* - * * ** - -
El Sheikh - - * * ** ** -
Naama * - * * ** ** -
Local restaurant chains
Cook Door * - * * ** - -
Makani - * * * ** - -
Felfela * - * * ** * *
Gado * - * * ** * *
International restaurant chains
McDonald's ** - * * ** - -
Burger King ** - * * ** - -
Hardee's ** - * * ** - -
KFC * - ** * * - -
- Not serving * Serving ** The core product
Walker (2006) agreed with Brymer (1995) in that classifying.
48
3.2. Methods
The collected data has been divided into primary sources and
secondary sources. Every type of this data will be illustrated and
discussed in some details.
3.2.1. Primary Data
Primary sources have been collected through the following
methods:
3.2.1.1. Guest Questionnaire
The guest questionnaire was designed and distributed at a sample of
fast food guests. This questionnaire form has been developed based
upon the relevant review of literature. The main purpose of this
questionnaire is to know
 How much does the guest like the fast food and at which meal
he prefers.
 The most important factor in a fast food restaurant which
attracts the guest to select fast food chains.
 Evaluation the local fast food restaurant chains experiment
compared to the international chains.
 The advantages and disadvantages in local fast food chains in
Egypt.
 Any problem has the guest ever met through his experiment
with the local fast food restaurant chains?
Questionnaire form distribution took nearly one year, starting at
15/9/2006 up till 1/8/2007. The questionnaire form was written and
distributed in Arabic and English languages. The questionnaire form
been shown in Appendix (A1).
49
3.2.1.2. In-depth Personal Interviews
In- depth interviews were been carried out with the restaurants
and chains managers under the investigation. The purposes of these
interviews were:-
 Identifying the guest evaluation for the fast food chains.
 Egyptian market expectations, needs, and preferences of the
Egyptian customer. And how do the chains deal with these needs
and preferences?
 Common attributes of local and international restaurant chains.
 Training strategy in fast food ones.
 Evaluating marketing strategies in fast food chains.
 Evaluating quality levels in fast food chains, and what is quality
assurance strategy in fast food chains.
 The extent of product development according to customer needs
in their chains.
 Customer satisfaction measuring methods in fast food chains.
 Strengths and weakness points in fast food chains.
The in-depth personal interview are been shown in appendix (A2).
3.2.1.3. Observation Checklist
The observation checklist has been designed to evaluate food
service quality, cleanliness, atmosphere, staff and management
performance. The checklist composed of six functional areas, which
are:
1- Exterior
2- Interior
3- Food Quality
4- Guest Service
5- Employee Appearance
6-Managament Functions
51
The observation checklist has been shown in Appendix (A3).
3.2.2. Secondary sources
All sources of secondary data been illustrated in the previous
chapter "Review of Literature".
The sources of secondary data include:
3.2.2.1. Government Publications
This source includes the data mentioned by the Egyptian
Ministry of Tourism and the Chamber of Tourism Establishments
(CTE).
3.2.2.2. Periodicals and Books
Books, theses, as well as periodicals such as, journal of food
service business research™, Cornell quarterly, restaurant hospitality,
and caterer and hotelkeeper and different articles from many sources.
1.2.2.3. Electronic Sources
Internet websites related to the subject of research have been
mentioned, illustrated and discussed.
3.2.3. Pilot study
The thesis shows a research questionnaire and an interview
which entailed three separate interviews with lecturer's and assistant
lecturers from Helwan University, Faculty of Tourism and Hotel
Management, Also entailed by McDonald's training consultancy team
and their training managers, Americana Company, Gulf Aria human
resource corporate manager, Cilantro, quality assurance managers and
Cinnabon training manager. This helped towards shaping the final
questionnaire and interviews.
The pilot study of questionnaire has been conducted on a limited
51
segment of guests from independent restaurants, local and international
fast food restaurant chains. The questionnaire form has been revised
and adopted according to the guest’s comments.
1.2.3. Data Analysis
Most data were then analyzed utilizing procedures of the SPSS
(Statistical Package for Social Science) version 10.0 for windows.
Frequencies standard deviation, percentages and cross-tabulation were
calculated to determine which group differs significantly from each
other and correlation between variables.
52
CHAPTER FOUR
RESULTS AND DISCUSSION
53
4.1 Introduction
The business of food service deals with the preparation and
service of food for consumption by others, whether the food is made
from scratch or is convenience food products that are finished in
microwave or deep fryer, whether the service is over the counter or at
the table.
Food service is "the service of food and beverages to internal
and external guests in an efficient, safe and hygienic manner, and in a
way that will create guest satisfaction"
Food service may be defined as "that phase the food flow (that
is, from the purchasing of the foods to service to the guest) mainly
concerned with the delivery and presentation of the food to the guest,
after the completion of the food production". In some situations food
service may include an element of transportation due to the separation
of the service facilities from the food production, for example of a
centralized cook-freeze operation serving peripheral units.
Food service establishments are those engaged in providing food
service. These establishments include not only the obvious examples of
restaurants and college dining halls but also the salad bars and
sandwich counters in food markets and such" distant relations" as food
vending machines. Food service enterprises range from full-service
restaurants to self-service buffets, from fine restaurants to takeout
operations, and from company cafeterias to hamburger stands.
Quick service or fast food restaurant offer limited menus
featuring food such as hamburgers, fries, hot dogs, various finger foods
and other items for the convenience of people on to the go. Customers
order their food at a counter under a brightly lit menu featuring color
photographs of food items. Quick-service restaurants have increased in
popularity because of their locations. They can usually be found in
very convenient places in every possible area. Their menus are limited,
which makes it easier for customers to make quick decisions on what
54
to eat.
4.2 Questionnaire Response Rate
The research targeted 1500 customers randomly in fast food
operations. A total of 1248 usable replies were obtained, representing
an effective response rate of 83.2 percent.
Table 5: Questionnaire response rate
Category Customers
Number targeted 1500
Number shared 1248
Response rate 83.2 %
4.3 Questionnaire Analysis Results and Discussion
The next evaluation of the questions is ranking according to the
objectives of the questionnaire as follows.
55
Question NO. (1):- Customers’ preferences to deal with fast food
restaurants
The aim of this question is to illustrate customers’ preferences to
deal with fast food restaurants. Figure (1) shows this issue and
illustrated that out of 1248 respondents who dealing with fast food
restaurants; 16.3% of respondents deal with fast food restaurants
always, 24.1% are usually preferred to deal with fast food restaurants
usually. 45.2% of customers deal with fast food restaurants sometimes.
While 14.4% of respondents indicated that they deal with fast food
restaurants rarely.
16.3%
24.1%
45.2%
14.4%
0.0
10.0
20.0
30.0
40.0
50.0
AlwaysUsuallySometimesFew
Figure 1: Customers preferences to eat fast foods.
Cross tabulation analysis showed that 52.4% of category "from 15 to
less than 25 years old" customers and 45.3% of category "from 25 to
40 years old " deal sometimes with fast food restaurants, while 33.3%
of category "over 40 years old" respondents rarely deal with fast food
restaurants. Also 44.4% of married with children customers and 47.4%
of single respondents deal with fast food restaurants sometimes,
besides 50% of female respondents and 43.1% of male respondents
deal with fast food restaurants.
56
Question NO. (2):- Customers' preferable meal
The aim of this question is to illustrate customers' preferable
meal. Data in table 6 show that most respondents prefer to have the
lunch meal in fast food restaurants by mean 1.77. Statistically,
X2
sig=0,000 showed a significant variances among respondent as (P<,
05) Finn et al. (2000). Breakfast meal came in the second position by
mean 2.22 and std. deviation .94, while dinner was the least preferable
meal to most of customers.
Table 6: Customers' preferable meal
Meal Mean Std. Error
Std.
Deviation
Lunch 1.77 0.02 .80
Breakfast 2.22 0.03 .94
Dinner 2.29 0.02 .77
Cross tabulation analysis indicated that 37.5% of male respondents,
42.1% of single respondents and 37% of Egyptian customers indicated
that breakfast was the most preferable meal to eat in QSRs. while
48.6% of male customers, 50% of married without children
respondents and 52.2% of foreigner customers ensured that lunch was
the most preferable meal. Finally, 31.3 of female customers, 25% of
married without children respondents and 22.2% of Egyptian
respondents enjoyed eating dinner in QSRs.
57
Question NO. (3):- Customers' restaurants preferences
The aim of this question is to illustrate customers' restaurants
preferences. From the tabulated data in table (7), it could be noticed
that local chain restaurants were the first category, which attracted
most of customers by a mean of 1.87, and a std. deviation of .72.
International chain restaurants came in the second position by a mean
of 1.95 and a std. deviation of .92. The mean 2.32 highlighted that
independent restaurants took the third place in the customers'
restaurants preferences.
Table 7: Statistics of customers' restaurants preferences
Restaurant
Mean Std.
Error
Std.
Deviation
Local chain restaurants 1.87 0.02 .72
International chain restaurants 1.95 0.03 .92
Independent restaurants 2.32 0.02 .84
Cross tabulation analysis indicated that 31.3% of female respondents,
25.9% of married with children respondents and 27.2% of Egyptian
customers indicated that independent restaurants was the most
preferable restaurants. In the other hand, 37.5% of male customers,
37% of married with children respondents and 35.8% of Egyptian
customers ensured that local chain restaurants were the most preferable
QSRs. Finally, 46.9 of female customers, 50% of married without
children respondents and 65.2% of foreigner respondents enjoyed
eating in international chain restaurants.
Question NO. (4):- Customers reasons for restaurant type
preference
The aim of this question is to illustrate customers' reasons for
restaurant type preference. From Figure (3), it could be noticed that
37% of respondents prefer international chain restaurants for the
following reasons:
58
 Safe
 Trust
 Cleanliness
 Good promotions
 Brand name
 New product
 Food quality
 Consistence standard
 Good location in every where
 Good quality
 Fast service
 Atmosphere
 Good price
Besides, 38% of customers highlighted that they prefer local chain
restaurants for the following reasons:
Egyptian investment
Know the source
Egyptian traditional taste
Trust
Halal
Quality
Good service
Good value
Good price
Safe
Atmosphere
Brand name
Menu variety
Only 25% of customers were satisfied with the independent
restaurants' food for the following reasons:
 Good price
 Fair value
 Egyptian taste
 Delicious
 Halal
59
 Fresh food
 Friendly service
 Good quality
 Atmosphere
25%
38%37%
0
10
20
30
40
Independent
resturants
Local chains
resturants
International
chain resturants
Figure 2: Customers' reasons for restaurants type preferences
This agreed Lan, and Khan (1995) with see page 10.
Question NO. (5):- Important factors in QSR that attract customer
The aim of this question is to show important factors in QSR that attract
customer. Data in Table (8) showed statistics (means, standard deviations, standard
error) of important factors in QSR that attract customer.
Table 8: Statistics of important factors in QSR that attract customer
Important factors
Mean Std.
Error
Std.
Deviation
X2
signification
Food quality 4.40 0.03 .95 0.00
price 4.11 0.03 .95 0.00
Service quality 3.90 0.03 1.01 0.00
Consistence
Standard
3.60 0.03 1.13 0.00
Atmosphere 3.48 0.04 1.25 0.00
Brand name 3.30 0.04 1.31 0.01
Menu variety 3.17 0.03 1.11 0.00
Location 3.11 0.03 1.00 0.00
Promotional 2.71 0.04 1.29 0.00
61
activities
Results indicated that the variables food quality, price and service
quality were the first three important factors in QSRs that attract
customers by means of 4.40, 4.11 and 3.90, respectively. Consistence
standard, atmosphere and brand name came in the second position by
means of 3.60, 3.48 and 3.30, respectively. The means of 3.17 and 3.11
highlighted that menu variety and location respectively took the third
place in the customers' restaurant preference, while promotional
activities were the last factor by a mean of 2.71 to choose restaurant.
Statistically X2
sig=0,000 showed a significant variation among
respondent as (P<, 05). This agreed with Ball (1992).see page 7.
However, the X2sig=0,000 for the other factors indicated that
there was a significant variation among respondents (P<, X2sig, 05) as
follow:
2.9%
3.8%
26.9%
32.7%33.7%
4.8%
11.5%
28.8%
28.8%
26.%
8.7%
11.5%
30.8%
21.2%
27.9%
0.0
5.0
10.0
15.0
20.0
25.0
30.0
35.0
40.0
1 =Least
im portant
Low im portantIm portantHigh im portant5 =Most
im portant
Service quality Consistence Standard Atmosphere
Figure 3: Important factors in QSR that attract customer (service
Quality, consistence standard and atmosphere)
Figure 3 shows that 93.3% (Important, High important & most
important) of the respondents ranked service quality as an important
factor in QSR that attracts customers, 83.6% of them gave the same
rank to consistence standard variable and 79.9% (Important, High
important & most important) of customers indicated the above ranks to
atmosphere variable, while, only 6.7, 16.3 and 20.2% (Low important
& least important) of respondents ranked service quality, consistence
61
standard and atmosphere, respectively, as the lowest important factors.
Agreed with Noel and Cullen (1996), see, p.14.
Figure 4: Important factors in QSR that attract customer
(Brand name and menu variety)
Figure 4 highlighted that 74% (important, High important& most
important) of respondents indicated that brand name is an important
factor to chose a restaurant. 71.2% of them gave the same rank to menu
variety variable, While 26% and 28.9% (Low and Least important) of
respondents ranked brand name and menu variety respectively as the
lowest important factors.
4.8%
22.1%
39.4%
25%
8.7%
25%
16.3%
31.7%
16.3%
10.6%
0.0
5.0
10.0
15.0
20.0
25.0
30.0
35.0
40.0
45.0
Least
important
Low
important
ImportantHigh
important
Most
important
Location Promotional activities
Figure 5: Important factors in QSR that attract customer
(Location and promotional activities)
Figure 5 illustrates that 73.1% (Important, high important &
most important) of the respondents indicated that the location is an
important factor to choose a restaurant. While, 58.6% of them gave the
22.1%
14.4%
25%23.1%
26.9%
33.7%
12.5%
23.1%
13.5%
5.8%
0.0
5.0
10.0
15.0
20.0
25.0
30.0
35.0
Least
important
Low
important
ImportantHigh
important
Most
important
Brand name Menu variety
62
same rank to promotional activities variable, 26.9, and 41.3% (Low
and least important) of the respondents are ranked the location and
promotional activities, respectively, as the lowest important factors.
Question NO. (6):- Restaurant important categories factors'
evaluation
The aim of this question is to illustrate Restaurant categories
factors' evaluation. From the table (9) it could be showed statistics of
different restaurant categories in the study.
Table 9: Statistics for restaurants factors' evaluation
Independent Local chain
International
chain
Important
factors
Mean Std.
Deviatio
n
Mean Std.
Deviati
on
Mean Std.
Deviat
ion
Brand name 2.32 1.30 3.63 0.93 4.19 1.09
Location 2.63 1.33 3.55 0.97 4.07 1.07
Price 3.91 1.33 3.73 1.06 3.37 1.37
Food quality 2.93 1.38 3.87 1.07 4.22 0.94
Service quality 2.68 1.27 3.56 0.97 3.95 1.03
Consistence
Standard 2.48 1.28 3.51 0.97 4.03 1.01
Menu variety 2.85 1.38 3.25 0.99 3.65 1.25
Atmosphere 2.27 1.18 3.12 1.04 3.80 1.16
Promotional
activities 1.57 1.00 2.85 1.03 3.78 1.30
All factors
statistics 2.63 0.28 3.5 0.09 3.89 0.34
Results proposed that the respondents evaluated all factors in
independent restaurants as neutral factors by a grand mean of 2.63,
while they evaluated the same factor in local chain restaurants and
international chain restaurants as high level factors by a grand means
3.5 & 3.89, respectively (see table 9).
63
From the tabulated data in Table (10) it could be illustrated
customers' ranking of preferable factors for different restaurant
categories according to their means.
Table 10: Restaurant categories factors' ranking
According to their means
Independent
factors
Mean
Local chain
factors
Mean
International
chain
factors
Mean
Price 3.91 Food quality 3.87 Food quality 4.22
Food quality 2.93 Price 3.73 Brand name 4.19
Menu variety 2.85 Brand name 3.63 Location 4.07
Service quality 2.68
Service
quality
3.56
Consistence
standard
4.03
Location 2.63 Location 3.55
Service
quality
3.95
Consistence
standard
2.5
Consistence
standard
3.51 Atmosphere 3.80
Brand name 2.32 Menu variety 3.25
Promotional
activities
3.78
Atmosphere 2.27 Atmosphere 3.12 Menu variety 3.65
Promotional
activities
1.57
Promotional
activities
2.85 Price 3.37
Results highlighted that price was the first preferable factor by
the respondents for independent restaurants and they ranked it as a high
level factor. Food quality, menu variety, service quality, location and
consistence standard were respectively the second preferable factors by
respondents in the independent restaurants, where customers ranked
them as neutral factors by means ranged from 2.5 to 2.93. Brand name,
atmosphere and promotional activities were the lowest level factors
indicated by the respondents for independents restaurants.
However the customers evaluated food quality, price, brand
name, service quality, and location and consistence standard
respectively, as high level factors to choose a local chain restaurant,
while they ranked menu variety, atmosphere and promotional activities
at the last position respectively, as neutral factors to eat in local chain
restaurants.
64
Finally, the respondents evaluated the most attractive factors in
international chain restaurants as follows; food quality, brand name,
location, consistence standard, service quality, atmosphere,
promotional activities and menu variety respectively. Price was the last
factor mentioned by customers; where they ranked it as a neutral
factor.
X2
sig=0,00 illustrated that there is a significant variation
between respondents' evaluation for restaurant categories' factors
according to (P<,05) as follows:
65
Brand name
From the Figure 6, it could be noticed that international chain
restaurants took the highest level among restaurant categories with that
factor by 79.8% (Highest level & high level) of respondents. While
local restaurant chains are in the second position by 54.8% (Highest
level & high level) of them. Only 21.2% (Highest level & high level)
of customers ranked brand name factor in independent restaurants as
high-level factor. In the other side, 59.6% (Low level & lowest level)
of respondents mentioned that independent restaurants had unknown
brand name
37.5%
7.7%
13.5%
19.2%
22.1%
1.9%
19.2%
35.6% 36.5%
6.7%
4.8%
52.9%
26.9%
11.5%
3.8%
0.0
10.0
20.0
30.0
40.0
50.0
60.0
Lowest levelLow levelNeutralHigh levelHighest level
Independent Local chains International chains
Figure 6: Brand name factor's evaluation in QSRs.
See Brand concept According to King and Ronald (2006), p.21.
From the researcher point of view brand name is very important to
built and to keep it.
66
Location
Figure 7 shows customers' evaluation of locations for different
restaurant categories.
27.9%
18.3%
27.9%
14.4%
11.5%
3.8%
6.7%
36.5%36.5%
16.3%
2.9%4.8%
22.1%23.1%
47.1%
0.0
5.0
10.0
15.0
20.0
25.0
30.0
35.0
40.0
45.0
50.0
Lowest levelLow levelNeutalHigh levelHighest level
Independent Local chains International chains'
Figure 7: Location factor's evaluation in QSRs.
Results illustrated that 70.2% (Highest level & high level) of
customers indicated that international chain restaurants had the most
attractive locations. While the local chain restaurants took the second
position by 52.8% (Highest level & high level) of them. Only 25.9%
(Highest level & high level) of the respondents evaluated independent
restaurants' locations as good places. In the other hand, 46.2% (Low
level & lowest level) of customers unaccepted independent restaurants'
locations. This agreed with Ridgeway and Ridgeway (1994). See page,
15.
67
9.6%
6.7%
15.4%
19.2%
49%
2.9%
9.6%
26.9%
32.7%27.9%
11.5%
16.3%
27.9%
12.5%
31.7%
0.0
10.0
20.0
30.0
40.0
50.0
60.0
Lowest levelLow levelNeutalHigh levelHighest level
Independent Local chains International chains
Price
From the figure 8 it could indicate customers' evaluation of price
factor for different restaurant categories.
Figure 8: Price factor's evaluation in QSRs.
Results indicated that price was the most effective factor in
independent restaurants; 68.2% (Highest level & high level) of the
respondent proposed that the price in independent restaurant was
reasonable. 60.6% (Highest level & high level) of the customers
mentioned that local chain restaurants provide a logical price.
International chain restaurants were in the third position by 44.2%
(Highest level & high level) of the respondents expected that they
provide rational price. The researcher agreed that the price has a
tremendous impact on the success or failure of a product. Etzel (2004).
See page 16.
68
Food quality
Figure 9 shows customers' evaluation of food quality factor for
different restaurant categories.
Figure 9: Food quality factor's evaluation in QSRs.
Results illustrated that, 77.9% (Highest level & high level) of the
customers indicated that international chain restaurants had the
maximum food quality level. While the local chain restaurants took the
second position by 69.2% (Highest level & high level) of them.
Besides, 37.5% (Highest level & high level) of respondents evaluated
independent restaurants' food quality as a top level. In the other hand,
38.4% (Low level & lowest level) of customers disagreed with
independent restaurants' food quality level.
The researcher agree with that keeping consistency of food quality
is a though task for all service restaurant in QSR chains Seidman and
Johnson (2002). See page 13.
22.1%
16.3%
24.1%
21.2%
16.3%
4.8%4.8%
21.2%
37.5%
31.7%
1.9%1.9%
18.3%
27.9%
50%
0.0
10.0
20.0
30.0
40.0
50.0
60.0
Lowest levelLow levelNeutalHigh levelHighest level
Independent Local chains International chains
69
Service quality
Figure 10 shows customers' evaluation of service quality factor
for different restaurant categories.
Figure 10: Service quality factor's evaluation in QSRs.
Results highlighted that, service quality was the most effective
factor in international chain restaurants by 64.4% (Highest level & high
level) of customers, While 50% (Highest level & high level) of the
respondents were satisfied with service quality in local chain
restaurants. Besides, 28.9% (Highest level & high level) of customers
agreed with service quality in independent restaurants. In the other
side, 45.2% (Low level & lowest level) of the respondents were
unsatisfied with the level of service quality offered in independent
restaurants. Service is an intangible product that sold or purchased in the
marketplace. Reid and Bojanic (2006). See page 14
24%
21.2%
26%
20.2%
8.7%
3.8%4.8%
41.3%
31.7%
18.3%
2.9%2.9%
29.8%
25%
39.4%
0
5
10
15
20
25
30
35
40
45
Lowest levelLow levelNeutalHigh levelHighest level
Independent Local chains International chains
71
Consistence standard
Figure 11 shows customers' evaluation of consistence standard
factor for different restaurant categories.
Figure 11: Consistence standard factor's evaluation in QSRs.
Results illustrated that, 71.1% (Highest level & high level) of the
customers ensured that international chain restaurants had a
consistence standard level for their products and services, 49% and
16.3% (Highest level & high level) of them claimed the same result for
local chain restaurants and independent restaurants respectively. But,
50% (Low level & lowest level) of the customers mentioned that
independent restaurants had no consistence standard level.
Zero defects is the standard that service organizations must set this
very high standard. Noel and Cullen (1996). See page 14.
29.8%
20.2%
33.7%
4.8%
11.5%
1.9%
11.5%
37.5%
31.7%
17.3%
1.9%5.8%
21.2%
29.8%
41.3%
0.0
5.0
10.0
15.0
20.0
25.0
30.0
35.0
40.0
45.0
Lowest levelLow levelNeutalHigh levelHighest level
Independent Local chains International chains
71
Menu variety
Figure 12 shows customers' evaluation of menu variety factor for
different restaurant categories.
Figure 12: Menu variety factor's evaluation in QSRs.
Results indicated that, 51% (Highest level & high level) of the
customers claimed that international chain restaurants provide a variety
of choices in their menu, and 35.6 and 35.6% (Highest level & high
level) of them ensured the same results for local chain restaurants and
independent ones, respectively. But, 38.5 and 22.1% (Low level &
lowest level) of the customers were disagreed with the above result for
independent restaurants and local chain ones, respectively.
Walker (2006) highlighted that quick-service restaurant menus
are limited, which makes it easy for customers to make quick decisions
on what to purchase. While the researcher agree with Ball (1992) in
that QSRs may be provided in product range offered or by variations in
one basic product (dressings, fillings, supplements). See page 5, 7.
26%
12.5%
26%
22.1%
13.5%
1.9%
20.2%
42.3%
22.1%
13.5%
5.8%
11.5%
31.7%
13.5%
37.5%
0
5
10
15
20
25
30
35
40
45
Lowest levelLow levelNeutalHigh levelHighest level
Independent Local chains International chains
72
Atmosphere
Figure 13 indicates that, 62.5% (Highest level & high level) of
the customers claimed that international chain restaurants had the most
attractive atmosphere, as 37.5 and 14.4% (Highest level & high level)
of them ensured the same results for local restaurant chains and
independent restaurants, respectively. On the other side, 53.8%, 28.9
and 13.5 (Low level & lowest level) of respondents were disagreed
with the above results for independent restaurants, local restaurant
chains and international restaurant chains, respectively.
Figure 13: Atmosphere factor's evaluation in QSRs.
The researcher agreed with Wiley and Sons (2006). that a friendly
atmosphere, maintain consistent standards, and offer good value. A
friendly greeting is the best possible start to a dining experience. See page
28.
37.5%
16.3%
31.7%
10.6%
3.8% 5.8%
23.1%
33.7%
28.8%
8.7%
4.8%
8.7%
24%
26.9%
35.6%
0.0
5.0
10.0
15.0
20.0
25.0
30.0
35.0
40.0
Lowest levelLow levelNeutalHigh levelHighest level
Independent Local chains International chains
73
Promotional activities
Figure 14 showed customers' evaluation of promotional
activities factor for different restaurant categories.
Figure 14: Promotional activities factor's evaluation in QSRs.
Results indicated that, 66.4% (Highest level & high level) of the
customers claimed that international chain restaurants had the most
attractive promotional activities, as 23 and 4.8% (Highest level & high
level) of them ensured the same result for local restaurant chains and
independent restaurants respectively. On the other hand, 80.8, 35.6 and
16.4 % (Low level & lowest level) of the respondents were disagreed
with the above results for independent restaurants, local chain
restaurants and international chain restaurants, respectively. The
researcher agrees with that having an excellent product at a good
price and in the right place is not enough. Sales goals will not be
obtained unless the consumer is aware of the product's existence.
There are several ways of doing this with promotion.Walker
(2006).see page 26.
70.2%
10.6%
14.4%
1.9%2.9%
9.6%
26%
41.3%
16.3%
6.7% 10.6%5.8%
17.3%
27.9%
38.5%
0.0
10.0
20.0
30.0
40.0
50.0
60.0
70.0
80.0
Lowest levelLow levelNeutalHigh levelHighest level
Independent Local chains International chains
74
Question NO. (7):- Customers' evaluation for the experiment of
local fast food restaurant chains.
The aim of this question is to illustrate customers' evaluation for
the experiment of local fast food restaurant chains. The mean of 1.4
and standard deviation of 0.49 proposed that the most of respondents
found the experiment of local fast food restaurants as successful.
Figure 15: Customers' evaluation for the experiment of Egyptian
QSRs.
Figure 15 shows that 59.6% of the customers indicated that the
experiment of local fast food restaurants is successful, while 40.4% of
them mentioned that the experiment is acceptable.
The researcher agrees with that the experiment of local fast food
restaurant chains is successful.
59.6%
40.4%
0
10
20
30
40
50
60
SuccessfulAcceptable
75
Question NO. (8):- Advantages and disadvantages of local fast food
restaurant chains.
The aim of this question is to illustrate customers' evaluation for
the advantages and disadvantages of local fast food restaurant chains.
Results highlighted that 21.2% of the respondents had no experience to
know the advantages and disadvantages of local fast food restaurant
chains. While, 78.8% of customers had enough experience to indicate
the advantages and disadvantages of local fast food restaurant chains as
follows:
A- Advantages:
 Egyptian investment
 Know the source
 Egyptian taste
 Trust
 Halal
 Quality
 Good service
 Good value
 Good price
 Save
 Atmosphere
 Brand name
 Menu variety
 Specialist
 Suitable for youth
B- Disadvantages:
 Few promotional activities.
 Not very strong marketing
 Doesn’t have a very strong brand name.
 Low level of consistence standard
 Not very well atmosphere.
 Few outlets, limited locations
 Service time is not always fast
76
 Price not reasonable for many segments in the society
 Nutritional facts aren’t shown for the guest.
 Not serve soups, or fruits.
 Need more care of kids
 Need more attention for the languages level (English, Russian, and
Italian).
 Need to offer more services for the guest such as Wi – Fi, art
channels, and visa card payment.
 Need to have hot line.
77
Question NO. (9):- Customers' problems with local fast food
restaurant chains.
The aim of this question is to illustrate customers' problems with
local fast food restaurant chains. As Figure 16 presents this issue and
illustrates that 48% of the respondents had no problems with Egyptian
fast food restaurant chains.
Yes
52%
No
48%
Figure 16: Customers' problems with Egyptian QSRs.
However, 52% of customers had real problems during their
experience with local fast food restaurant chains; and these problems
include:
 Late ordered.
 Cold food.
 Long service time.
 Low service level.
 Wrong order.
 Some items in the menu but not available.
 Their no enough care about special order.
 Low level of cleanliness.
 No consistence standard.
 There is no kids’ corner.
 There is not a non-smoking corner.
 There is not a family corner.
 Chairs aren’t comfortable.
 Tables aren’t stabilized.
78
 Need more attention for the languages level (English, Russian,
and Italian).
 Nutritional facts aren’t shown for the guest.
 More care about nutrition value should be taken.
 Need more variety in soups, salads, and fresh fruits fresh
vegetables, cereals, and other group products.
 Need more variety for the kid's fun box and toys for the children
meals.
 The price of the meal should be related according to perceived
value for money and be in line with customer's expectations.
 Home delivery need to be covering most the distances, Single-
telephone-number systems in delivery firms use computerized
guest histories to facilitate order taking, could make the order
through the internet.
 Need more care about carhop, drive in, and drive through
services.
 Credit card payment should be acceptable, and credit card
machine should be available.
 New product should be frequency every limited period.
 Creating a web site, hot line or other advertisement that makes
the users meeting with your product or service memorable, fun
or useful.
 Need enough area for the youth (comfortable chairs, ART
channels, Wi- Fi wireless connection with the Internet.
 More care for the kids (kid's meals, kid's gifts, kid's birthdays,
kid's area, and kids in the school.
79
Question NO. (10):- Customers' suggestions and
recommendations.
The main aim of this question is to guess customers' suggestions
and recommendations. Results highlighted that, 24% of the
respondents had no experience to propose suggestions and
recommendations. In the other side, 76% of the customers had enough
experience to indicate some suggestions and recommendations include
the following:
 Should have corporation for the restaurant staff avoid
individualism.
 More attention for staff selecting.
 Listen to your staff and your guests and chair them.
 More attention for the languages level (English, Russian, Italian).
 Need more awareness of personnel hygiene and sanitation.
 Staff should be aware of the standard importance.
 Make changes when you need to.
 Marketing research study and customer needs analysis should be
frequency.
 Chains should be aware of market new trends.
 The effective use for the Internet through survey, or questionnaire
for the guest through the Internet.
 A name must be memorable and should be easy to pronounce.
 A logo is the restaurant's identifying mark that the public will
recognize.
 The price of the meal should be related according to perceived value
for money and be in line with customer's expectations.
 Nutritional facts should be shown for the guest chain should
include nutritional information on the packaging of all of its
products.
 Fresh juices, decaffeinated, water or low fat milk making good
choices when the guest are eating out will help the guest maintain a
healthy diet care about nutrition value should be taken.
 More variety in soups, salads, and fresh fruits, fresh vegetables,
cereals, and other group products.
 Special meals for diabetic, heart problems, high blood, sports,
healthy food items.
81
 More care for the kids (kid's meals, kid's gifts, kid's birthdays,
kid's area, and kids in the school.
 Soda is highly caloric and not nutritious – kids should have water or
milk instead.
 Avoid chicken nuggets – fried nuggets are sorry imposters of very
chicken
 Skip the fries - consider taking along a bag of mini carrots, grapes
or other fruits and vegetables to have instead. This will add vitamins
and fiber to the meal.
 Order the kids meal with some substitutions.
 In sit-down restaurants, help them for chicken and vegetables rather
than a big plate of macaroni and cheese.
 Chain should not try to find more customers for its products, but
to find more products for its customers.
 Home delivery need to be covering all the distances, single-
telephone-number systems in delivery firms use computerized
guest histories to facilitate order taking, could make the order
through the internet.
 Development of, drive in, and drive through services.
 Credit cards are convenient to the guest, credit card payment
should be acceptable, and credit card machine should be
available.
 New product should be frequency every limited period.
 Creating a web site, hot line or other advertisement that makes
the users meeting with your product or service memorable, fun or
useful.
 Need enough area for the youth (comfortable chairs, ART
channels, Wi- Fi wireless connection with the Internet.
 More care about catering for banks, schools, factories.
 Customer feedback is vital to improve product quality.
 Value is a big lure.
 Chains have to reach the customer in a way that is compatible
with their beliefs, language, needs and expectations.
 To be flexible with the changing times, chains have to be flexible
with the needs of the guest.
 Aligning your customer service with your brand is the best way
81
to build a solid relationship.
 More and more sales are taking place in trade outlets such as
forecourt shops and convenience stores.
 Dealing well with problems and queries.
 Providing a personal touch.
 Customers expect fast foods to be served quickly.
 Mention portion control, plate design.
Personal data analysis.-Question NO. (11):
Table 11: Personal data analysis.
Variables Categories Percent
Gender
Male
Female
69.2%
30.8%
Level of age
Less than 25 years
From 25 to 40
More than 40
40.3%
51%
8.7%
Martial status
Single
Married without children
Married with children
54.8%
19.2%
26%
Nationality
Egyptian
Foreigner
77.9%
22.1%
82
4.4 Interview Response Rate
Out of 42 fast food restaurants' managers in Sharm El Sheikh
(study population), 36 of them accepted to make interview with the
researcher and they appear greet cooperation with the researcher, only
8 persons apologized to make interview with the researcher saying that
they are not ready to deal with the researcher as they are too busy.
Table 12: Interview's response rate
Category Independent
Local
chains
International
chains
Total
Number targeted 12 16 16 44
Number shared 9 15 12 36
Response rate 75 % 93.8 % 75 % 81.8 %
4.5 Interview Analysis Results and Discussion
The next analysis of the questions is ranking according to the
objectives of the interview as follows.
83
Question NO. (1):- Managers evaluation for QSRs in Egypt
The main aim of this question is to illustrate managers’
evaluation for QSRs in Egypt. Figure 17 helps this aim and highlights
that 88.9% of managers accepted the fast food chains in Egypt as a
successful experiment, while; only 11.1% of the respondents indicated
that it was acceptable.
11.1%
88.9%
0.0
20.0
40.0
60.0
80.0
100.0
SuccessfulAcceptable
Figure 17: Managers evaluation for QSRs in Egypt.
Restaurant managers proposed the following reasons for that
success:
 Operations provide fast service with good quality.
 Good meals with cheap prices
 Very famous, very clean and trust.
 Customers can find it in every place and it's easy to deal with.
 The man and woman are working and there is no time for cooking.
84
38.9%
61.1%
33.3%36.1%38.9%
0.0
10.0
20.0
30.0
40.0
50.0
60.0
70.0
Healthy and
good meal
Good and fast
service
Good qualityCheap prices
and fair value
Others
Question NO. (2):- Egyptian market expectations about fast food
concept.
The main aim of this question is to guess the Egyptian market
expectations about fast food concept. Data in Figure 18 showed
restaurant managers' viewpoint about the expectations of Egyptian
market about fast food concept.
Figure 18: Egyptian market expectations about fast food concept.
Results indicated that, 38.9% of managers mentioned that
customers expect a healthy and good meal, 61.1% of them proposed
that customers want good and fast service, good quality is a
prerequisite for customers as listed by 33.3% of managers, and 36.1%
of the respondents claimed that cheap prices and fair value is the
essential prerequisite for customers. Finally, 38.9% of the managers
highlighted other reasons include the followings:
 Continuous development for the operations.
 Good style and decorations.
 Good promotion.
 Meeting customers demanded.
 The market accepts more fast food operations.
85
Question NO. (3):- Egyptian customers' needs and preference
The main aim of this question is to guess the managers opinion
about the Egyptian customers' needs and preference. The data in figure
19 helped that aim and illustrated that 61.1% of the managers
mentioned that customers need a meal with a good value and a cheap
price, 33.3% of them proposed that customers want big quantity meal,
while fast and friendly service is a prerequisite for customers as listed
by 47.2% of managers, as, 22.2 and 19.4% of the respondents claimed
that attractive atmosphere and good and near places for friend meeting,
respectively, which are the essential prerequisite for customers. Finally,
22.2% of the managers highlighted other needs and preferences include
the followings:
 Providing new trends.
 Local products, traditions taste.
 Hospitality and good treatment.
 Restaurants' reputation.
61.1%
33.3%
47.2%
22.2%19.4%
21.2%
0.0
10.0
20.0
30.0
40.0
50.0
60.0
70.0
Good valu and
cheap prices
Big quantityfast and
fiendly service
Attractive
atmosphere
Good and near
places for
friend
meetings
Others
Figure 19: Egyptian customers' needs and preferences.
86
Question NO. (4):- Managers' ways of dealing with customers'
needs and preferences.
The main aim of this question is to illustrate managers' ways of
dealing with customers' needs and preferences. Figure 20 showed
managers' ways to deal with customers' needs and preferences in fast
food operations.
47.2%
55.6%
41.7%
19.4%17.5%
0.0
10.0
20.0
30.0
40.0
50.0
60.0
Offering good
quality withgood
value
Offering good
service
Trying to meet
customers'
exepectaions
Research studyOthers
Figure 20: Managers' ways to deal with customers’ needs and
preferences.
Results highlighted that, offering good service and offering good
quality with good value were the most common ways used by
managers to deal with customers' needs with percents 55.6 & 47.2%
,respectively. 41.7% of managers were trying to meet customers'
expectations, and 19.4% of them used research study to expect
customers' needs and deliver it. Some managers (17.5%) provided
other solutions to handle customers needs include the followings:
 Continues training.
 Providing standardizations.
 Handling customers' problems.
 Product and place development.
87
Question NO. (5):- International Chain restaurants' attributes.
The main aim of this question is to illustrate international chain
restaurants' attribues. Data in figure 21 supported this aim and
illustrated managers' viewpoint about the common attributes for
international fast food restaurant chains in Egypt.
36.1%
44.4%
33.3%
47.2%44.4%
19.7%
0.0
5.0
10.0
15.0
20.0
25.0
30.0
35.0
40.0
45.0
50.0
Marketingand
promotional
activities
Famousand
brandname
International,
trustandin
everywhere
Goodservice
and
standardization
Standard
service
Others
Figure 21: International chain restaurants' attributes.
Results illustrated that 36.1% of the managers mentioned that the
most common attributes of international chain restaurants were
marketing and promotional activities, 44.4% of them proposed that
famous and brand name variable was one of international chain
restaurants' attributes. Besides, 47.2, 44.4 and 33.3% of the respondents
claimed that good service & standardization, standard service, and
international, trust in every where, respectively, were included by the
managers to the most international chain restaurants' attributes. Finally,
19.7% of the managers highlighted other attributes for international
fast food restaurants include the followings:
 Specialist.
 Good management.
 Training and research center.
 Apply good services for the youth such as comfortable chairs,
attractive TV channels, and Internet services.
88
 Special care about the children ( kids corner – kids meals – kids
toys).
 Apply special dishes or sandwiches meet the Egyptian traditions
(kofta –falafel – shawerma).
 Good crises management polices.
 Care about Egyptian habits and sharing festivals.
 Respect the believes and religions ( no wine – no pork).
 Employing the national people.
Question NO. (6):- Managers' evaluation for local fast food
operations.
The main aim of this question is to illustrate managers'
evaluation for local fast food operations. As shown in figure 22, that
83.3% of the managers accepted the local fast food restaurants in Egypt
as a successful operation, while; only 16.7% of the respondents
indicated that it was acceptable.
16.7%
83.3%
0.0
20.0
40.0
60.0
80.0
100.0
SuccessfulAcceptable
Figure 22: Managers' evaluation for local fast food operations.
Restaurant managers proposed the following reasons for that
success:
 Good quality and good price.
 Following good management style.
 Unique locations and decoration.
 Application of chains systems.
 Meet the Egyptian traditions.
89
Question NO. (7):- Managers' opinions in using international
concept by local fast food operations.
The main aim of this question is to illustrate managers' opinions
in using international concept by local fast food operations. Figure 23
shows this issue.
58.3%
41.7%
0.0
20.0
40.0
60.0
AgreeDisagree
Figure 23: Managers' opinions in using international concept by local
fast food operations.
Results proved that, 58.3% of the respondents disagreed with
that local fast food operation use international concept for the
following reasons:
 No need for making copies.
 They should be different.
 It's better to add more.
 They can take only management system.
 Not meet our habits.
 Should have special taste.
 Must be independent personality.
In the other hand, 41.7% of the managers accepted that local fast
food restaurants use international concept for the following reasons:
 Good concept and successful system.
 Good management system.
 Standardization.
 Good hospitality concept.
 Meet customers' needs.
91
 Standard quality and standard service.
 Standard promotional activities.
Question NO. (8):- Managers' evaluation of restaurant categories
factors
The main aim of this question is to illustrate managers'
evaluation of restaurant categories factors. From the tabulated data in
table (13), it could be noticed the statistics of different restaurant
categories in the study.
Table 13: Statistics of restaurants factors' evaluation
Independent Local chain
International
chain
Important
factors
Mean Std.
Deviation
Mean Std.
Deviation
Mean Std.
Deviation
Brand name 2.5 1.32 4.3 0.74 4.8 0.41
Location 2.6 1.18 4.1 0.68 4.7 0.55
Price 4 1.29 4.3 0.68 3.1 1.08
Food quality 3.2 1.18 4.4 0.65 4.2 0.70
Service quality 2.5 1.06 4 0.86 4.3 0.96
Consistence
Standard
2.5 1.38 3.8 0.78 4 0.77
Atmosphere 1.5 0.83 3.5 1.02 4.8 0.44
Promotional
activities 2.5 1.32 4.3 0.74 4.8 0.41
All factors
statistics 2.7 0.71 4.03 0.31 4.3 0.54
Results proposed that the respondents evaluated all factors in
independent restaurants as neutral factors by a grand mean of 2.7,
while they evaluated the same factors in local chain restaurants and
international chain ones as high level factors by grand means of 4.03 &
4.3, respectively. Statistically, X2
sig=0,00 illustrated that there is a
significant variation between respondents' evaluation for restaurant
categories' factors according to (P<,05).
91
Table (14) illustrated managers' ranking of preferable factors for
different restaurant categories according to their means.
Table 14: Restaurant categories factors' ranking according to their
means.
Independent
factors
Mean
Local chain
factors
Mean
International
chain
factors
Mean
Price 4.0 Food quality 4.4 Brand name 5
Food quality 3.2 Brand name 4.3
Promotional
activities
4.8
Location 2.6 Price 4.3 Location 4.7
Service quality 2.5 Location 4.1
Consistence
standard
4.4
Brand name 2.5
Service
quality
4.0 Atmosphere 4.3
Atmosphere 2.5 Atmosphere 3.9
Service
quality
4.3
Consistence
standard
2.5
Consistence
standard
3.8 Food quality 4.2
Promotional
activities
1.5
Promotional
activities
3.5 Price 3.1
Results highlighted that, price was the first preferable factor by
the respondents for independent restaurants and they ranked it as a high
level factor. Food quality, location, service quality, brand name,
atmosphere and consistence standard were respectively the second
preferable factors by the respondents in the independent restaurants,
managers ranked them as neutral factors by means ranged from 2.5 to
3.2. Promotional activities were the lowest level factor indicated by the
respondents for independents restaurants.
In the other hand, the managers evaluated food quality, brand
name, price, service quality, location and atmosphere respectively, as
high level factors to choose a local chain restaurant, besides; they
ranked consistence standard respectively, as high level factors to eat in
local chain restaurants and promotional activities at last position.
Finally, respondents evaluated the most attractive factors in
international chain restaurants as follows; brand name, promotional
92
activities, location, consistence standard, atmosphere, service quality,
and food quality respectively. Price was the last factor mentioned by
managers; they ranked it as neutral factor.
X2
sig=0,00 illustrated that there is a significant variation
between respondents' evaluation for restaurant categories' factors
according to (P<,05) as follow:
Brand name
Figure 24 highlighted that international chain restaurants took
the highest level among restaurant categories with that factor by 100%
(Highest level & high level) of respondents, while local chain
restaurants had the second position by 83.4% (Highest level & high
level) of them. Only 25% (Highest level & high level) of managers
ranked brand name factor in independent restaurants as high-level
factor. In the other side, 54.2% (Low level & lowest level) of the
respondents mentioned that independent restaurants had unknown
brand name
29.2%25%20.8%
16.7%
8.3%
16.7%
41.7%41.7%
20.8%
79.2%
0.0
10.0
20.0
30.0
40.0
50.0
60.0
70.0
80.0
90.0
Lowest levelLow levelNeutralHigh levelHighest level
Independent Local chains' Internationalchains
Figure 24: Managers' evaluation of brand name factor in QSRs.
93
Location
Figure 25 shows managers' evaluation of locations for different
restaurant categories.
Figure 25: Managers' evaluation of location factor in QSRs.
Results illustrated that, 95.8% (Highest level & high level) of the
managers indicated that international chain restaurants had the most
attractive locations. While the local chain restaurants took the second
position by 83.4% (Highest level & high level) of them. Only 25%
(Highest level & High level) of the respondents evaluated independent
restaurants' locations as good places. In the other hand, 50% (Low level
& lowest level) of the managers unaccepted independent restaurants'
locations.
20.8%
29.2%25%
20.8%
4.2%
16.7%
54.2%
29.2%
4.2%
20.8%
75%
0.0
10.0
20.0
30.0
40.0
50.0
60.0
70.0
80.0
Lowest levelLow levelNeutralHigh levelHighest level
Independent Local chains International chains
94
Price
Figure 26 shows managers' evaluation of price factor for
different restaurant categories.
Figure 26: Managers' evaluation of price factor in QSRs.
Results indicated that, price was the most effective factor in
independent restaurants; 70.8% (Highest level & high level) of the
respondent proposed that the price in independent restaurant was
reasonable. 87.5% (Highest level & high level) of managers mentioned
that local chain restaurants provide a logical price. International chain
restaurants were in the third position by 29.2% (Highest level & high
level) of the respondents expected that they provide rational price.
8.3%4.2%
16.7%20.8%
50%
12.5%
50%
37.5%
8.3%12.5%
50%
16.7%
12.5%
0.0
10.0
20.0
30.0
40.0
50.0
60.0
Lowest levelLow levelNeutralHigh levelHighest level
Independent Local chains International chains
95
Food quality
Figure 27 shows managers' evaluation of food quality factor for
different restaurant categories.
Figure 27: Managers' evaluation of food quality factor in QSRs.
Results illustrated that, 83.3% (Highest level & high level) of the
managers indicated that international chain restaurants had the
maximum food quality level. While the local chain restaurants took the
first position by 91.7% (Highest level & high level) of them. Besides,
37.5% (Highest level & high level) of the respondents evaluated
independent restaurants' food quality as a top level. In the other hand,
25% (Low level & lowest level) of the managers disagreed with
independent restaurants' food quality level.
8.3%
16.7%
37.5%
20.8%
16.7%
8.3%
41.7%
50%
16.7%
50%
33.3%
0.0
10.0
20.0
30.0
40.0
50.0
60.0
Lowest levelLow levelNeutralHigh levelHighest level
Independent Local chains International chains
96
Service quality
Figure 28 shows managers' evaluation of service quality factor
for different restaurant categories.
Figure 28: Managers' evaluation service quality factor in QSRs.
Results highlighted that, service quality was the most effective
factor in international chain restaurants by 87.5% (Highest level & high
level) of managers, while 75% (Highest level & high level) of the
respondents were satisfied with service quality in local restaurant
chains. Besides, 12.5% (Highest level & high level) of the managers
agreed with service quality in independent restaurants. In the other
side, 41.6% (Low level & lowest Level) of the respondents were
unsatisfied with the level of service quality offered in independent
restaurants.
20.8%20.8%
45.8%
8.3%4.2% 4.2%
20.8%
41.7%
33.3%
4.2%
8.3%
33.3%
54.2%
0.0
10.0
20.0
30.0
40.0
50.0
60.0
Lowest levelLow levelNeutralHigh levelHighest level
Independent Local chains International chains
97
Consistence standard
Figure 29 shows managers' evaluation of consistence standard
factor for different restaurant categories.
Figure 29: Managers' evaluation consistence standard factor in QSRs.
Results illustrated that, 83.4% (Highest level & high level) of the
managers ensured that international chain restaurants had a consistence
standard level for their products and services, and 45.9 and 20.8%
(Highest level & high level) of them claimed the same result for local
chain restaurants and independent restaurants, respectively. But, 54.1%
(Low level & lowest level) of managers mentioned that independent
restaurants had no consistence standard level.
33.3%
20.8%
25%
8.3%12.5% 4.2%
29.2%
50%
16.7% 16.7%
29.2%
54.2%
0.0
10.0
20.0
30.0
40.0
50.0
60.0
Lowest levelLow levelNeutralHigh levelHighest level
Independent Local chains International chains
98
Atmosphere
Figure 30 indicates that, 87.5% (Highest level & high level) of
the managers claimed that international chain restaurants had the most
attractive atmosphere, besides 75% and 20.8% (Highest level & high
level) of them ensured the same result for local chain restaurants and
independent restaurants respectively. On the other side, 50%, (Low
level & lowest level) of the respondents disagreed with the above result
for independent restaurants.
Figure 30: Managers' evaluation of atmosphere factor in QSRs.
20.8%
29.2%29.2%
20.8%
4.2%4.2%
16.7%
50%
25%
4.2%
8.3%
37.5%
50%
0.0
10.0
20.0
30.0
40.0
50.0
60.0
Lowest levelLow levelNeutralHigh levelHighest level
Independent Local chains International chains
99
Promotional activities
Figure 31 shows managers' evaluation of promotional activities
factor for different restaurant categories.
Figure 31: Managers' evaluation of promotional activities factor in
QSRs.
Results indicated that, 100% (Highest level & high level) of
managers claimed that international chain restaurants had the most
attractive promotional activities, besides 45.9% (Highest level & high
level) of them ensured the same result for local chain restaurants. On
the other hand, 79.1 and 12.5 % (Low level & lowest level) of
respondents were disagreed with the above result for independent
restaurants, and local chain restaurants, respectively.
70.8%
8.3%
20.8%
4.2%8.3%
41.7%
29.2%
16.7%
25%
75%
0.0
10.0
20.0
30.0
40.0
50.0
60.0
70.0
80.0
Lowest levelLow levelNeutralHigh levelHighest level
Independent Local chains International chains
111
Question NO. (9):- Labors turn over rate.
The aim of this question is to illustrate labors turn over rate. Figure 32
shows this issue and illustrates that 41.7% of restaurants' managers
indicated that, turn over rate was high in their establishments. On the
other hand, 45.8% of the respondents had a reasonable turn over rate in
their restaurants. Finally, 12.5% of the managers had a poor turn over
rate in their operations.
12.5%
45.8%
41.7%
0.0
10.0
20.0
30.0
40.0
50.0
Highacceptedpoor
Figure 32: Labor turn over rate in QSRs.
The analysis shows that, 85.7% of independent restaurant
managers had a high turn over rate in their establishments. Besides,
50% of international chain restaurant managers ensured the same
result. In the other hand, 69.2% of local chain restaurant managers
indicated that turn over rate in their restaurants was acceptable. Finally,
25% of international chain restaurant managers had a fair turn over rate
in their establishment.
111
foodin fastdecrease turn over rateMeans to-Question NO. (10):
operations.
The aim of this question is to illustrate means to decrease turn
over rate in fast food operations. Figure 33 indicates that, 83.3% of
managers' proposed good treatments of the staff as a suitable mean to
decrease staff turn over in their establishment. Besides, 58.3% of them
advocated that, good salary and with the same percent, respect and
good position were essential to keep staff in their organizations. Also,
25% of the respondents claimed that insurance is an important variable
to decrease staff turn over.
83.3%
58.3%
16.7%16.7%
58.3%
25%
0.0
10.0
20.0
30.0
40.0
50.0
60.0
70.0
80.0
90.0
Good
treatment
for the staff
Good
salary
Employee
of the
month
Festival
&thanks
letters
Respect
&good
position
Insurance
Figure 33: Means to decrease turn over rate in QSRs.
Finally, choosing employee of the month, and holding festivals
& sending thanks letter were another means to reduce staff turn over as
mentioned by 16.7% of the managers for each of them.
112
Question NO. (11):- Managers' evaluation of training level in fast
food operations.
The aim of this question is to illustrate managers' evaluation of
training level in fast food operations. Figure 34 shows that, 70.8% of
the managers mentioned that training level was good in their
restaurants. While 25% of the respondents indicated that training
level was fair. Finally, 4.2% of the managers proposed that training
level was poor in their establishments.
4.2%
25%
70.8%
0.0
20.0
40.0
60.0
80.0
GoodFairPoor
Figure 34: Managers' evaluation of training level in QSRs.
Cross tabulation analysis showed that 100% of international
chain restaurant managers had a high training level in their
establishments. Besides, 76.9% of local chain restaurant managers
ensured the same result. In the other hand, 57.1% of independent
restaurant managers indicated that training level in their restaurant was
acceptable.
Question NO. (12):- Training strategies in fast food operations.
The aim of this question is to illustrate training strategies in fast
food operations. Most of the respondents indicated that they had
training strategies for their operations that strategies include:
 On- job- training (83.3% of the managers)
 Off-job- training (41.7% of the managers)
 Language courses (37.5% of the managers)
 Daily and monthly meeting (75% of the managers)
113
 Daily briefing (83.3% of the managers)
 Old employee train new employee (25% of the managers)
Question NO. (13 ):- Managers' evaluation for marketing strategies
in fast food operations.
The aim of this question is to illustrate managers' evaluation for
marketing strategies in fast food operations. Data in figure 35 showed
that, 62.5% of managers mentioned that marketing strategies was good
in their restaurants. While 20.8% of respondents indicated that
marketing strategies was fair. Finally, 16.7% of managers proposed
that training level was poor in their establishments.
16.7% 20.8%
62.5%
0
20
40
60
80
GoodFairPoor
Figure 35: Managers' evaluation for marketing strategies in QSRs.
Restaurant managers proposed the following implemented
means as strategies for marketing in their establishments:
 Word of mouth (58.3% of managers)
 Magazine and newspapers (75% of managers)
 TV promotion (50% of managers)
 Billboard (41.7% of managers)
 Souvenirs & gifts (75% of managers)
 Kids gifts (25% of managers)
 Flyers and brochures
Cross tabulation analysis showed that 100% of international
chain restaurant managers had a high marketing strategy plan in their
establishments. Besides, 69.2% of local chain restaurant managers
ensured the same result. In the other hand, 42.9% of independent
114
restaurant managers indicated that they had a poor marketing strategy
in their restaurants.
Question NO. (14):- Managers' evaluation for quality level in fast
food operations.
The aim of this question is to illustrate managers' evaluation for
quality level in fast food operations. Figure 36 showed that, 83% of the
managers mentioned that quality level was good in their restaurants.
While 17% of the respondents indicated that quality level was fair.
Fair
17%
Good
83%
Figure 36: Managers' evaluation for quality level in QSRs.
The analysis showed that 100% of international chain restaurant
managers had a high quality level in their establishment. Besides 75 &
57.1% of local chain restaurant managers and independent restaurant
managers respectively ensured the same result. In the other hand,
42.9% of independent restaurant managers indicated that quality level
in their restaurant was acceptable.
115
Question NO. (15):- Quality development strategies in fast food
operations
The aim of this question is to illustrate managers' evaluation for
quality development strategies in fast food operations. 91.7% of
managers indicated that they had quality development strategies; which
include the following means:
 Follow up.
 Check every time.
 Guest survey.
 Deal with special companies for evaluating the quality
service cleanliness.
 Mastery shopper.
 Quality, service, and cleanliness analysis.
 Special department for quality development.
 Quality measuring systems.
Question NO. (16):- The extent of product development to meet
customers' needs
The aim of this question is to illustrate managers' evaluation for
the extent of product development to meet customers' needs. Figure 37
shows that, 79% of the managers mentioned that the extent of product
development to meet customers' needs was good in their restaurants.
While 21% of the respondents indicated that the extent of product
development to meet customers' needs was fair.
Good
79%
Fair
21%
Figure 37: The extent of product development to meet customers'
needs in QSRs.
116
Restaurant managers proposed the following implemented
means as tools for product development in their establishments:
 Adding new products.
 Market research.
 Customer needs analysis.
 New trend follow up.
 New systems application.
 Guest survey.
Question NO. (17):- Customers satisfaction measuring methods in
fast food operations
The aim of this question is to illustrate managers' evaluation for
customer's satisfaction measuring methods in fast food operations.
Figure 38 indicates that, 66.7% of the managers proposed guest
comment card as a suitable mean to measure customers' satisfaction in
their establishments. Besides, 58.3% of them advocated that, meeting
with guest was a second mean to measure customers' satisfaction in
their organizations. Also mastery shopper and guest survey were
another means to measure customers' satisfaction; mentioned by the
managers with percents of 29.2 and 25%, respectively.
66.7%
58.3%
29.2%
25%
8.3%8.3%
0.0
10.0
20.0
30.0
40.0
50.0
60.0
70.0
Guest
comment
card
Meeting
with guest
Mastery
shopper
Guest
survey
Hot lineGuest
book
Figure 38: Customers satisfaction measuring methods in QSRs.
Finally, hot line and guest book were the last means to measure
customers' satisfaction as mentioned by 8.3% of the managers for each
of them.
117
Question NO. (18):- Strengths and weakness points in local fast
food operations
The aim of this question is to illustrate managers' evaluation for
strengths and weakness points in local fast food operations. As
indicated by 87.5% of the managers there were strengths and weakness
points in fast food operations as follows:
4.5.18.1 Strengths points in local food operations
Restaurant managers highlighted the following points as
strengths points in local fast food restaurants:
 High quality.
 Fast and friendly service.
 Reasonable price.
 Product variety.
 Adopting new managerial systems.
 Using planned strategy.
 Continuous training.
 Planned marketing strategy.
Question NO. (18.2):- Weakness points in local fast food operations
Restaurant managers highlighted the following points as
weakness points in fast food restaurants:
 Un qualified employees.
 Changeable raw material price.
 Technology adoption.
 Distribution channels.
 Promotion.
 Healthy and hygiene aspects.
 Higher staff expectations.
118
Question NO. (19):- Opportunity’s and threats’ points in local fast
food operations.
The aim of this question is to illustrate managers' evaluation for
opportunity’s and threats points’ in local fast food operations. As
indicated by 79.2% of the managers, there were opportunities and
threats’ points in fast food operations as follows:
fast foodlocalpoints in’sOpportunity-):.1Question NO. (19
operations.
Restaurant managers highlighted the following points as
opportunities points in fast food restaurants:
 Brand extensions.
 New market share.
 New distribution channels.
 Increasing delivery service.
 New opening.
 Using technology.
Question NO. (19.2):- Threats’ points in local fast food operations.
 Restaurant managers highlighted the following points as threats
points in local fast food restaurants:
 Competitive aspects with different food and beverages
categories.
 Increased competition for fixed or demanding markets.
 Labor availability.
 Changeable market.
 New trends.
 Increasing customers' awareness with nutrition and safety and
hygiene aspects.
 There is no special department in schools and universities for the
fast food restaurant studies.
 Fresh graduates aren’t qualified enough.
 Changeable market trends.
 Declining demand.
 Higher customer expectations.
Walker (2006) and Ronald and Nykiel (2005)
119
4.6 Checklist Analysis, Results, and Discussion
Table 15 shows checklist results for restaurant categories' factors
in the study.
Table 15: Checklist results
Measured area
Exterior
Interior
Foodquality
Guestservice
Employee
appearance
Management
functions
Overall
score
Weight factor .10 .10 .30 .30 .10 .10
A- International chain restaurants
McDonald's .100 .095 .291 .278 .100 .090 95.4%
Burger King .100 .100 .295 .270 .100 .095 96%
Hardee's .100 .095 .291 .267 .100 .100 95.3%
KFC .100 .100 .264 .279 .094 .080 92%
Mean .100 .098 .285 .274 .099 .091 .95
%
100%
98%
95%
91%
99%
91%
95%B- Local chain restaurants
Cook Door .100 .090 .275 .280 .091 .087 92.3%
Makani .100 .095 .264 .243 .086 .063 85.1%
Felfela .100 .088 .255 .251 .084 .051 82.9%
Gado .100 .083 .256 .273 .081 .053 84.6%
Mean
.100 .089 .263 .262 .086 .064 .86
%
100%
89%
87.6%
87.3%
86%
64%
86%
C-Independent restaurants
Quick Meals .092 .080 .189 .219 .052 .026 65.8%
Sharmawy Sharm .083 .078 .195 .210 .073 .043 67.9%
El Sheikh .100 .088 .174 .210 .091 .027 69%
Naama .090 .083 .182 .230 .061 .028 67.4%
Mean .091 .082 .185 .217 .069 .031 .68
%
91.3%
82.3%
61.7%
72.4%
69.3%
31%
68%
111
Results highlighted that; international chain restaurants were the
first category by a mean of 95% of all factors in the study. This result
indicated that all most international chain restaurants were outstanding
level in the rating scale. In the other hand, local chain restaurants came
in the second position by a mean of 86% which proposed that most of
local chain restaurants took the level more than effective in the rating
scale. Finally, independent restaurants were in the last rating scale level
"poor" by a mean of 68 %.
These differences between restaurants categories were for the
following reasons:
4.6.1 Exterior factors
As illustrated in Table 16 that the differences between exterior
factors for all restaurants categories were not significant; International
chain restaurants and local chain restaurants took full mark for that
factor. But, independent restaurants took .091 from the factor total
rating (0.10) for the following reasons:
Table 16: Exterior factors in independent restaurants
Factors
No.of(No)
repetitions
Percentage
Parking lot/ landscape/ planters/ adjoining
property litter free.
2 50 %
Parking lot in good repair (no spot holes;
bumpers unbroken).
1 25 %
All exterior signs clean; good repair; working. 1 25 %
Menu board is clean, clear. 2 50 %
6
111
4.6.2 Interior factors
Results proposed that the mean of international chain restaurants
for that factor was .098 for the following reasons:
Table 17: Interior factors in international chain restaurants
Factors
No.of(No)
repetitions
Percentage
Wet floor signs clean; in good repair. 1 25 %
Vents clean, in good repair. 1 25 %
2
In the other hand the mean for local chain restaurants was .089
from the total factor rate (0.10);
Table 18: Interior factors in local chain restaurants
Factors
No.of(No)
repetitions
Percentage
Wet floor signs clean; in good repair. 3 75 %
Vents clean, in good repair. 2 50 %
Air vents free of dust/build up; in good repair. 1 25 %
Tables clean; in good repair. 3 75 %
9
112
Independent restaurants were at the last position for that factor
by a rating mean of .082 for the following reasons:
Table 19: Interior factors in Independent restaurants
Factors
No.of(No)
repetitions
Percentage
Wet floor signs clean; and in a good repair. 3 75%
Vents clean, and in a good repair. 2 50 %
Air vents free of dust/build up; in good
repair.
2 50 %
Tables clean; in good repair. 3 75 %
All lights working, light covers clean. 1 25 %
Dining room music is on; volume level
allows normal conversation.
1 25 %
Ceiling tiles clean, in good repair, lighting in
good repair, clean.
2 50 %
Dining room chairs clean; free of food
debris, in good repair.
2 50 %
All wall décor and plants clean. 2 50 %
18
113
4.6.3 Food quality factors
Table 20 highlights that international chain restaurants were in
the first position by a mean of .285 from the total factor rate of 0.30;
for the following reasons:
Table 20: Food quality factors in international chain restaurants
Factors
No.of(No)
repetitions
Percentage
All produce within code date. 2 50 %
Thaw/tempering chart posted and use. 1 25 %
Safety materials available, in good repair, in use. 1 25 %
Hand sinks are available clean; there are soap,
sanitizer, and drier.
1 25 %
5
114
On the other side, local chain restaurants came in the second position
by a mean of .263 for the followings:
Table 21: Food quality factors in local chain restaurants
Factors
No.of(No)
repetitions
Percentage
All bread products within code date. 2 50 %
All produce within code date. 2 50 %
All prepared or open product properly covered. 1 25 %
Thaw/tempering chart posted and use. 2 50 %
All thawed/tempered items are properly thawed. 1 25 %
Ice scoop used to portion, cup never touch the
ice, stored scoop handle not touching ice.
1 25 %
Safety materials available, in good repair, in use. 3 75 %
Hand sinks are available clean, there are soap,
sanitizer, and drier.
2 50 %
Measuring scales are available, in good repair, in
use.
1 25 %
Sanitizers are available, in exact concentrate, in
use.
1 25 %
16
115
Independent restaurants were the lowest food quality levels by a
mean of .185 for the following reasons:
Table 22: Food quality factors in independent restaurants
Factors
No.of(No)
repetitions
Percentage
Products on cooks line/dress station fresh;
condiments not mixed with each other, not
over stocked.
3 75 %
Tongs used to handle cooked meat patties. 2 50 %
Fries cooked in proper fry basket. 2 50 %
All bread products within code date. 3 75 %
All meat products within code date. 2 50 %
All produce within code date. 1 25 %
All dairy products within code date. 2 50 %
All prepared or open product properly
covered.
1 25 %
Thaw/tempering chart posted and use all. 2 50 %
Thawed/tempered items are properly thawed. 2 50 %
All fried products properly prepared and
portioned.
2 50 %
Ice scoop used to portion, cup never touch
the ice, stored scoop handle not touching ice
2 50 %
Safety materials available, in good repair, in
use.
3 75 %
Hand sinks are available clean, there are
soap, sanitizer, and drier
2 50 %
Measuring scales are available, in good
repair, in use.
3 75 %
Sanitizers are available, in exact concentrate,
in use.
3 75 %
35
116
4.6.4 Guest service factors
Table 23 proposed that international chain restaurants were in the
first position by mean .274 from the factor total rate 0.30; for the
following reasons:
Table 23: Guest service factors in international chain restaurants
Factors
No.of(No)
repetitions
Percentage
Employees present to great the guest immediately
with a smile and friendly greetings.
1 25%
Back line station prepared, properly stocked. 1 25 %
Cash machine, or visa card machine are available,
in use as needed.
3 75 %
Service times sometimes more than 5 minutes. 1 25 %
6
The researcher agrees with that the fast food restaurant, a place where a
customer should be served within five minutes of entering the outlet even
at peak periods. Ball (1992) agreed with Samle (1980). See page 5.
117
On the other side, local chain restaurants came in the second position
by mean .262 for the following:
Table 24: Guest service factors in local chain restaurants
Factors
No.of(No)
repetitions
Percentage
Employees present to great the guest
immediately with a smile and friendly greeting.
1 25 %
Employees are making good eye contact. 1 25 %
Employees have good posture, standing up
straight, not leaning. Looking their best.
1 25 %
Appropriate suggestive selling occurs (up sell,
add drinks, etc).
2 50 %
Backline station is coordinated, teamwork;
hospitality shown.
1 25 %
Cash machine, or visa card machine are
available, in use as needed.
4 100%
Service times some times more than 5 minutes. 1 25 %
11
118
Independent restaurants had the lowest food quality level by mean .217
for the following reasons:
Table 25: Guest service factors in independent restaurants
Factors
No.of(No)
repetitions
Percentage
Employees are making good eye contact. 2 50 %
Employees have good posture, standing up
straight, not leaning. Looking their best.
2 50 %
Appropriate suggestive selling occurs(up sell, add
drinks, etc)
2 50 %
The order is repeated back to the guest, when
appropriate.
2 50 %
Back line station communication evident;
directing, acknowledgement.
1 25 %
Backline station is coordinated, teamwork;
hospitality shown.
2 50 %
Back line station prepared, properly stocked. 2 50 %
Employees knowledgeable, well trained 3 75 %
Cash machine, or visa card machine are available,
in use as needed.
4 100 %
Service times more some times than 5 minutes. 2 50 %
22
119
4.6.5 Employee appearance
Results proposed that the mean of international chain restaurants
for that factor was .099 for the following reasons:
Table 26: Employee appearance in international chain restaurants
Factors
No.of(No)
repetitions
Percentage
Management name badge is worn and
name is readable.
1 25%
1
In the other hand the mean for local chain restaurants was .086
from the total factor rate (0.10); this result was for the following:
Table 27: Employee appearance in local chain restaurants
Factors
No.of(No)
repetitions
Percentage
Employees refrain from chewing gum,
eating, and drinking while on duty.
1 25%
Name badges are worn and name legible 2 50 %
Hands are washed frequently per sanitation
standards.
1 25%
Management name badge is worn and name
is legible.
3 75%
7
121
At the last position for that factor were independent restaurants
by a rating mean of .069 for the following reasons:
Table 28: Employee appearance in independent restaurants
Factors
No.of(No)
repetitions
Percentage
All employees are wearing approved uniform. 1 25%
Uniform is clean; free of wrinkles; properly
fitted; in good repair.
2 50%
Aprons are clean; in good repair. 1 25%
Name badges are worn and name legible. 2 50%
Hands are washed frequently per sanitation
standards.
1 25%
Male employees are clean, well shaven;
mustaches are neatly trimmed.
2 50%
Management is wearing a clean, pressed,
approved uniform.
1 25%
Management displays a professional image 3 75%
Management name badge is worn and name
is legible.
3 75%
16
121
4.6.6 Management functions
Results proposed that the mean of international chain restaurants
for that factor was .091 for the following reasons:
Table 29: Management functions in international chain restaurants
Factors
No.of(No)
repetitions
Percentage
Safety/accident prevention program in place. 1 25%
First aid cabinet is available, equipped, in use. 1 25%
Shift readiness/food quality checklist
completed and posted.
2 50%
Employee break area is available, neat, clean
and organized.
1 25%
5
122
In the other hand, the mean for local chain restaurants was .064
from the total factor rate (0.10); and this result was for the followings:
Table 30: Management functions in local chain restaurants
Factors
No.of(No)
repetitions
Percentage
Training materials are current, posted and used. 2 50 %
Proper security standards are followed – office
door, back door.
3 75%
Safety/accident prevention program in place. 2 50%
First aid cabinet is available, equipped, in use. 2 50%
Shift readiness/food quality checklist
completed and posted.
3 75%
Communication board posted and used 2 50%
Manager's office available, neat, and organized. 2 50%
Employee break area is available, neat, clean
and organized.
3 75%
19
123
At the last position for that factor were independent restaurants by
rating mean .031 for the following reasons:
Table 31: Independent restaurants
Factors
No.of(No)
repetitions
Percentage
Management is visible. 3 75%
Training materials are current, posted and used. 4 100%
Proper security standards are followed – office
door, back door.
3 75%
Safety/accident prevention program in place. 3 75%
First aid cabinet is available, equipped, in use. 3 75%
Shift readiness/food quality checklist completed
and posted.
4 100%
Communication board posted and used. 4 100%
Manager's office neat and organized. 3 75%
Employee break area is neat, clean and
organized.
3 75%
30
124
Table 32 shows the final restaurant categories rating scale.
Table 32: Restaurant categories rating scale
Rating scale
Excellent
(92-100)
Verygood
(86<92)
Good
(80<86)
Acceptable
(72<80)
Fair
(Below72)
A- Independent restaurants
Quick Meals 
Sharmawy Sharm 
El Sheikh *
Naama *
B- Local chain restaurants
Cook Door 
Makani *
Felfela *
Gado *
C- International chain restaurants
McDonald's *
Burger King *
Hardee's 
KFC 
125
Summary, Conclusion and recommendations
The food service industry may be classified in many different
ways. One way is to categorize it according to various markets. Food
service operations may also be classified according to the economic
objectives of the operation. There are three main categories of food
service operations under this type classification: Commercial,
instructional, and military.
It should be differentiate between food serving and food service ;
food serving is "the process of moving the food and/or beverage items
that have been prepared from production staff to service personnel"; while
food service is " the process of transferring food and/or beverage products
from service staff to guests".
Fast food establishments are those that serve foods for which there
is little or no waiting. Many people in the industry are beginning to
identify these as fast service restaurants in recognition of the fact that the
service is fast not the food.
Fast food based on current concepts falls into three basic
categories:-
 Utilization of time saving equipment.
 Utilization of labour saving equipment.
 Utilization of self - service devices or methods to reduce labour
overhead.
126
CHAPTER FIVE
SUMMARY, CONCLUSION AND
RECOMMENDATIONS
127
5.1. Summary
The researcher directs towards evaluating the experiment of the
local restaurant chain in Egypt. The study intended to assess the actual
state of the local restaurant chains experiment in the population being
selected and assess its prospective impact upon customer satisfaction.
The research is dependent on the descriptive annalistic
methodology. It is finally put data into diagrams.
83 % is the average response rate for the guest questionnaire and
82 % is the average response rate for the in – deep personnel interview.
Statistical Package for Social Sciences (SPSS) program was used when
analyzing data.
Results obtained indicated that most of managers and customers’
estimating for the experiment of the fast food concept in Egypt was
acceptable.
Results obtained indicated that most of managers and customers’
evaluation for the experiment of local restaurant chains in Egypt was
successful.
Results obtained indicated that the variables of food quality,
price and service quality were the first three important factors in QSRs
that attract customers. At the same time results obtained indicated that
61.1% of the managers mentioned that the customers need a meal with
a good value and cheap price, 33.3% of them proposed that customers
want big quantity meal, fast and friendly service is a prerequisite for
customers as listed by 47.2% of managers. At the same time results
obtained indicated offering a good service and a good quality with
good value which were the most common ways used by managers to
deal with customers needs with percent of 55.6 & 47.2% respectively.
41.7% of the managers were trying to meet customers' expectations,
and 19.4% of them used research study to expect customers' needs and
deliver it.
128
Results obtained indicated that 77.9% (Highest level & high
level) of the customers indicated that international chain restaurants
had the maximum food quality level. While the local chain restaurants
took the second position by 69.2% (Highest level & high level) of
them. More over the observation checklist point out that food quality
level in local restaurant chains 90%while the international chains come
in the first level by 93%. On the other side results illustrated that 83.3%
(Highest level & high level) of the managers indicated that
international chain restaurants had the maximum food quality level.
While the local chain restaurants took the first position by 91.7%
(Highest level & high level) of them.
Results obtained indicated that service quality was the most
effective factor in international chain restaurants by 64.4% (Highest
level & high level) of the customers, while 50% (Highest level & high
level) of the respondents were satisfied with service quality in local
chain restaurants. Also, service quality was the most effective factor in
international chain restaurants by 87.5% (Highest level & high level) of
the managers, while 75% (Highest level & high level) of the
respondents were satisfied with service quality in local restaurant
chains, Moreover the observation checklist point out that guest service
level in local restaurant chains by 83% while the international chains
come in the first level by 91%.
Results obtained indicated that 66.4% (Highest level & high
level) of the customers claimed that international chain restaurants had
the most attractive promotional activities, besides 23% (Highest level
& high level) of them ensured the same result for local restaurant
chains. Also 100% (Highest level & high level) of managers claimed
that international chain restaurants had the most attractive promotional
activities, besides 45.9% (Highest level & high level) of them ensured
the same result for local chain restaurants.
Results obtained indicated that 71.1% (Highest level & high
level) of customers ensured that international chain restaurants had a
consistence standard level for their products and services, and 49%
(Highest level & high level) of them claimed the same result for local
chain restaurants. Also, 83.4% (Highest level & high level) of
managers ensured that international chain restaurants had a consistence
129
standard level for their products and services, 45.9% (Highest level &
high level) of them claimed the same result for local chain restaurants.
Results obtained indicated that a 100% of international chain
restaurant managers had a high quality level in their establishments.
Besides, 75 & 57.1% of local chain restaurant managers and
independent restaurant managers respectively ensured the same result.
Results obtained indicated that 91.7% of the managers indicated
that they had quality development strategies. At the same time results
obtained indicated that 79% of the managers mentioned that the extent
of product development to meet customers' needs was good in their
restaurants. While 21% of the respondents indicated that the extent of
product development to meet customers' needs was fair.
Results obtained indicated that 100% of international chain
restaurant managers had a high training level in their establishment.
Besides, 76.9% of local chain restaurant managers ensured the same
result.
Results obtained indicated that 85.7% of the independent
restaurant managers had high turn over rate in their establishment.
Besides, 50% of international chain restaurant managers ensured the
same result. However, 69.2% of local chain restaurants managers
indicated that turn over rate in their restaurant were acceptable.
Results obtained indicated that 58.3% of the respondents
disagreed with that local fast food operation use international concept.
However, 41.7% of the managers accepted that local fast food
restaurants use international concept.
Results obtained indicated that, 100% of international chain
restaurant managers had a high marketing strategy plan in their
establishments. Besides, 69.2% of local chain restaurant managers
ensured the same result.
Results obtained indicated that, 66.7% of managers proposed
guest comment card as a suitable mean to measure customers'
satisfaction in their establishments. Besides, 58.3% of them advocated
that, meeting with guest was a second mean to measure customers'
satisfaction in their organizations.
131
5.2. Conclusions
The research used guest questionnaire forms, in-depth personal
interviews, and checklist to collect its primary data. Data obtained were
analyzed by using statistical analysis and qualitative analysis. Results
obtained support hypotheses being claimed.
As previously discussed throughout the researcher concludes
different issues concerning the problem being studied and the findings
include:
1. Evaluating the level of local restaurant chains compared with
the international chains.
(Each of the following attributes ranked from 1 to 5 according to its level)
1 2 3 4 5
Lowest Highest
Level Level
Attributes
Guest opinion Managers opinion
local
international
Thegab
local
international
Thegab
Brand name 3.6 4.2 -0.6 4.3 5 0.7-
Location 3.6 4.1 -0.5 4.1 4.7 -0.6
Price 3.7 3.4 0.3 4.3 3.1 1.2
Food quality 3.9 4.2 -0.3 4.4 4.2 0.2
Service quality 3.6 4 -0.4 4.0 4.3 -0.3
Consistency
standard
3.6 4 -0.4 3.8 4.4 -0.6
Atmosphere 3.1 3.8 -0.7 3.9 4.3 -0.4
Promotional
activities
2.9 3.8 -0.9 3.5 4.8 -1.3
131
2. Define the needed factors to develop the local restaurant chains
level to reach the international standard.
o Implement human developing strategies to develop the
human element
 Evaluating the human element
 Maintain a clear vision, mission, and operation strategies,
specify the roles.
 Applying system for staff (salary, staff meal, accommodation,
transportation)
 Motivational activities (employee of the month, birthdays,
festivals, thanks letters, incentive).
o Affecting follow up for sanitation and hygiene.
 Well awareness of personnel hygiene and sanitation.
 Hand sink with hot and cold water, soap, drier, and sanitizer
should be available.
 Private toilet for the staff and another for the guest should be
available.
 Use sanitizer gel for sanitation.
 Follow up for shaven and hand washing frequency and in the
right way per sanitation standard.
 Smoking in front of the store, or front of the guest should be
forbidden.
 Applicator the hazard analysis of critical control Points
(HACCP) system.
o Clarifying safety and security roles and effecting use for
tools
 First aid cabinet should be available
132
 Improving safety and security awareness.
 Applying a strong fair system, and fair alarm system.
 Frequency training for fair fighting.
 Execute safety materials (stainless gloves, cotton gloves,
safety apron, safety face cover, and wet floor sign)
 Implementing safety procedures in usual cleaning for the hood
o Applying a developing strategy through training and the
effective use for training material.
 Applying a developing strategy through training.
 Developing staff languages level (English, Russian, Italian,
etc…).
 Offering training material (Projector - video – screen-data
show) should be available and in use.
 Implementing operation systems (products mix analysis, sales
mix analysis, lunch production control, sales forecasting).
o Implementing executing operation procedures
 Measuring scales should be available
 Implementing receiving and storage procedures
 Using tempering day dot system (in, use, out).
 Use different cutting board with different colors.
 Occupying delivery bag to keep the food in the reasonable
temperature.
 Fit wrapping and bagging materials needed.
 Affective use of the information technologies (IT). Computer
system should be in use control, analyses, inventory,
scheduling, directing, training, order processing, accounting,
purchasing, marketing, consumer behavior, and the location of
new restaurants.
 Consistence standard for service time.
 Work with mystery shopper companies to evaluate the quality,
service-cleaning level in the chain compared with the other
chains and compared with the standard.
133
o Nutritional value
 Planning the menu based on nutritional value, profitability,
and publicity analysis.
 Stating nutritional facts in the main massage to the guest.
 Fresh juices, decaffeinated, water or low fat milk needed for
nutritional value.
 Special meals for diabetic, heart problems, high blood, and
healthy food are needed.
o Frequency follows up marketing and research study.
 Marketing research study and customer needs analysis should
be frequency.
 Well effective promotional activities.
 Continuing gust feedback and sensitivity analyses (guest
comment, surveys, comment cards, recommendation box, guest
complains, thanks letters).
 The effective use for the internet through survey, or
questionnaire for the guest through the internet.
 A logo is the restaurant's identifying mark that the public will
recognize.
 Analyzing competitor.
 Selecting well location in retail outlets such as forecourt shops,
clubs, and convenience stores.
o Focusing on guest satisfaction and following new trends.
 Covering most distances by home delivery
 Single-telephone-number systems in delivery firms use
computerized guest histories to facilitate order taking
 Well cares about carhop, drive in, and drive through,
delivery and catering.
 Accepting credit card payment, and offering credit card
machine.
134
 Applying new product frequency.
 Creating a web site, hot line or other advertisement that
makes the users meeting with your product or service
memorable.
 Applying enough area for the youth (comfortable chairs,
attractive television channels, and the Internet services).
 Caring for the kids (kid's meals, kid's gifts, kid's birthdays,
kid's area, and kids in the school.
 Customer feedback is vital to improve product quality.
 Solving problems and meeting queries.
 Providing a personal touch (treating the customer as an
individual).
o Reduced clarified strategy to offer qualified elements for the
restaurant field by ministry of education and ministry of
tourism.
 Supporting languages studying (English, Russian, Italian,
etc…).
 Special courses for the restaurant staff about (Personnel
hygiene, security, safety, service, customer satisfaction,
hospitality).
 Special department for restaurant services (back line, front
line).
 Special courses for the restaurant managers about (team built,
time management, leadership, supervisor skills, management
skills, staff direction, delegation, empowerment, sales
forecasting, and lunch production control).
3. Evaluating international chains product developing
flexibility to meet national taste.
o Applying special dishes or sandwiches meet the Egyptian
traditions (kofta – falafel– shawerma).
o Applying crises management polices.
o Studying Egyptian habits and sharing festivals.
o Respect believes and religions (no wine – no pork).
o Employing the national people.
135
5.3. Recommendations
The study raises the following recommendations for further study.
The researcher to develop the experiment of local restaurant
chains in Egypt suggests varied recommendations. Here are some of
these recommendations:
1. Implement human developing strategies to develop the
human element.
2. Affecting follow up for sanitation and hygiene roles.
3. Clarifying safety and security roles and effecting use for tools.
4. Applying a developing strategy through training and the
effective use for training material.
5. Implementing executing operation procedures.
6. Planning the menu based on nutritional value, profitability,
and publicity analysis.
7. Frequency follows up marketing and research study.
8. Focusing on guest satisfaction and following new trends.
136
REFERENCES
137
 Ball, S. D. (1992):
"Fast Food Operations and their Management", Edward Arnoldo
Publishers LTD, England, pp.19, 172,252.
 Bateson, J. E. (1995):
"Managing Services Marketing", Text and Readings, 3rd
Ed, the
Dryden Press, Harcourt Brace College Publishers Fort Worth
Philadelphia San Diego, New York, pp.558- 570.
 Blackett, T. (2003):
"Brand Channel Com Brand Trust Customer Attraction and Retention
Brand Brands Branding.Htm".
http://.www.Brandchannel.Com/Brand_Speak.asp?bs_id=70
 Brian, D. S. (2006):
"Caterer and Hotelkeeper", 12-18 October 2006, pp.71.
 Briggs, R. (2000):
"Food Purchasing and Preparation", Cassell, New York, pp. 198-205.
 Brymer, R.A. (1995):
"Hospitality Management an Introduction to the Industry", 7th
Ed,
U.S.A.: Kendall/ Hunt Publishing Company, pp. 417-419.
 Cooper, C., and Lawson, R. (2004):
"Hospitality, Tourism, and Lifestyle Concepts: Implications for Quality
Management and Customer Satisfaction", THHP the Haworth
Hospitality Press An Imprint of the Haworth Press, Inc. New York, pp,
2-7, 37, 38.
 Dharmaraj, E. (2002):
"Food, and Hotel Legislations, and Policies", New Age International
(P) Limited, Publishers, New Delhi, pp. 58 - 67.
 Donnelly, Jr.J., Gbson, J.I., and Ivancevich, J.M. (1998):
"Fundamentals of Management", Irwin Mc Grew-Hill, New York, pp.
483- 493.
138
 Dube, L., and Renaghan, L, M. (1999):
"Cornell Hotel and Restaurant Administration Quarterly", December
40, No 4, pp. 16.
 Easerbrook. (2006):
"Caterer and Hotelkeeper", 12-18 October, pp.11.
 Etzel, M.J. (2004):
"Marketing", 13th
Ed. John Wiley and Sons, London, pp. 318 - 329.
 Field (1999):
"Cornell Hotel and Restaurant Administration Quarterly", Volume 40, No 1, pp.
69, 72.
 Finn, M. E .,White, M, and Walton, M. (2000):
"Tourism and Leisure Research Methods", Data Collection, Analysis and
Interpretation", Longman, England, pp.226.
 Foster, D.L. (1993):
"Hospitality Professional Series, Food and Beverage: Operations,
Methods, and Cost Controls'', Glencoe Macmillan / MC Graw-Hill
Lake Forest, pp. 22-33.
 Ghislli, R. F., La Lopa, J.M, and Billy B. (2001):
"Cornell Hotel and Restaurant Administration Quarterly", Volume 42,
No 2, pp.29.
 Gottleb, L. (1982):
"Food Service Hospitality Advertising and Promotion", Bobbs-Merrill
Educational Publishing Indianapolis Printed in the United States of
America, pp. 158-161.
 Gouville, J. T., and Soman, D. (2001):
"Cornell Hotel and Restaurant Administration Quarterly", Volume 42,
No 3, pp.29.
139
 Gregory, S., and Brieiter,D. (2001):
"Leveling the Playing Field: E-Marketing's Impact on Loading
Operations", Journal of Hospitality and Leisure Marketing, Volume 7,
No 4, pp.45.
 Hahm, S, P., and Khan, A.M. (2001):
"Journal of Restaurant and Food Service Marketing ™", Volume 4,
Number 3, Haworth Hospitality Press ® New Trend in Lodging, Tourism
and Food Service Managements, pp. 66, 77, 121.
 Hill, C.W., and Jones, G.R. (1998):
"Strategic Management Theory", An Integrated Approach, 4th
Ed,
Houghton Mifflin Company, New York, pp. 157-163, 395.
 Huber, M., and Pilmanis, P. (2001):
"Journal of Restaurant and Food Service Marketing™", Volume 4,
Number 4, Haworth Hospitality Press ® New Trend in Lodging, Tourism
and Food Service Managements, pp. 199-209.
 King, Jr. J, and Ronald F. (2006):
"Managing for Quality in the Hospitality Industry", Person Prentice
Hall Upper Saddle River, New Jersey 07458, pp, 3-12, 49-79.
 Kotler, P., and Armstrong, G. (1996):
"Principles of Marketing", Prentice Hall International, New Jersey, pp.
272.
 Khan, M.A. (1991):
"Concepts of Food Service Operations and Management", 2nd
Ed,
John Wiley and Sons, Inc. New York, pp. 13-15
 Lan, L., and khan, M. A. (1995):
"Cornell Hotel and Restaurant Administration Quarterly", Volume 22,
No 1, P. 21.
141
 Lane, H.E. and Duper, D. (1997):
"Hospitality World an Introduction", Van Nostrand Reinhold, U S A,
PP. 217-228, pp.39.
 Lillicrap, D., Cousins, J., and Smith, R. (2002):
"Food and Beverage Service", 6th
Ed, Hodder and Stoughton a Member
of the Hodder Headline Group, pp. 6, 404.
 Martina, P. (1958):
"The Personality of the Retail Store", Havrd Business Review, Vol.36,
C.F. Ball, S. (1992):. Fast Food Operations and their Management, 1st
Ed, Stanley Thrones Ltd .pp. 133.
 Mattila, A. S. (2001):
"Cornell Hotel and Restaurant Administration Quarterly", Volume 42,
No 4, pp. 73-78.
 Medik, S. (1999):
"The Business of Hotels", 3rd
Ed, Butterworth - Heinemann.pp.79, 134-
138.
 Melaniphy, J, C. (2005):
"Restaurant and Fast Food Site Selection", 2nd
Ed, John Wiley and
Sons, New York, pp. 9, 16.
 Negl, J. (2002):
"Marketing and Sales Strategies for Hotels and Travel Trade",
S.CH and Company LTD. Ram Nagar, New Delhi -110 055, pp. 23,
95-98.
 Noel, C., and Cullen, E. D. (1996):
"The World of Culinary Supervision, Training, and Management",
Prentice Hall, Englewood Cliffs, NJ 07632, pp. 29, 38, 156, 174.
 Parsa, H. G., Self, J. T. Njte, D., and King, T.(2005):
Cornell hotel and restaurant administration quarterly,
Volume 45, No 3, August 2005, pp. 311-317.
141
 Pepper, M., Pratt, G., and Winnick, A. (1984):
"Customer Service, Food Service Skills Services",
Bonnet Publishing Company, Peoria, Illinois 61615, pp. 15,
16, 60.
 Peppers, D., and Rogers, M. (1997):
"Enterprise One-to-One, Tools for Building Unbreakable Customer
Relationships in the Interactive Get", Great Britain, pp.197-202.
 Powers, T. (1995b):
"Introduction to Professional Food Service ", 5th
Ed, John Wiley and
Sons, USA, , pp, 176-200.
 Powers, T. (1995a):
"Introduction to the Hospitality Industry", 3rd
Ed
John Wiley & Sons, INC New York,pp. 30, 120 - 131.
 Powers, T., and Barrows, C.W. (1999):
"Introduction to Management in the Hospitality Industry", 6th
Ed,
John Wiley and Sons, Inc New York, pp. 148-157.
 Powers, T., and Barrows, C.W. (2006):
"Introduction to Management in the Hospitality Industry", 8th
Ed, John
Wiley and Sons. Inc, pp.53-58.
 Reay, J. (1983):
"A Guide to Catering Organization", Stanley Thrones Ltd, London,
pp.70 - 89.
 Reid, R. D. (1989):
"Hospitality Marketing Management", 2nd
Ed, Van Nostrand Reinhold
Inc., New Yourk, pp 31-35, 108.
 Reid, R. D, and Bojanic, D. C. (2006):
"Hospitality Marketing Management", 4th
ED, John Wiley and Sons,
Inc, Canada, pp. 9-27, 553-562.
142
 Ridgeway, J., and Ridgeway, B. (1994):
"The Catering Management, The complete Judie to Hotel, Restaurant,
and Outside Catering" Hand Book, Cogan Page, London, pp. 18-25.
 Ronald, A., and Nykiel, P.D. (2005):
"Hospitality Management Strategies", Pearson Prentice Hall Upper
Saddle River, NJ 07458, pp. 142, 389-391.
 Samle, P. T. (1980):
"The UK Fast Food Market", An Operator View in Planning for Fast
Foods, Report on Retail Planning Conference, December, C. F,
pp.122.
 Scanlon, N. (1998):
"Quality Restaurant Service Guarantied", John Wiley and Sons, New
York, pp. 17.
 Schultz, D. E., Robinson, W.A., and Petrison, L.A. (1993):
"Sale Promotion, Techniques of Sale", NTC Business Books, a
Division of NTC Publishing Group, Lincolnwood, Illinois USA. pp. 2-
7.
 Schroeder, R.G. (2004):
"Operations Management", Contemporary Concepts and Cases, 2nd
Ed,
John Wiley and Sons, New York, pp. 33-40, 128-167.
 Seidman, A., and Johnson, W. (2002):
"Journal of Food Service Business Research™", Volume 5, no 3 2002,
Haworth Hospitality Press ® New Trend in Lodging, Tourism and
Food Service Managements, pp. 252 - 256.
 Spurlock, M. (2005):
"Don't Eat This Book, Fast Food and the Super Sizing of America",
Printed in the United States of America, pp. 119-122, 149-153.
143
 Stutts, A.T., and Wortman, J.F. (2006):
"Management within Hotels / Lodgers ", an Introduction, 2nd
Ed, pp.
113, 153, 222.
 Van Hoof, H. B., McDonald, M. E., Lawrence, Y., and Vallen,
G. K (1996):
"A Host of: an Introduction to Hospitality Management", Printed in
United State of America, pp. 319, 334, 369, 461-479.
 Wade, D. (2006):
"Successful Restaurant Management", From Vision to Execution
Thomson Delmar Learning, Hospitality, Travel and Tourism, Donald
Wade, United States, pp. 49, 81, 226 - 229.
 Walker, J.R. (2006):
"Introduction in Hospitality", Person Prentice Hall Upper Saddle River,
New Jersey 07458, pp. 254-257, 545-523.
 Wiley, J., and Sons. (2006)
"How to Make a Restaurant a Success", 3rd
Ed, John Wiley and Sons,
Inc, pp. 4 - 15, 166.
 Williams, A. (2002)
"Understanding the Hospitality Consumer", John Wiley and Sons, New
York, pp. 22-29, 68.
 Wyckoff, D. (2001)
"Cornell Hotel and Restaurant Administration Quarterly", Volume 42,
No 4, pp. 26 - 33.
144
APPENDICES
145
APPENDIX (A1)
Guest Questionnaire Form
146
Helwan University
Faculty of Tourism &Hotel Management
Hotel Management Department
Guest Questionnaire
Dear guest,
This questionnaire is a part of a master degree study at Faculty of
Tourism and Hotel Management; Helwan University. This study
focusing on evaluating the experiment of the local restaurant chains
compared to the international chains in Egypt.
Your opinion is extremely valuable for this study. Answers are
strictly confidential and will be used only for the purpose of the study.
(Thank you)
1. Do you deal with fast food restaurants?
a) Always
b) Usually
c) Sometimes
d) Few
e) Never
147
2. Which meal do you prefer to deal with fast food restaurant?
(Please, rank the following meals from 1 to 3 according to
your preferences)
1 2 3
Most Least
Preferences preferences
a) Breakfast
b) Lunch
c) Dinner
3. Which type of fast food restaurants do you prefer?
(Please, rank the following kinds of fast food chains from 1 to 3 according to
your preferences)
1 2 3
Least Most
Preference Preference
a) Independent restaurants
b) Local chains
c) International chains
4. Why
148
5. What are the most important factors in a fast
food restaurant that attract you to select it?
(Please, rank each of the following factors from 1 to 5 according to its
effectiveness in your choice)
1 2 3 4 5
Least Most
Important Important
54321Factors
Brand name
Location
Price
Food quality
Service quality
Consistence standard
Menu variety
Atmosphere ( Cleanliness- décor-
music-lights- temperature)
Promotional activities
Others
Specify
149
6. Could you rank the level of each of independent restaurants,
local restaurant chains, and international restaurant chains in
these following factors?
(Please, rank each of the following factors from 1 to 5 according to its level)
1 2 3 4 5
Lowest Highest
Level Level
International
chains
Local
chains
IndependentFactors
Brand name
Location
Price
Food quality
Service quality
Consistence standard
Menu variety
Atmosphere
Promotional
activities
7. What is your evaluation for the experiment of local fast food
restaurant chains in Egypt?
a) Successful
b) Acceptable
c) Not acceptable
151
8. What are the advantages and disadvantages in local fast food
chains?
9. Have you ever met any problem through your experiment with
local fast food restaurant chains?
a) Yes
b) No
If your answer yes; please explain?
10. If, you have any suggestions or recommendations please
mention here
151
Personal data:-
A. Gender
a) Male
b) Female
B. Age
a) Less than 25 years
b) From 25 to 40 years
c) More than 40 years
C. Marital status
a) Single
b) Married with out children
c) Married with children
D. Nationality
( )
152
‫والفنادق‬ ‫السياحة‬ ‫كلية‬
‫قسم‬‫ا‬‫أل‬‫داره‬‫الفندقية‬
‫رأي‬ ‫استطالع‬ ‫استمارة‬
‫العزيز‬ ‫ضيفنا‬:-
‫أرجو‬‫االستمارة‬ ‫هذه‬ ‫بمليء‬ ‫وقتكم‬ ‫يسمح‬ ‫أن‬,‫وهي‬‫ماجستير‬ ‫رسالة‬ ‫من‬ ‫جزء‬‫السياحة‬ ‫بكلية‬
‫حل‬ ‫جامعة‬ ‫والفنادق‬‫وان‬.‫منها‬ ‫الهدف‬‫بالسالسل‬ ‫مقارنة‬ ‫المحلية‬ ‫المطاعم‬ ‫سالسل‬ ‫تجربة‬ ‫تقييم‬
‫مصر‬ ‫في‬ ‫العالمية‬.
‫األهمية‬ ‫شديد‬ ‫رأيك‬‫هذه‬ ‫في‬‫الدراسة‬.‫البحث‬ ‫لغرض‬ ‫وهي‬ ‫التامة‬ ‫بالسرية‬ ‫تحاط‬ ‫اإلجابات‬ ‫هذه‬
‫فقط‬ ‫العلمي‬.
‫معنا‬ ‫تعاونكم‬ ‫لحسن‬ ‫وشكرا‬.
1.‫هل‬‫مطاعم‬ ‫مع‬ ‫تتعامل‬‫السريعة‬ ‫الخدمة‬‫؟‬
‫أ‬)‫دائ‬‫ما‬
‫ب‬)‫عادة‬
‫ج‬)‫أحيانا‬
‫د‬)‫قليال‬
‫ه‬)‫أبدا‬
2.‫وجبة‬ ‫أي‬ ‫في‬‫تناول‬ ‫تفضل‬‫الوجبات‬‫السريعة؟‬
(‫من‬ ‫الوجبات‬ ‫رتب‬ ‫فضلك‬ ‫من‬1-3‫تبع‬‫ا‬‫تناولها‬ ‫ألفضلية‬)
123
‫تفضيال‬ ‫اقل‬‫تفضيال‬ ‫أكثر‬
‫أ‬)‫اإلفطار‬
‫ب‬)‫لغذاء‬
‫ج‬)‫العشاء‬
153
3.‫ا‬ ‫مطاعم‬ ‫من‬ ‫نوع‬ ‫أي‬‫لخدمة‬‫تفضل‬ ‫السريعة‬‫؟‬
(‫رتب‬ ‫فضلك‬ ‫من‬‫المطاعم‬ ‫أنواع‬‫من‬1-3‫تناولها‬ ‫ألفضلية‬ ‫تبعا‬)
123
‫اكثر‬‫تفضيال‬‫اقل‬‫تفضيال‬
‫أ‬)‫المطاعم‬‫المستقل‬‫ة‬
‫ب‬)‫المطاعم‬ ‫سالسل‬‫ال‬‫محلية‬
‫ج‬)‫سالسل‬‫المطاعم‬‫ال‬‫عالمية‬
4.‫لماذا؟‬
5.‫أهم‬ ‫هي‬ ‫ما‬‫العناصر‬‫ا‬ ‫مطاعم‬ ‫في‬‫لخدمة‬‫السريعة‬‫تختار‬ ‫تجعلك‬ ‫التي‬‫األخر‬ ‫دون‬ ‫المطاعم‬ ‫أحد‬‫؟‬
)‫بترتيب‬ ‫قم‬ ‫فضلك‬ ‫من‬‫من‬ ‫عنصر‬ ‫كل‬‫من‬ ‫االتية‬ ‫العناصر‬1-5‫تبعا‬‫أ‬ ‫لمدي‬‫هم‬‫ية‬
‫العن‬‫صر‬‫ل‬ ‫اختيارك‬ ‫في‬‫األخر‬ ‫دون‬ ‫مطعم‬)
12345
‫أهمية‬ ‫اقل‬‫أهمية‬ ‫أكثر‬
‫اإلقبال‬ ‫علي‬ ‫تؤثر‬ ‫التي‬ ‫العناصر‬12345
‫المطعم‬ ‫شهرة‬
‫المطعم‬ ‫موقع‬
‫ا‬‫لسعر‬
‫الطعام‬ ‫جودة‬
‫الخدمة‬ ‫جودة‬
‫المنتج‬ ‫جودة‬ ‫ثبات‬
‫بقا‬ ‫األصناف‬ ‫تنوع‬‫الطعام‬ ‫ئمة‬
‫العام‬ ‫الجو‬(‫نظافة‬-‫ديكور‬-‫موسيقي‬-
‫إضاءة‬-‫الحرارة‬ ‫درجة‬)
‫الترويجية‬ ‫األنشطة‬
‫عناصر‬‫أخري‬------------------
154
6.‫من‬ ‫كل‬ ‫مستوي‬ ‫تقييم‬ ‫تستطيع‬ ‫هل‬‫و‬ ‫المستقلة‬ ‫المطاعم‬‫السالسل‬‫المحلية‬‫والسالسل‬
‫العالمية‬‫التالية؟‬ ‫النقاط‬ ‫خالل‬ ‫من‬
(‫فضلك‬ ‫من‬‫بترتيب‬ ‫قم‬‫من‬ ‫عنصر‬ ‫كل‬‫من‬ ‫االتية‬ ‫العناصر‬1-5‫للمستوي‬ ‫تبعا‬)
12345
‫اقل‬‫مستوي‬‫مستوي‬ ‫اعلي‬
‫العناصر‬‫مطاعم‬
‫مستقلة‬
‫سالسل‬
‫محلية‬
‫سالسل‬
‫عالمية‬
‫المطعم‬ ‫شهرة‬
‫المطعم‬ ‫موقع‬
‫ا‬‫لسعر‬
‫ال‬ ‫جودة‬‫طعام‬
‫الخدمة‬ ‫جودة‬
‫المنتج‬ ‫جودة‬ ‫ثبات‬
‫الطعام‬ ‫بقائمة‬ ‫األصناف‬ ‫تنوع‬
‫العام‬ ‫الجو‬
‫الترويجية‬ ‫األنشطة‬
7.‫ل‬ ‫تقييمك‬ ‫هو‬ ‫ما‬‫؟‬ ‫مصر‬ ‫في‬ ‫المحلية‬ ‫المطاعم‬ ‫سالسل‬ ‫تجربة‬
‫أ‬)‫ناجحة‬
‫ب‬)‫مقبولة‬
‫ج‬)‫غير‬‫مقبولة‬
8.‫م‬‫نظرك‬ ‫وجهة‬ ‫ن‬,‫م‬‫أهم‬ ‫هي‬ ‫ا‬‫وا‬ ‫المميزات‬‫المطاعم‬ ‫سالسل‬ ‫بها‬ ‫تتحلي‬ ‫التي‬ ‫لعيوب‬
‫المحلية‬‫؟‬
155
9.‫خالل‬ ‫مشكالت‬ ‫أي‬ ‫قابلت‬ ‫هل‬‫سالسل‬ ‫مع‬ ‫تجربتك‬‫مطاعم‬‫الخدمة‬‫السريعة‬‫؟‬ ‫المحلية‬
‫أ‬)‫نعم‬
‫ب‬)‫ال‬
‫اشرحها؟‬ ‫فضلك‬ ‫من‬ ‫نعم‬ ‫اإلجابة‬ ‫كانت‬ ‫إذا‬
11.‫أراء‬ ‫أو‬ ‫اقتراحات‬ ‫أي‬ ‫لديك‬ ‫كان‬ ‫إذا‬‫من‬‫اذكرها‬ ‫فضلك‬‫؟‬
11.‫شخصية‬ ‫بيانات‬
1.‫النوع‬
‫أ‬)‫ذكر‬
‫ب‬)‫أنثي‬
‫ب‬-‫العمر‬
‫أ‬)‫من‬ ‫اقل‬25
‫ب‬)‫من‬25-40
‫ج‬)‫من‬40‫فأكثر‬ ‫سنة‬
‫ج‬-‫االجتماعية‬ ‫الحالة‬
‫أ‬)‫أعزب‬
‫ب‬)‫متزوج‬‫أطفال‬ ‫لديه‬ ‫وليس‬
‫ج‬)‫متزوج‬‫أطفال‬ ‫ولديه‬
‫د‬-‫الجنسية‬
()
156
APPENDIX (A2)
In-depth Personal Interviews Form
157
In-depth personal interviews
with the chains and restaurant managers
Name:-……………… Profession:-……………….
1. What is your evaluation for fast food chains in Egypt?
a) Successful
b) Acceptable
c) Not acceptable
Explain?
2. What are the expectations of the Egyptian market about the
fast food concept?
3. What are the needs and preferences of the Egyptian customer?
4. How do you deal with these needs and preferences?
5. What are the common attributes for the international fast food
restaurant chains in Egypt?
6. What is your evaluation for the local fast food restaurant
chains in Egypt?
a) Successful
b) Acceptable
c) Not acceptable
Explain?
158
7. Some local restaurant chains use the international concept.
What is your opinion?
Agree
Disagree
Why ?
8. Could you rank the level of each of independent restaurants
local restaurant chains and international restaurant chains in
the following factors?
(Please, rank each of the following factors from 1 to 5 according to its level)
1 2 3 4 5
Lowest Highest
Level Level
International
chains
Local
chains
IndependentFactors
Brand name
Location
Price
Food quality
Service quality
Consistence standard
Atmosphere
Promotional
activities
9. What is the labor turn over rate in your chain?
a) Low
b) Moderate
c) High
10. What is your chain concept to decrease the turn over rate?
159
11. What is your evaluating for the training level in your chain?
a) Good
b) Fair
c) Poor
12. What are the training strategies in your chain?
13. What is your evaluating for the marketing strategies in your
chain?
a) Good
b) Fair
c) Poor
Explain
14. What is your evaluating for the quality level in your chain?
a) Good
b) Fair
c) Poor
15. What is the quality develop strategy in your chain?
16. What is the extent of product development according to
customer needs in your chain?
a) Good
b) Fair
c) Poor
Explain:-
17. What are the customer satisfaction measuring methods in your
chain?
18. What are the strengths and weakness points for local
restaurants chain?
19. What are the opportunities and threats points for local
restaurants chain?
161
‫شخصية‬ ‫مقابالت‬‫والمطاعم‬ ‫السالسل‬ ‫مديري‬ ‫مع‬
‫االسم‬:-‫الوظيفة‬:-
1.‫لسالسل‬ ‫تقييمك‬ ‫هو‬ ‫ما‬‫مطاعم‬‫السريعة‬ ‫الوجبات‬‫؟‬ ‫مصر‬ ‫في‬
‫أ‬)‫ناجحة‬
‫ب‬)‫مقبولة‬
‫ج‬)‫غير‬‫مقبولة‬
‫؟‬ ‫أشرح‬
2.‫ما‬‫المص‬ ‫السوق‬ ‫توقعات‬ ‫هي‬‫ل‬ ‫بالنسبة‬ ‫ري‬‫الوجبات‬ ‫مطاعم‬ ‫مفهوم‬‫السريعة‬‫؟‬
3.‫ما‬‫االحتياجات‬ ‫هي‬‫والتف‬‫ض‬‫؟‬ ‫المصري‬ ‫بالعميل‬ ‫الخاصة‬ ‫يالت‬
4.‫كيف‬‫هذه‬ ‫تلبي‬‫االحتياجات‬‫والتفض‬‫؟‬ ‫يالت‬
5.‫ما‬‫هن‬‫السريعة‬ ‫الوجبات‬ ‫لمطاعم‬ ‫الخاصة‬ ‫المميزات‬‫في‬ ‫العالمية‬‫مصر؟‬
6.‫ما‬‫؟‬ ‫مصر‬ ‫في‬ ‫المحلية‬ ‫المطاعم‬ ‫سالسل‬ ‫لتجربة‬ ‫تقييمك‬ ‫هو‬
‫أ‬)‫ناجحة‬
‫ب‬)‫مقبولة‬
‫ج‬)‫غير‬‫مقبولة‬
‫أشرح‬:-
7.‫في‬‫المحلية‬ ‫المطاعم‬ ‫سالسل‬ ‫بعض‬ ‫اتخذت‬ ‫األخيرة‬ ‫الفترة‬‫الفكر‬‫العالمي‬.‫؟‬ ‫رأيك‬ ‫هو‬ ‫ما‬
‫أ‬)‫موافق‬
‫ب‬)‫غير‬‫موافق‬
‫لماذا؟‬
161
8.‫تستطيع‬ ‫هل‬‫تقييم‬‫من‬ ‫كل‬ ‫مستوي‬‫و‬ ‫المستقلة‬ ‫المطاعم‬‫ا‬‫لسالسل‬‫والسالسل‬ ‫المحلية‬
‫النقا‬ ‫خالل‬ ‫من‬ ‫العالمية‬‫التالية؟‬ ‫ط‬
)‫م‬‫ن‬‫بترتيب‬ ‫قم‬ ‫فضلك‬‫من‬ ‫عنصر‬ ‫كل‬‫من‬ ‫االتية‬ ‫العناصر‬1-5‫للمستوي‬ ‫تبعا‬)
12345
‫أ‬‫قل‬‫مستوي‬‫أ‬‫مستوي‬ ‫علي‬
‫العناصر‬‫مطاعم‬
‫مستقلة‬
‫سالسل‬
‫محلية‬
‫سالسل‬
‫عالمية‬
‫المطعم‬ ‫شهرة‬
‫المطعم‬ ‫موقع‬
‫ا‬‫لسعر‬
‫الطعام‬ ‫جودة‬
‫الخدمة‬ ‫جودة‬
‫المنتج‬ ‫جودة‬ ‫ثبات‬
‫العام‬ ‫الجو‬
‫الترويجية‬ ‫األنشطة‬
9.‫مطاعمكم؟‬ ‫سالسل‬ ‫في‬ ‫العمالة‬ ‫دوران‬ ‫معدل‬ ‫ما‬
11.‫هي‬ ‫ما‬‫أ‬‫ال‬ ‫ستراتيجية‬‫العمالة‬ ‫دوران‬ ‫معدل‬ ‫لتقليل‬ ‫منشأة‬‫مطاعمكم؟‬ ‫سالسل‬ ‫في‬
11.‫التدريب‬ ‫لمستوي‬ ‫تقييمك‬ ‫هو‬ ‫ما‬‫سال‬ ‫في‬‫مطاعمكم؟‬ ‫سل‬
‫أ‬)‫جيد‬
‫ب‬)‫متوسط‬
‫ج‬)‫ضعيف‬
12.‫وما‬‫مطاعمكم؟‬ ‫سالسل‬ ‫في‬ ‫التدريب‬ ‫استراتيجية‬ ‫هي‬
162
13.‫التسويقية‬ ‫للخطط‬ ‫تقييمك‬ ‫هو‬ ‫ما‬‫مطاعمكم‬ ‫سالسل‬ ‫في‬‫؟‬
‫أ‬)‫جيد‬
‫ب‬)‫متوسط‬
‫ج‬)‫ضعيف‬
‫اشرح‬:-
14.‫الجودة‬ ‫لمستوي‬ ‫تقييمك‬ ‫ما‬‫مطاعمكم‬ ‫سالسل‬ ‫في‬‫؟‬
‫أ‬)‫جيد‬
‫ب‬)‫متوسط‬
‫ج‬)‫ضعيف‬
15.‫استراتيجية‬ ‫هي‬ ‫وما‬‫تطوير‬‫مطاعمكم؟‬ ‫سلسلة‬ ‫في‬ ‫الجودة‬
16.‫مطاعمكم؟‬ ‫سالسل‬ ‫في‬ ‫العمالء‬ ‫الحتياجات‬ ‫تبعا‬ ‫المنتج‬ ‫تطوير‬ ‫مدي‬ ‫ما‬
‫أ‬)‫جيد‬
‫ب‬)‫متوسط‬
‫ج‬)‫ضعيف‬
‫اشرح‬:-
17.‫سالسل‬ ‫في‬ ‫المستخدمة‬ ‫العمالء‬ ‫رضاء‬ ‫قياس‬ ‫طرق‬ ‫هي‬ ‫ما‬
‫مطاعمكم؟‬
18.‫سالسل‬ ‫بها‬ ‫تمتاز‬ ‫التي‬ ‫والضعف‬ ‫القوة‬ ‫نقاط‬ ‫هي‬ ‫ما‬
‫ال‬‫مطاعم‬‫المحلية‬‫؟‬
19.‫لسالسل‬ ‫بالنسبة‬ ‫والتهديدات‬ ‫الفرص‬ ‫هي‬ ‫ما‬‫ال‬‫مطاعم‬‫المحلية‬‫؟‬
163
APPENDIX (A3)
Checklist Form
164
Checklist
This checklist,s measure is covering quality, service, cleanliness,
atmosphere, staff and management performance.
Visit date
/ / 200
Restaurant name:-
Restaurant area:-
N/A means (Not available)
NANoyes1- Exterior
Parking lot/ landscape/ planters/ adjoining
property litter free.
1
Parking lot in good repair (no potholes;
bumpers unbroken).
2
Trash area grease free; doors, dumpster,
grease receptacle lids closed; clean and in
good repair.
3
All exterior signs clean; good repair;
working.
4
All sidewalks clean (free of gum or
stains; litter free)
5
Building and lot lights in good repair.6
Building walls/awnings/doors in good
repair not needing painting clean.
7
8
Total
165
2-Interior
NANoyes2-1 Entryway/lobby
Entrance doors clean; glass clean; doors shut
properly.
1
Wet floor signs clean; in good repair.2
Menu boards clean, lights working, translates
clean.
3
Walls clean, in good repair4
Vents clean, in good repair5
Ceiling tiles clean, in good repair, lighting in
good repair, clean.
6
7
Total
2-2 Dining Room
Tables clean; in good repair.1
Dining room chairs clean; free of food debris,
in good repair.
2
Ashtrays clean and available.3
Dining room doors clean; open smoothly;
Exit signs lit (if electric).
4
Walls are clean; in good repair.5
All wall décor and plants clean.6
Windows, window ledges and glass dividers;
in good repair.
7
Trash cans clean, not overflowing; trays not
stacked up; in good repair.
8
All lights working, light covers clean.9
Ceiling and ceiling tiles clean; in good repair.10
Air vents free of dust/build up; in good
repair.
11
Tables being cleaned regularly.12
Temperature is comfortable.13
Dining room music is on; volume level
allows normal conversation.
14
166
15
16
Total
3-Food quality
3-1 Product ingredients/temperatures-cooks line
Products on cooks line/dress station fresh;
condiments not mixed with each other, not
over stocked.
1
Lettuce and tomatoes prepared and held
properly, fresh appearance.
2
Onions prepared and held properly, covered,
fresh appearance.
3
Tongs used to handle cooked meat patties.4
5
6
7
8
Total
NANoyes3-2 Food quality standards
Fries cooked in proper fry basket.1
All bread products within code date.2
All meat products within code date.3
All produce within code date.4
All dairy products within code date.5
All prepared or open product properly
covered.
6
Thaw/tempering chart posted and use.7
All thawed/tempered items are properly
thawed and controlled.
8
French fries salted; hot, fresh, not greasy,
within hold time.
9
Kids meals hot, fresh, not greasy, within
hold time.
10
All fried products properly prepared and11
167
portioned.
Dessert fresh within hold time.12
Chicken fillet portions cooked in proper fry
basket.
13
Chicken fillet portions maintained at
Proper temp. (150? min.).
14
Tongs used to handle cooked chicken
product.
15
Safety materials available, in good repair, in
use.
16
Hand sink are available clean, there are soap,
sanitizer, and drier.
17
Measuring scales are available, in good
repair, in use.
18
Sanitizer are available, in exact concentrate,
in use.
19
20
21
22
Total
NANoyes3-3 Beverage and front line dispensers
Soft drinks filled1/4" from top; lidded and
marked.
1
Dispenser is functional; wiped clean of
soda splashes spills.
2
Ice scoop used to portion, cup never touch
the ice, stored scoop handle not touching ice.
3
Coffee or tea filled 1/4" from top; served
fresh; proper temperature.
4
Condiments, straws, stir sticks stoked; rack
and pans clean.
5
Counter area and equipment surfaces clean,
polished and in good repair.
6
Floors and counters free of trash or spills.7
8
9
Total
168
4- Guest service
NANoyes4-1 Service quality
Employees present to great the guest
immediately with a smile and friendly
Greeting.
1
Employees are making good eye contact.2
Employees have good posture, standing up
straight, not leaning. Looking their best.
3
Appropriate suggestive selling occurs(up
sell, add drinks, etc).
4
The order is repeated back to the guest,
when appropriate
5
Proper money handling procedures are
followed.
6
Employees say thank you to each guest.7
Receipt given with pick up/delivery
instructions.
8
"to go" orders are properly packaged with
courteous delivery.
9
Guest receive the exact items ordered10
Team work on the front line evident11
Hustle, sense of urgency, efficient
motion/speed shown on front line.
12
Back line station communication evident;
directing, acknowledgement.
13
Back line hustle shown, urgency efficient
motion/speed shown
14
Backline station is coordinated, teamwork;
hospitality shown.
15
Back line station prepared, properly stocked16
Employees knowledgeable well trained.17
Cash machine, or visa card machine are
available, in use as needed.
18
19
Total
169
4-2 Service times – must score all 5 (no NAs) 5
minutes or less = yes, over 5 minutes = no
Guest 11
Guest 22
Guest 33
Guest 44
Guest 55
Guest 66
Guest 77
Guest 88
Guest 99
Guest 1010
Total
NANoyes5- Employee/Management appearance
Employees refrain from chewing gum, eating,
and drinking while on duty.
1
All employees are wearing approved uniform.2
Uniform is clean; free of wrinkles; properly
fitted; in good repair.
3
Aprons are clean; in good repair.4
Name badges are worn and name legible.5
Employees wearing hat at all times.6
Shoes are dark in colored leather; non-skid.7
Hair is neat, confined-above collar, away
from face, off shoulders.
8
Hand are washed frequently per sanitation
standards.
9
Male employees are clean shaven; mustaches
are neatly trimmed.
10
Female nail polish; clean; not chipped; light
color; no false nails/decals
11
Jewelry meets standard12
Management is wearing a clean, pressed,
approved uniform.
13
Management displays a professional image.14
Management name badge is worn and name15
171
is legible.
Management shoes are dark, polished non-
skid.
16
17
Total
6- Management behaviors/functions
Management is visible.1
Management is directing crew.2
Management is setting the hospitality
standard.
3
Training materials are current, posted and
used.
4
Proper security standards are followed –
office door, back door.
5
Safety/accident prevention program in place.6
First aid cabinet is available, equipped, in use.7
Shift readiness/food quality checklist
completed and posted.
8
Communication board posted and used.9
Manager's office neat and organized.10
Employee break area is neat, clean and
organized.
11
12
Total
171
SCORE SHEET
(=)
total
points
(*)
weight
factor
Rating%
(Y/Adjusted)
(=)
Adjusted
possible
(-)
NA
points
Total
possible
Measured area
0.1081- Exterior
0.10232- Interior
0.30393- Food quality
0.30294- Guest service
0.10175-Employee
appearance
0.10126-Managament
functions
Over all score
Rating scale
(92-100)Excellent
(86<92)Very good
(80<86)Good
(72<80)Acceptable
(below 72)Fair
Comments:-
172
ARABIC SUMMARY
173
‫العربي‬ ‫الملخص‬
174
‫مقارنة‬ ‫المحلية‬ ‫المطاعم‬ ‫سالسل‬ ‫تجربة‬ ‫تقييم‬‫بالسالسل‬‫مصر‬ ‫في‬ ‫العالمية‬
‫ردة‬‫ر‬‫المتح‬ ‫رات‬‫ر‬‫الوالي‬ ‫رن‬‫ر‬‫م‬ ‫رة‬‫ر‬‫بداي‬ ‫رريعة‬‫ر‬‫الس‬ ‫رات‬‫ر‬‫الوجب‬ ‫راعم‬‫ر‬‫مط‬ ‫رل‬‫ر‬‫سالس‬ ‫ررة‬‫ر‬‫األخي‬ ‫رة‬‫ر‬‫ون‬ ‫ا‬ ‫ري‬‫ر‬‫ف‬ ‫ررت‬‫ر‬‫انتش‬
‫ا‬‫العالم‬ ‫أنحاء‬ ‫كافة‬ ‫والي‬ ‫ألمريكية‬‫منها‬ ‫العناصر‬ ‫من‬ ‫مجموعة‬ ‫علي‬ ‫نجاحها‬ ‫في‬ ‫معتمدة‬:-
‫النظافة‬-‫الخدمة‬ ‫جودة‬-‫للسعر‬ ‫بالنسبة‬ ‫القيمة‬-‫العام‬ ‫الجو‬(‫ديكور‬-‫ا‬‫ضائة‬-‫موسيقي‬)-‫الموقرع‬
-‫الخدمة‬ ‫سرعة‬.
‫وكروك‬ ‫ووصاية‬ ‫مؤمن‬ ‫مثل‬ ‫محلي‬ ‫بعضها‬ ‫السريعة‬ ‫الوجبات‬ ‫مطاعم‬ ‫من‬ ‫العديد‬ ‫مصر‬ ‫في‬ ‫يوجد‬
‫وفلفلة‬ ‫وجادو‬ ‫ومكاني‬ ‫دور‬,‫كير‬ ‫برجر‬ ‫و‬ ‫ماكدونالدز‬ ‫مثل‬ ‫عالمي‬ ‫والبعض‬‫وكنتراكي‬ ‫وهرارديز‬ ‫نج‬,
‫السال‬ ‫منافسة‬ ‫إلي‬ ‫المحلية‬ ‫السالسل‬ ‫وتسعي‬‫واأل‬ ‫الجرودة‬ ‫مسرتوي‬ ‫فري‬ ‫العالمية‬ ‫سل‬‫األنحراء‬ ‫فري‬ ‫نتشرار‬
‫حسنة‬ ‫سمعة‬ ‫وتحقيق‬ ‫واألجنبية‬ ‫العربية‬.
‫مشكلة‬‫الدراسة‬
‫االتي‬ ‫الدراسة‬ ‫مشكلة‬ ‫تشمل‬:
1.‫ريم‬‫ر‬‫تقي‬‫رتو‬‫ر‬‫مس‬‫رة‬‫ر‬‫المقدم‬ ‫رودة‬‫ر‬‫الج‬‫رو‬‫ر‬‫الج‬ ‫رتوي‬‫ر‬‫بمس‬ ‫رة‬‫ر‬‫مقارن‬ ‫رة‬‫ر‬‫المحلي‬ ‫راعم‬‫ر‬‫المط‬ ‫رل‬‫ر‬‫سالس‬ ‫ري‬‫ر‬‫ف‬‫دة‬
‫المقدم‬‫ة‬‫العالمية‬ ‫السالسل‬ ‫في‬.
2.‫تدعيم‬ ‫الي‬ ‫تحتاج‬ ‫التي‬ ‫النقاط‬ ‫دراسة‬‫س‬ ‫في‬‫المحلية‬ ‫المطاعم‬ ‫السل‬.
3.‫رث‬‫ر‬‫حي‬ ‫رن‬‫ر‬‫م‬ ‫ره‬‫ر‬‫المحلي‬ ‫راعم‬‫ر‬‫المط‬ ‫رل‬‫ر‬‫سالس‬ ‫رتوي‬‫ر‬‫مس‬ ‫ريم‬‫ر‬‫تقي‬(‫رم‬‫ر‬‫المطع‬ ‫رهرة‬‫ر‬‫ش‬-‫رم‬‫ر‬‫المطع‬ ‫رع‬‫ر‬‫موق‬–
‫االسعار‬-‫الجودة‬ ‫مستوي‬-‫الطعرام‬ ‫جودة‬-‫الخدمرة‬ ‫جرودة‬-‫المنرتج‬ ‫جرودة‬ ‫ثبرات‬-‫الجرو‬
‫العام‬-‫ا‬‫أل‬‫نشطة‬‫الترويجية‬-‫الغذائية‬ ‫بالقيمة‬ ‫االهتمام‬.)
4.‫تغيرات‬ ‫مع‬ ‫المطاعم‬ ‫سالسل‬ ‫تتعامل‬ ‫كيف‬‫السوق‬.
‫أهداف‬‫الدراسة‬
‫تتمثل‬‫أ‬‫االتي‬ ‫في‬ ‫الدراسة‬ ‫هداف‬:
1.‫مص‬ ‫في‬ ‫بالعالمية‬ ‫مقارنة‬ ‫المحلية‬ ‫المطاعم‬ ‫سالسل‬ ‫تجربة‬ ‫تقييم‬‫ر‬.
2.‫المحلية‬ ‫المطاعم‬ ‫سالسل‬ ‫لتطوير‬ ‫الالزمة‬ ‫النقاط‬ ‫تحديد‬.
3.‫مدي‬ ‫تقييم‬‫مرونة‬‫س‬‫مع‬ ‫ليتالئم‬ ‫المنتج‬ ‫تطوير‬ ‫في‬ ‫المطاعم‬ ‫السل‬‫المحلي‬ ‫الذوق‬.
175
‫االول‬ ‫الفصل‬:‫المقدمة‬
‫الدراسرة‬ ‫موضوع‬ ‫عن‬ ‫عامة‬ ‫مقدمة‬ ‫الفصل‬ ‫هذا‬ ‫يتضمن‬,‫أ‬‫بعادهرا‬,‫هيكلهرا‬,‫مجموعرة‬
‫ا‬ ‫من‬‫أل‬‫تم‬ ‫التي‬ ‫ختصارات‬‫أ‬‫المختلفة‬ ‫الفصول‬ ‫في‬ ‫ستعراضها‬,‫الجزء‬ ‫هذا‬ ‫تناول‬ ‫ذلك‬ ‫علي‬ ‫عالوة‬
‫و‬ ‫الدراسة‬ ‫محددات‬‫أ‬‫ه‬‫ميتها‬.
‫الثاني‬ ‫الفصل‬:‫المرجعية‬ ‫الدراسات‬
‫وا‬ ‫ررات‬‫ر‬‫الدراس‬ ‫ررتعراض‬‫ر‬‫باس‬ ‫ررل‬‫ر‬‫الفص‬ ‫ررذا‬‫ر‬‫ه‬ ‫ررتذ‬‫ر‬‫يخ‬‫أل‬‫رروع‬‫ر‬‫بموض‬ ‫ررة‬‫ر‬‫المتعلق‬ ‫ررابقة‬‫ر‬‫الس‬ ‫ررال‬‫ر‬‫بح‬
‫الدراسة‬,‫ثالثة‬ ‫ويتضمن‬‫أ‬‫جزاء‬‫أ‬‫ساسية‬:‫ا‬ ‫الجزء‬‫أل‬‫مطراعم‬ ‫علري‬ ‫عامرة‬ ‫نظررة‬ ‫بالقراء‬ ‫يتعلرق‬ ‫ول‬
‫السريعة‬ ‫الوجبات‬,‫والخ‬ ‫االغذيرة‬ ‫جرودة‬ ‫علري‬ ‫ركرز‬ ‫فقد‬ ‫الثاني‬ ‫الجزء‬ ‫أما‬‫هرذا‬ ‫تعررض‬ ‫كمرا‬ ‫دمرة‬
‫و‬ ‫الجودة‬ ‫لمفهوم‬ ‫الجزء‬‫أ‬‫وجودة‬ ‫الجودة‬ ‫دارة‬‫الخدمة‬ ‫و‬ ‫الغذاء‬ ‫و‬ ‫المنتج‬ ‫من‬ ‫كل‬.‫و‬‫أ‬‫يوضح‬ ‫خيرا‬
‫السريعة‬ ‫الوجبات‬ ‫مطاعم‬ ‫في‬ ‫المنافسة‬ ‫عناصر‬ ‫الثالث‬ ‫الجزء‬.
‫للدراسة‬ ‫المنهجي‬ ‫االطار‬ ‫الثالث‬ ‫الفصل‬
‫تحديد‬ ‫علي‬ ‫الفصل‬ ‫هذا‬ ‫ويحتوي‬‫الدراس‬ ‫مجتمع‬ ‫و‬ ‫الدراسة‬ ‫منهج‬‫و‬ ‫ة‬‫أ‬‫البيانرات‬ ‫جمع‬ ‫داة‬
‫كاالتي‬ ‫وهي‬:-
1.‫الدراسة‬ ‫منهج‬
‫أ‬‫علري‬ ‫االجابرة‬ ‫يتم‬ ‫بحيث‬ ‫المسحي‬ ‫الوصفي‬ ‫المنهج‬ ‫الدراسة‬ ‫هذه‬ ‫في‬ ‫تبع‬‫أ‬‫الردار‬ ‫سرللة‬
‫خالل‬ ‫من‬‫أ‬‫سالسرل‬ ‫لتجربرة‬ ‫تقييمهرا‬ ‫مسرتوي‬ ‫علري‬ ‫للتعرف‬ ‫المجتمع‬ ‫عينة‬ ‫اراء‬ ‫ستطالع‬
‫مصر‬ ‫في‬ ‫بالعالمية‬ ‫مقارنة‬ ‫المحلية‬ ‫المطاعم‬.
‫ا‬ ‫الدراسة‬ ‫لجاءت‬‫الخاصرة‬ ‫البيانرات‬ ‫جمرع‬ ‫يرتم‬ ‫خاللها‬ ‫من‬ ‫والتي‬ ‫الشخصية‬ ‫المقابالت‬ ‫لي‬
‫صورة‬ ‫في‬ ‫وذلك‬ ‫التجربة‬ ‫بتقييم‬‫أ‬‫والسالسل‬ ‫المطاعم‬ ‫مديرو‬ ‫عليها‬ ‫يجيب‬ ‫سللة‬.
‫أ‬‫ري‬‫ر‬‫عل‬ ‫رة‬‫ر‬‫الدراس‬ ‫رتندت‬‫ر‬‫س‬‫أ‬‫رذ‬‫ر‬‫للفح‬ ‫رة‬‫ر‬‫قائم‬ ‫رالل‬‫ر‬‫خ‬ ‫رن‬‫ر‬‫م‬ ‫رك‬‫ر‬‫وذل‬ ‫رية‬‫ر‬‫الشخص‬ ‫رة‬‫ر‬‫المالحظ‬ ‫رلوب‬‫ر‬‫س‬
‫رو‬‫ر‬‫والج‬ ‫رة‬‫ر‬‫والنظاف‬ ‫رام‬‫ر‬‫الطع‬ ‫رودة‬‫ر‬‫وج‬ ‫رة‬‫ر‬‫الخدم‬ ‫رودة‬‫ر‬‫ج‬ ‫رر‬‫ر‬‫عناص‬ ‫ري‬‫ر‬‫عل‬ ‫ريم‬‫ر‬‫والتقي‬‫رتوي‬‫ر‬‫ومس‬ ‫رام‬‫ر‬‫الع‬
‫و‬ ‫الخدمة‬‫أ‬‫المطراعم‬ ‫سالسرل‬ ‫تجربرة‬ ‫لتقيريم‬ ‫وذلرك‬ ‫المطاعم‬ ‫داخل‬ ‫والمديرين‬ ‫العاملين‬ ‫داء‬
‫مصر‬ ‫في‬ ‫بالعالمية‬ ‫مقارنة‬ ‫المحلية‬.
176
‫الدراسة‬ ‫مجتمع‬
‫من‬ ‫الدراسة‬ ‫مجتمع‬ ‫يتكون‬:
‫ردارها‬‫ر‬‫مق‬ ‫رائيا‬‫ر‬‫احص‬ ‫ربة‬‫ر‬‫مناس‬ ‫روائية‬‫ر‬‫عش‬ ‫رة‬‫ر‬‫عين‬ ‫رذ‬‫ر‬‫باخ‬ ‫رث‬‫ر‬‫الباح‬ ‫رام‬‫ر‬‫ق‬1511‫رل‬‫ر‬‫عمي‬‫رالء‬‫ر‬‫عم‬ ‫رن‬‫ر‬‫م‬
‫ال‬ ‫الوجبات‬ ‫مطاعم‬‫سريعة‬‫ب‬‫الشيخ‬ ‫شرم‬.
‫قام‬‫ت‬‫الدراسة‬‫مقدارها‬ ‫عينة‬ ‫باخذ‬44‫من‬ ‫مدير‬‫والسالسر‬ ‫المطراعم‬ ‫مديري‬‫الموجرودة‬ ‫ل‬
‫الشيخ‬ ‫شرم‬ ‫في‬.
‫تم‬‫أ‬‫مقدارها‬ ‫عشوائية‬ ‫عينة‬ ‫خذ‬12‫مطعم‬‫من‬‫مطاعم‬‫الشيخ‬ ‫شرم‬.
‫أ‬‫البيانات‬ ‫جمع‬ ‫داة‬
‫أ‬‫عتمد‬‫ت‬‫الدراسة‬‫ا‬ ‫علي‬‫أل‬‫بعرد‬ ‫سرتبيان‬‫أ‬‫بق‬ ‫العالقرة‬ ‫ذات‬ ‫النقراط‬ ‫مرن‬ ‫مجموعرة‬ ‫ضرافة‬‫طراع‬
‫راعم‬‫ر‬‫المط‬.‫رميم‬‫ر‬‫تص‬ ‫رم‬‫ر‬‫ت‬ ‫رد‬‫ر‬‫وق‬‫أ‬‫رتمارة‬‫ر‬‫س‬‫أ‬‫راعم‬‫ر‬‫المط‬ ‫رل‬‫ر‬‫سالس‬ ‫رة‬‫ر‬‫تجرب‬ ‫ريم‬‫ر‬‫بتقي‬ ‫رة‬‫ر‬‫خاص‬ ‫راء‬‫ر‬‫ستقص‬
‫رواد‬ ‫علري‬ ‫ووزعرت‬ ‫سرؤاال‬ ‫عشرر‬ ‫احردي‬ ‫من‬ ‫تتكون‬ ‫مصر‬ ‫في‬ ‫بالعالمية‬ ‫مقارنة‬ ‫المحلية‬
‫رع‬‫ر‬‫توزي‬ ‫رم‬‫ر‬‫ت‬ ‫رث‬‫ر‬‫حي‬ ‫راعم‬‫ر‬‫المط‬ ‫رذه‬‫ر‬‫ه‬1511‫أ‬‫رتمارة‬‫ر‬‫س‬‫أ‬‫ري‬‫ر‬‫عل‬ ‫را‬‫ر‬‫منه‬ ‫رب‬‫ر‬‫جي‬1248‫أ‬‫رتمارة‬‫ر‬‫س‬‫أ‬‫ي‬
‫بنسرربة‬83%‫مررن‬‫أ‬‫االسررتمارات‬ ‫رردد‬‫ر‬‫ع‬ ‫جمررالي‬.‫ررد‬‫ر‬‫وق‬ ‫هررذا‬‫أ‬‫سررتخدم‬‫ت‬‫الدراسررة‬‫ررامج‬‫ر‬‫برن‬
SPSS‫النتائج‬ ‫الي‬ ‫والوصول‬ ‫االستبيان‬ ‫لتحليل‬.
‫كما‬‫أ‬‫عتمد‬‫ت‬‫الدراسة‬‫بعرد‬ ‫الشخصرية‬ ‫المقرابالت‬ ‫علي‬‫أ‬‫ذات‬ ‫النقراط‬ ‫مرن‬ ‫مجموعرة‬ ‫ضرافة‬
‫المطراعم‬ ‫بقطاع‬ ‫العالقة‬.‫تجربرة‬ ‫بتقيريم‬ ‫خاصرة‬ ‫شخصرية‬ ‫مقابلرة‬ ‫نمروذج‬ ‫تصرميم‬ ‫ترم‬ ‫وقرد‬
‫في‬ ‫بالعالمية‬ ‫مقارنة‬ ‫المحلية‬ ‫المطاعم‬ ‫سالسل‬‫مصر‬‫م‬‫وقرد‬ ‫سرؤاال‬ ‫عشرر‬ ‫تسرعة‬ ‫من‬ ‫كونة‬
‫حاول‬‫ت‬‫الدراسة‬‫عمل‬44‫ترم‬ ‫وقرد‬ ‫المطراعم‬ ‫مديري‬ ‫مع‬ ‫شخصية‬ ‫مقابلة‬‫أ‬‫تمرام‬36‫منهرا‬
‫أ‬‫ي‬‫نسب‬‫ة‬81.8%‫من‬‫أ‬‫عدد‬ ‫جمالي‬‫وقد‬ ‫هذا‬ ‫المقابالت‬‫أ‬‫برنرامج‬ ‫الباحث‬ ‫ستخدم‬SPSS
‫ا‬ ‫لتحليل‬‫أل‬‫النتائج‬ ‫الي‬ ‫والوصول‬ ‫ستبيان‬.
‫وكذلك‬‫أ‬‫عتمد‬‫ت‬‫الدراسة‬‫الش‬ ‫المالحظة‬ ‫علي‬‫علري‬ ‫للتشييك‬ ‫قائمة‬ ‫خالل‬ ‫من‬ ‫وذلك‬ ‫خصية‬
‫و‬ ‫رة‬‫ر‬‫الخدم‬ ‫رتوي‬‫ر‬‫ومس‬ ‫رام‬‫ر‬‫الع‬ ‫رو‬‫ر‬‫والج‬ ‫رة‬‫ر‬‫والنظاف‬ ‫رام‬‫ر‬‫الطع‬ ‫رودة‬‫ر‬‫وج‬ ‫رة‬‫ر‬‫الخدم‬ ‫رودة‬‫ر‬‫ج‬ ‫رر‬‫ر‬‫عناص‬‫أ‬‫داء‬
‫راعم‬‫ر‬‫المط‬ ‫رل‬‫ر‬‫داخ‬ ‫رديرين‬‫ر‬‫والم‬ ‫راملين‬‫ر‬‫الع‬.‫ر‬‫ر‬‫قام‬ ‫رد‬‫ر‬‫وق‬‫ت‬‫رة‬‫ر‬‫الدراس‬‫ردد‬‫ر‬‫لع‬ ‫ريم‬‫ر‬‫تقي‬ ‫رل‬‫ر‬‫بعم‬12‫رم‬‫ر‬‫مطع‬
‫كالتالي‬ ‫موزعة‬4‫و‬ ‫مستقلة‬ ‫مطاعم‬4‫و‬ ‫المختلفرة‬ ‫المحليرة‬ ‫المطاعم‬ ‫سالسل‬ ‫من‬ ‫مطاعم‬
4‫العالمية‬ ‫المطاعم‬ ‫سالسل‬ ‫من‬ ‫مطاعم‬.
177
‫الرابع‬ ‫الفصل‬:‫والمناقشة‬ ‫النتائج‬
‫رم‬‫ر‬‫ت‬ ‫رل‬‫ر‬‫الفص‬ ‫رذا‬‫ر‬‫ه‬ ‫ري‬‫ر‬‫ف‬‫أ‬‫رة‬‫ر‬‫الدراس‬ ‫ري‬‫ر‬‫ف‬ ‫را‬‫ر‬‫اليه‬ ‫رل‬‫ر‬‫التوص‬ ‫رم‬‫ر‬‫ت‬ ‫ري‬‫ر‬‫الت‬ ‫رائج‬‫ر‬‫النت‬ ‫رل‬‫ر‬‫وتحلي‬ ‫رتعراض‬‫ر‬‫س‬
‫الميدانية‬, ,‫خالل‬ ‫من‬ ‫وذلك‬‫أ‬‫ا‬ ‫ستمارة‬‫أل‬‫الشخصية‬ ‫المالحظة‬ ‫و‬ ‫الشخصية‬ ‫والمقابالت‬ ‫ستقصاء‬,
‫الدراسرة‬ ‫انتهرت‬ ‫وقد‬ ‫هذا‬‫خرالل‬ ‫مرن‬‫أ‬‫ا‬ ‫تباعهرا‬‫أل‬‫سالسرل‬ ‫تجربرة‬ ‫وتقيريم‬ ‫بحرث‬ ‫فري‬ ‫العلمري‬ ‫سرلوب‬
‫النتائج‬ ‫من‬ ‫مجموعة‬ ‫الي‬ ‫الدراسة‬ ‫محل‬ ‫المجتمع‬ ‫في‬ ‫بالعالمية‬ ‫مقارنة‬ ‫المحلية‬ ‫المطاعم‬,‫أ‬‫همها‬:-
1.‫من‬ ‫كل‬ ‫مستوي‬ ‫تقييم‬‫سالسل‬‫المطاعم‬‫و‬ ‫المحلية‬‫العالمية‬‫الجودة‬ ‫خواص‬ ‫حيث‬ ‫من‬
)‫االتية‬ ‫العناصر‬‫مرتبة‬‫من‬1-5‫تبعا‬‫للمستوي‬)
12345
‫أ‬‫قل‬‫مستوي‬‫أ‬‫مستوي‬ ‫علي‬
‫الخاصية‬‫اراءالعمالء‬‫المديرين‬ ‫اراء‬
‫محلي‬‫عالمي‬‫الفارق‬‫محلي‬‫عالمي‬‫الفارق‬
‫المطعم‬ ‫شهرة‬3.64.2-1.4‫محلي‬‫عالمي‬‫الفارق‬
‫المطعم‬ ‫موقع‬3.64.1-1.54.35-1.7
‫ا‬‫أل‬‫سعار‬3.73.41.34.14.7-1.6
‫الطعام‬ ‫جودة‬3.94.2-1.34.33.11.2
‫الخدمة‬ ‫جودة‬3.64-1.44.44.21.2
‫المنتج‬ ‫جودة‬ ‫ثبات‬3.64-1.44.14.3-1.3
‫العام‬ ‫الجو‬3.13.8-1.73.84.4-1.6
‫ا‬‫أل‬‫الترويجية‬ ‫نشطة‬2.93.8-1.93.94.3-1.4
2.‫ال‬ ‫تحديد‬‫لتطوير‬ ‫الالزمة‬ ‫نقاط‬‫المحلية‬ ‫المطاعم‬ ‫سالسل‬.
3.‫يذوق‬‫ي‬‫ال‬ ‫يع‬‫ي‬‫م‬ ‫يتالئم‬‫ي‬‫لي‬ ‫يتج‬‫ي‬‫المن‬ ‫يوير‬‫ي‬‫تط‬ ‫يي‬‫ي‬‫ف‬ ‫ية‬‫ي‬‫العالمي‬ ‫ياعم‬‫ي‬‫المط‬ ‫يل‬‫ي‬‫سالس‬ ‫ية‬‫ي‬‫مرون‬ ‫يدي‬‫ي‬‫م‬ ‫ييم‬‫ي‬‫تقي‬
‫المحلي‬.
178
‫ر‬‫أ‬‫العمالء‬ ‫ي‬‫أ‬‫نها‬:-‫أ‬‫منه‬-‫ثقة‬ ‫مصدر‬–‫نظيفة‬–‫جيرد‬ ‫ترويج‬–‫أ‬‫قروي‬ ‫شرهرة‬ ‫سرم‬
–‫باستمرار‬ ‫جديدة‬ ‫منتجات‬-‫الطعام‬ ‫جودة‬–‫الخدمة‬ ‫جودة‬–‫أ‬‫ختيا‬‫مميرز‬ ‫موقرع‬ ‫ر‬
–‫المستوي‬ ‫عالية‬ ‫جودة‬–‫الخدمة‬ ‫سرعة‬–‫جيد‬ ‫العام‬ ‫الجو‬–‫مناسب‬ ‫سعر‬.
‫ا‬ ‫مثل‬ ‫بالشباب‬ ‫خاصة‬ ‫خدمات‬ ‫توفير‬‫أل‬‫و‬ ‫نترنت‬‫ال‬‫التلفزيون‬ ‫قنوات‬‫الجذابة‬ ‫ية‬
‫ا‬‫أل‬‫خرردمات‬ ‫بوجررود‬ ‫هتمررام‬‫لرر‬‫أل‬‫اطفررال‬(‫منطقررة‬‫أ‬‫ل‬‫عرراب‬–‫وجبررات‬‫أ‬‫طفررال‬–‫هرردايا‬
‫ل‬‫أل‬‫طفال‬).
‫ا‬‫أل‬‫بوجود‬ ‫هتمام‬‫أ‬‫الرذوق‬ ‫تناسرب‬ ‫صناف‬‫مثرل‬ ‫المصرري‬(‫ال‬‫طعميرة‬-‫الشراورما‬–
‫الكفتة‬).
‫مثل‬ ‫االزمات‬ ‫مع‬ ‫الجيد‬ ‫التعامل‬(‫أ‬‫والمقاطعة‬ ‫البقر‬ ‫جنون‬ ‫زمة‬‫و‬‫أ‬‫الطيور‬ ‫نفلونزا‬).
‫االحتفاالت‬ ‫في‬ ‫بالمشاركة‬ ‫واالهتمام‬ ‫والتقاليد‬ ‫العادات‬ ‫مراعاة‬.
‫الديني‬ ‫الجانب‬ ‫مراعاة‬(‫عدم‬‫أ‬‫الخنزير‬ ‫لحم‬ ‫ستخدام‬‫أ‬‫المسلم‬ ‫البالد‬ ‫في‬ ‫الخمور‬ ‫و‬‫ة‬.)
‫أ‬‫ستخدام‬‫المحلية‬ ‫العمالة‬.
‫والتوصيات‬ ‫الملخص‬ ‫الخامس‬ ‫الفصل‬:
‫أ‬‫علي‬ ‫رتكازا‬‫ترم‬ ‫التري‬ ‫المراجرع‬‫أ‬‫الري‬ ‫التوصرل‬ ‫ترم‬ ‫فقرد‬ ‫الميرداني‬ ‫البحرث‬ ‫ونترائج‬ ‫ستعراضرها‬
‫كاالتي‬ ‫وهي‬ ‫واالقتراحات‬ ‫التوصيات‬ ‫من‬ ‫مجموعة‬:
1.‫وضع‬‫ا‬‫النواحي‬ ‫كافة‬ ‫في‬ ‫البشري‬ ‫العنصر‬ ‫لتطوير‬ ‫فعالة‬ ‫سترتيجية‬.
‫ا‬‫أل‬‫ال‬ ‫ختيار‬‫البشري‬ ‫للعنصر‬ ‫جيد‬(‫يجب‬ ‫حيث‬‫أ‬‫الكفاءة‬ ‫البشري‬ ‫العنصر‬ ‫في‬ ‫يتوفر‬ ‫ن‬
‫والرغبة‬.)
‫العمالة‬ ‫علي‬ ‫الضغط‬ ‫لتجنب‬ ‫الكافية‬ ‫العمالة‬ ‫توفير‬ ‫يجب‬.
‫و‬ ‫راتب‬ ‫توفير‬‫أ‬‫و‬ ‫قامة‬‫أ‬‫جيدة‬ ‫نتقاالت‬.
‫ا‬‫أل‬‫مثل‬ ‫التحفيزية‬ ‫باالنشطة‬ ‫هتمام‬(‫المثالي‬ ‫الموظف‬–‫أ‬‫المريالد‬ ‫عيراد‬–‫ا‬‫أل‬‫حتفراالت‬
‫بالنجاح‬–‫المناسبات‬–‫ج‬‫الشكر‬ ‫وابات‬–‫المعايدة‬ ‫كروت‬-‫حوافز‬-‫مكافآت‬.)
‫وضوح‬‫أ‬‫تحقيرق‬ ‫فري‬ ‫بردوره‬ ‫فررد‬ ‫كرل‬ ‫ودرايرة‬ ‫العمرل‬ ‫لفريق‬ ‫المنشأة‬ ‫وخطط‬ ‫هداف‬
‫ا‬ ‫هذه‬‫أل‬‫هداف‬.
2.‫ا‬ ‫من‬ ‫مزيد‬‫أل‬‫هتمام‬‫والنظافة‬ ‫الصحية‬ ‫بالنواحي‬.
‫ا‬ ‫لضرورة‬ ‫العاملين‬ ‫وعي‬ ‫زيادة‬‫أل‬‫الصحية‬ ‫بالنواحي‬ ‫هتمام‬.
‫ا‬‫أل‬‫بوجود‬ ‫هتمام‬‫أ‬‫لغسريل‬ ‫مخصصة‬ ‫حواض‬‫وصرابون‬ ‫وبرارده‬ ‫سراخنه‬ ‫ميراه‬ ‫بهرا‬ ‫اليرد‬
‫ومطهر‬ ‫ومجفف‬.
‫وعدم‬ ‫للعاملين‬ ‫مستقل‬ ‫حمام‬ ‫وجود‬ ‫يجب‬‫أ‬‫بالعميل‬ ‫الخاص‬ ‫الحمام‬ ‫ستخدام‬.
‫الشخصية‬ ‫النظافة‬ ‫متابعة‬(‫االظافر‬ ‫وقذ‬ ‫الشعر‬ ‫و‬ ‫الذقن‬ ‫حالقة‬.)
179
‫التدخين‬ ‫منع‬‫أ‬‫في‬ ‫و‬ ‫العمل‬ ‫ثناء‬‫أ‬‫العمالء‬ ‫وجود‬ ‫ماكن‬.
‫ومتابعتها‬ ‫الحرجة‬ ‫النقاط‬ ‫تحديد‬.
3.‫ا‬‫أل‬‫لتزام‬‫و‬ ‫المهنية‬ ‫السالمة‬ ‫بقواعد‬‫ا‬‫أل‬‫كافة‬ ‫وتوفير‬ ‫الصناعي‬ ‫من‬‫ا‬‫أل‬‫د‬‫لذلك‬ ‫الالزمة‬ ‫وات‬.
‫ا‬ ‫االسعافات‬ ‫صندوق‬ ‫توفير‬‫أل‬‫المطعم‬ ‫في‬ ‫ولية‬.
‫الصناعي‬ ‫واالمن‬ ‫المهنية‬ ‫السالمة‬ ‫بقواعد‬ ‫العاملين‬ ‫توعية‬ ‫فى‬ ‫الزيادة‬.
‫ا‬‫أل‬‫نظام‬ ‫بوجود‬ ‫هتمام‬‫أل‬‫وجهاز‬ ‫الحريق‬ ‫طفاء‬‫أ‬‫للحريق‬ ‫نذار‬.
‫العا‬ ‫تدريب‬‫الحريق‬ ‫مكافحة‬ ‫كيفية‬ ‫علي‬ ‫ملين‬.
‫ا‬ ‫توافر‬ ‫يجب‬‫أل‬‫وا‬ ‫المهنية‬ ‫السالمة‬ ‫بقواعد‬ ‫الخاصة‬ ‫دوات‬‫أل‬‫الصرناعي‬ ‫من‬(‫الجروانتي‬
‫ا‬‫أل‬‫سررتانلس‬–‫الوجرره‬ ‫حررامي‬ ‫و‬ ‫القطررن‬ ‫والجرراونتي‬–‫الحمايررة‬ ‫ومرايررل‬–‫وعالمررة‬
‫أ‬‫مبتلة‬ ‫االرض‬ ‫حتر‬.)
‫باستمرار‬ ‫المطبخ‬ ‫شفاط‬ ‫نظافة‬ ‫متابعة‬.
4.‫ا‬‫أل‬‫هتمام‬‫اال‬ ‫وتوفير‬ ‫بالتدريب‬‫للتدريب‬ ‫الالزمة‬ ‫دوات‬‫وا‬‫أل‬‫ا‬ ‫ستخدام‬‫أل‬‫مثل‬‫االدوات‬ ‫لهذه‬.
‫ا‬ ‫يجب‬‫أل‬‫بالتدريب‬ ‫هتمام‬.
‫وضع‬‫أ‬‫التدريب‬ ‫خالل‬ ‫من‬ ‫للتطوير‬ ‫ستراتيجية‬.
‫التدريبية‬ ‫للبرامج‬ ‫االمثل‬ ‫التطبيق‬.
‫ا‬ ‫توفير‬‫أل‬‫للتدريب‬ ‫الالزمة‬ ‫دوات‬(‫العرض‬ ‫شاشات‬–‫تلفزيون‬–‫فيديو‬–‫كمبيروتر‬
-‫بروجيكتور‬)‫وا‬‫أل‬‫ا‬ ‫ستخدام‬‫أل‬‫مث‬‫لها‬ ‫ل‬.
‫ا‬‫أل‬‫باللغات‬ ‫هتمام‬(‫االنجليزية‬–‫الروسية‬–‫االيطالية‬.)
‫رة‬‫ر‬‫الخدم‬ ‫روات‬‫ر‬‫وخط‬ ‫رفات‬‫ر‬‫والوص‬ ‫رد‬‫ر‬‫القواع‬ ‫ري‬‫ر‬‫عل‬ ‫روي‬‫ر‬‫يحت‬ ‫رغيل‬‫ر‬‫تش‬ ‫راب‬‫ر‬‫كت‬ ‫روافر‬‫ر‬‫ت‬ ‫رب‬‫ر‬‫يج‬
‫المعدات‬ ‫مع‬ ‫التعامل‬ ‫وكيفية‬.
‫السيلة‬ ‫السلوكية‬ ‫العادات‬ ‫مكافحة‬.
5.‫و‬ ‫يل‬ ‫تشي‬ ‫وخطيط‬ ‫داخليية‬ ‫عمل‬ ‫نظم‬ ‫وضع‬‫أ‬‫سيتكمال‬‫ا‬ ‫كافية‬‫أل‬‫دوات‬‫القييا‬ ‫لدقية‬ ‫الالزمية‬‫س‬
‫المنتج‬ ‫ثبات‬ ‫الي‬ ‫للوصول‬ ‫والمعايرة‬.
‫ا‬‫أل‬‫ا‬ ‫التطبيق‬ ‫خالل‬ ‫من‬ ‫المنتج‬ ‫ثبات‬ ‫علي‬ ‫بالحفاظ‬ ‫هتمام‬‫أل‬‫القياسية‬ ‫للوصفات‬ ‫مثل‬.
‫توفير‬‫أ‬‫القيا‬ ‫دوات‬.
‫يجب‬‫أ‬‫المنتج‬ ‫ثبات‬ ‫باهمية‬ ‫دراية‬ ‫علي‬ ‫العاملين‬ ‫يكون‬ ‫ن‬.
181
‫أ‬‫با‬ ‫التوقع‬ ‫نظام‬ ‫ستخدام‬‫البيعي‬ ‫المزيج‬ ‫وتحليل‬ ‫لمبيعات‬.
‫الشاملة‬ ‫الجودة‬ ‫قواعد‬ ‫تطبيق‬.
‫ا‬ ‫قواعد‬ ‫تطبيق‬‫أل‬‫والتخزين‬ ‫ستالم‬.
‫أ‬‫ا‬ ‫رات‬‫ر‬‫العالم‬ ‫رتخدام‬‫ر‬‫س‬‫أل‬‫رييح‬‫ر‬‫التس‬ ‫رة‬‫ر‬‫عملي‬ ‫ري‬‫ر‬‫ف‬ ‫رادية‬‫ر‬‫رش‬(‫رييح‬‫ر‬‫التس‬ ‫ردء‬‫ر‬‫ب‬ ‫راريخ‬‫ر‬‫ت‬–‫راريخ‬‫ر‬‫ت‬
‫أ‬‫االستخدام‬ ‫بداية‬ ‫مكانية‬–‫الصالحية‬ ‫انتهاء‬ ‫تاريخ‬.)
‫أ‬‫ررتخدام‬‫ر‬‫س‬‫أ‬‫ا‬ ‫ررة‬‫ر‬‫مختلف‬ ‫ررع‬‫ر‬‫تقطي‬ ‫ررواح‬‫ر‬‫ل‬‫أل‬‫رروان‬‫ر‬‫ل‬(‫رروم‬‫ر‬‫للح‬–‫ررروات‬‫ر‬‫للخض‬–‫ررماك‬‫ر‬‫لالس‬–
‫للدواجن‬.)
‫وصوله‬ ‫حتي‬ ‫ساخن‬ ‫الطعام‬ ‫تحفظ‬ ‫بحيث‬ ‫للمنازل‬ ‫التوصيل‬ ‫حقائب‬ ‫تطوير‬.
‫ا‬‫أل‬‫الحديثة‬ ‫للتكنولوجيا‬ ‫االمثل‬ ‫ستخدام‬(‫التحكم‬ ‫في‬–‫التحليرل‬–‫الجرداول‬ ‫تنسريق‬–
‫التخزين‬–‫الحسابات‬–‫الدعاية‬-‫التسويق‬.)
‫وجودتها‬ ‫الخدمة‬ ‫لوقت‬ ‫قياسية‬ ‫معايير‬ ‫وضع‬.
‫زيا‬‫دة‬‫أ‬‫وكفاءتها‬ ‫العمالة‬ ‫نتاجية‬.
‫أ‬‫رل‬‫ر‬‫والعمي‬ ‫ردور‬‫ر‬‫ال‬ ‫ريم‬‫ر‬‫التق‬ ‫رالل‬‫ر‬‫خ‬ ‫رن‬‫ر‬‫م‬ ‫رك‬‫ر‬‫وذل‬ ‫رة‬‫ر‬‫والمتابع‬ ‫ريم‬‫ر‬‫للتق‬ ‫رة‬‫ر‬‫الحديث‬ ‫رنظم‬‫ر‬‫ال‬ ‫رتخدام‬‫ر‬‫س‬
‫و‬ ‫الخفىء‬‫أ‬‫االستقصاء‬ ‫ستمارات‬.
6.‫يوضع‬‫ا‬ ‫في‬‫أل‬‫عتبار‬‫الطعام‬ ‫قوائم‬ ‫تخطيط‬ ‫عند‬‫أ‬‫تكميل‬ ‫التيي‬ ‫الميواد‬ ‫جميع‬ ‫علي‬ ‫تحتوي‬ ‫ن‬
‫ذائ‬ ‫ال‬ ‫الحقائق‬ ‫توضيح‬ ‫مراعاة‬ ‫مع‬ ‫ذائية‬ ‫ال‬ ‫القيمة‬‫للعميل‬ ‫ية‬.
‫يجب‬‫أ‬‫للعميل‬ ‫الغذائية‬ ‫الحقائق‬ ‫توضح‬ ‫ن‬(‫الغذائية‬ ‫القيمة‬–‫المكونرات‬–‫السرعرات‬
‫الحرارية‬.)
‫وا‬ ‫التنوع‬‫أل‬‫يجب‬ ‫الغذائية‬ ‫بالقيمة‬ ‫هتمام‬‫أ‬‫ا‬ ‫فري‬ ‫توضرع‬ ‫ن‬‫أل‬‫قروائم‬ ‫تخطريط‬ ‫عنرد‬ ‫عتبرار‬
‫الطعام‬.
‫ا‬‫أل‬‫رود‬‫ر‬‫بوج‬ ‫رام‬‫ر‬‫هتم‬(‫رائر‬‫ر‬‫والعص‬ ‫روب‬‫ر‬‫والحب‬ ‫رة‬‫ر‬‫الطازج‬ ‫ره‬‫ر‬‫والفواك‬ ‫رالطات‬‫ر‬‫والس‬ ‫رورب‬‫ر‬‫الش‬
‫الطازجة‬‫الدسم‬ ‫منزوع‬ ‫واللبن‬ ‫والمياه‬)‫للوجبة‬ ‫الغذائية‬ ‫القيمة‬ ‫لرفع‬.
‫ا‬‫أل‬‫الخاصرررة‬ ‫بالوجبرررات‬ ‫هتمرررام‬(‫والنبررراتيين‬ ‫والقلرررب‬ ‫والضرررغط‬ ‫السررركر‬ ‫مرضررري‬
‫والرياضيين‬.)
7.‫ا‬‫أل‬‫ه‬‫التسويقية‬ ‫بالبحوث‬ ‫تمام‬‫ا‬ ‫لتحديد‬‫أل‬‫حتياجات‬‫للعميل‬ ‫الفعلية‬.
‫المستمرة‬ ‫الدراسة‬‫أل‬‫العميل‬ ‫حتياجات‬‫ا‬ ‫ومواكبة‬‫أل‬‫الحديثة‬ ‫تجاهات‬‫للسوق‬.
‫ا‬‫أل‬‫الفعالة‬ ‫الترويجية‬ ‫باالنشطة‬ ‫هتمام‬.
‫يجب‬‫أ‬‫والمنافسين‬ ‫العميل‬ ‫وتوقعات‬ ‫القيمة‬ ‫مع‬ ‫مناسبا‬ ‫الوجبات‬ ‫سعر‬ ‫يكون‬ ‫ن‬
‫ا‬‫أل‬‫المناسب‬ ‫الموقع‬ ‫باختيار‬ ‫هتمام‬.
‫المنافسين‬ ‫جيدة‬ ‫دراسة‬.
‫تجارية‬ ‫عالمة‬ ‫وجود‬(‫واضحة‬–‫جذابة‬–‫مميزة‬.)
181
‫ا‬‫أل‬‫فررري‬ ‫للمسررراعدة‬ ‫لالنترنرررت‬ ‫االمثرررل‬ ‫سرررتخدام‬‫أ‬‫سرررت‬‫ا‬ ‫مارات‬‫أل‬‫والبحرررول‬ ‫ستقصررراء‬
‫التسويقية‬.
‫ا‬‫أل‬‫معظرم‬ ‫ليغطي‬ ‫المحلية‬ ‫السالسل‬ ‫فروع‬ ‫عدد‬ ‫زيادة‬ ‫طريق‬ ‫نتشارعن‬‫أ‬‫تواجرد‬ ‫مراكن‬
‫وخاصة‬ ‫العمالء‬‫أ‬‫والجامعات‬ ‫الموالت‬ ‫مثل‬ ‫الشباب‬ ‫تجمع‬ ‫ماكن‬.
8.‫رغباتهم‬ ‫تحقيق‬ ‫خالل‬ ‫من‬ ‫العمالء‬ ‫رضاء‬ ‫علي‬ ‫التركيز‬‫ا‬ ‫ومتابعة‬‫أل‬‫تجاهات‬‫الحديثية‬
‫للسوق‬.
‫العميل‬ ‫على‬ ‫التركيز‬(‫ا‬‫أل‬‫العميل‬ ‫ورضاء‬ ‫بالجودة‬ ‫هتمام‬.)
‫يجب‬ ‫والتي‬ ‫للمنازل‬ ‫التوصيل‬ ‫خدمة‬‫أ‬‫االنحاء‬ ‫معظم‬ ‫تغطى‬ ‫ن‬.
‫أ‬‫الطلب‬ ‫العميل‬ ‫على‬ ‫يسهل‬ ‫للسلسلة‬ ‫الموحد‬ ‫الرقم‬ ‫نظام‬ ‫ستخدام‬.
‫بالمطعم‬ ‫الكاش‬ ‫ماكينة‬ ‫وتوفير‬ ‫بالفيزا‬ ‫الدفع‬ ‫قبول‬.
‫وجود‬‫أ‬‫دورية‬ ‫بصفة‬ ‫جديدة‬ ‫صناف‬.
‫مسراحة‬ ‫تروفير‬‫أ‬‫روات‬‫ر‬‫والقن‬ ‫االنترنرت‬ ‫رل‬‫ر‬‫مث‬ ‫الخردمات‬ ‫رن‬‫ر‬‫م‬ ‫مزيرد‬ ‫روفير‬‫ر‬‫وت‬ ‫للشرباب‬ ‫رر‬‫ر‬‫كب‬
‫الجذابة‬ ‫التلفزيونية‬.
‫ا‬ ‫زيادة‬‫أل‬‫والمدار‬ ‫والبنوك‬ ‫السياحة‬ ‫شركات‬ ‫بخدمة‬ ‫هتمام‬.
‫راء‬‫ر‬‫اعط‬‫أ‬‫رالل‬‫ر‬‫خ‬ ‫مررن‬ ‫رال‬‫ر‬‫باالطف‬ ‫خرراص‬ ‫رام‬‫ر‬‫هتم‬(‫ا‬ ‫ردايا‬‫ر‬‫ه‬‫أل‬‫طفررال‬–‫رة‬‫ر‬‫منطق‬‫أ‬‫لعرراب‬–
‫اطفال‬ ‫وجبات‬.)
‫ا‬‫أل‬‫للعميل‬ ‫المقدمة‬ ‫بالقيمة‬ ‫هتمام‬.
‫يجب‬‫أ‬‫ت‬ ‫ن‬‫حسب‬ ‫للتغيير‬ ‫مرونه‬ ‫وفر‬‫أ‬‫العميل‬ ‫ورغبات‬ ‫حتياجات‬.
‫مقابلة‬ ‫و‬ ‫العمالء‬ ‫لمشاكل‬ ‫الجيد‬ ‫الحل‬‫أ‬‫العميل‬ ‫حتياجات‬.
9.‫والسياحة‬ ‫التعليم‬ ‫وزارتي‬‫يجب‬‫أ‬‫ن‬‫ع‬ ‫تيوفير‬ ‫عليي‬ ‫يعملوا‬‫بمطياعم‬ ‫للعميل‬ ‫مههلية‬ ‫ناصير‬
‫الوجبات‬‫السريعة‬.
‫رب‬‫ر‬‫يج‬‫أ‬‫راك‬‫ر‬‫هن‬ ‫رون‬‫ر‬‫يك‬ ‫ن‬‫أ‬‫ريم‬‫ر‬‫والتعل‬ ‫رة‬‫ر‬‫التربي‬ ‫ري‬‫ر‬‫وزارت‬ ‫رل‬‫ر‬‫قب‬ ‫رن‬‫ر‬‫م‬ ‫رحة‬‫ر‬‫واض‬ ‫رتراتيجية‬‫ر‬‫س‬
‫من‬ ‫والسياحة‬‫أ‬‫للعمل‬ ‫مؤهلة‬ ‫كوادر‬ ‫تخريج‬ ‫جل‬‫السريعة‬ ‫الوجبات‬ ‫بمطاعم‬.
‫أ‬‫ا‬ ‫باللغات‬ ‫خاص‬ ‫هتمام‬‫أل‬‫جنبية‬(‫انجليزية‬–‫ايطالية‬–‫روسية‬.)
‫رن‬‫ر‬‫ع‬ ‫راعم‬‫ر‬‫بالمط‬ ‫راملين‬‫ر‬‫للع‬ ‫رة‬‫ر‬‫تدريبي‬ ‫دورات‬(‫رة‬‫ر‬‫العام‬ ‫رحة‬‫ر‬‫والص‬ ‫رية‬‫ر‬‫الشخص‬ ‫رة‬‫ر‬‫النظاف‬
‫العمالء‬ ‫ورضاء‬ ‫الخدمة‬ ‫وفن‬ ‫المهنية‬ ‫والسالمة‬ ‫الطعام‬ ‫وتداول‬.)
‫دورا‬‫ررن‬‫ر‬‫ع‬ ‫رراعم‬‫ر‬‫المط‬ ‫ررديري‬‫ر‬‫لم‬ ‫ررة‬‫ر‬‫تدريبي‬ ‫ت‬(‫ررارات‬‫ر‬‫المه‬ ‫و‬ ‫ررادة‬‫ر‬‫والقي‬ ‫ررق‬‫ر‬‫الفري‬ ‫رراء‬‫ر‬‫بن‬
‫ا‬‫أل‬‫وا‬ ‫شرافية‬‫أل‬‫المسبق‬ ‫التجهيز‬ ‫نظام‬ ‫و‬ ‫المبيعات‬ ‫توقع‬ ‫و‬ ‫والتفويض‬ ‫دارية‬).
‫م‬ ‫عمالة‬ ‫لتخريج‬ ‫الثانوية‬ ‫بالمدار‬ ‫خاص‬ ‫قسم‬‫ؤ‬‫بالمطاعم‬ ‫للعمل‬ ‫هلة‬.
182
‫والفنادق‬ ‫السياحة‬ ‫كلية‬
‫الفنادق‬ ‫ادارة‬ ‫قسم‬
‫ا‬ ‫سالسل‬ ‫تجربة‬ ‫تقييم‬‫مصر‬ ‫في‬ ‫العالمية‬ ‫بالسالسل‬ ‫مقارنة‬ ‫المحلية‬ ‫لمطاعم‬
‫الفنادق‬ ‫ادارة‬ ‫في‬ ‫الماجستير‬ ‫درجة‬ ‫علي‬ ‫الحصول‬ ‫الستيفاء‬ ‫مقدمة‬ ‫رسالة‬
‫الدار‬ ‫من‬ ‫مقدمة‬
‫قزمال‬ ‫عاطف‬ ‫هاني‬
‫بكال‬‫ور‬‫فنادق‬ ‫ادارة‬ ‫يو‬٠٢٢٢
‫اشراف‬ ‫تحت‬
‫أ‬.‫د‬/‫أ‬‫الدين‬ ‫نور‬ ‫حمد‬‫إ‬‫لياس‬
‫المتفرغ‬ ‫األستاذ‬‫ب‬‫ا‬ ‫كلية‬ ‫الفنادق‬ ‫ادارة‬ ‫قسم‬‫الفنادق‬ ‫و‬ ‫لسياحة‬
‫حلوان‬ ‫جامعة‬
‫أ‬.‫م‬.‫د‬/‫دنانة‬ ‫رانيا‬
‫أ‬‫ب‬ ‫مساعد‬ ‫ستاذ‬‫الفنادق‬ ‫و‬ ‫السياحة‬ ‫كلية‬ ‫الفنادق‬ ‫ادارة‬ ‫قسم‬
‫حلوان‬ ‫جامعة‬
‫د‬/‫ربي‬ ‫الم‬ ‫محمود‬
‫سونستا‬ ‫لفنادق‬ ‫االقليمي‬ ‫الرئيس‬ ‫نائب‬‫األوسط‬ ‫الشرق‬
2119

تقييم تجربة سلاسل المطاعم المحلية مقارنه بالعالمية في مصر رسالة ماجستير خاصة بالدكتور هاني عاطف

  • 1.
    1 Faculty of Tourism&Hotel Management Hotel Management Department EVALUATING THE EXPERIMENT OF LOCAL RESTAURANT CHAINS COMPARED WITH THE INTERNATIONAL CHAINS IN EGYPT Thesis Submitted in partial fulfillment of the requirements of Helwan University for Master of Science in Hotel Management By Hany Atef Kouzmal B. Sc., Hotel Management, 2000 Under the Supervision of Prof. Dr. Ahmed Nour El-Din Elias Prof; Hotel Management Department Faculty of Tourism & Hotel Management, Helwan University. Assistant prof. Rania Dinana Assistant Prof; Hotel Management Department Faculty of Tourism & Hotel Management, Helwan University. Dr. Mahmoud Roushdy El Maghraby Regional Vice President of Finance Middle East, Sonesta International 2009
  • 2.
    2 APPROVAL SHEET TITLE: EVALUATINGTHE EXPERIMENT OF LOCAL RESTAURANT CHAINS COMPARED WITH THE INTERNATIONAL CHAINS IN EGYPT NAME: Hany Ateef Kouzmal Mikhaiel This Thesis for the M.Sc. in Hotel Management has been approved by: Prof. Dr. --------------------------------- Prof. Dr.---------------------------------- Prof. Dr.--------------------------------- Committee in Charge Degree Conferred in / / 2009
  • 3.
  • 4.
    4 ACKNOWLEDGEMENTS Primarily, I wouldlike to express my deepest respect and appreciation to Prof Dr Ahmed Nour El-Dein Elias Head of Hotel Management and Ex Dean Faculty of Tourism and Hotel Management, Helwan University, for his guidance, cooperation, and also his valuable advice which helped point me in the right direction. Therefore, because of his time, effort, and continual assistance brought about by his knowledge of this subject, I offer to him my sincerest gratitude, with great thanks. Also, I would like to thank Dr Rania Dinana, Assistant Prof; in Hotel Management, Faculty of Tourism and Hotel Management Department, Helwan University, for her supervision, guidance, encouragement, assistance, and her support throughout the preparation of this Thesis. Also, I would like to express my deepest respect and gratitude to Dr. Mahmoud Roushdy El Maghraby, Regional Vice President of Finance Middle East, Sonesta International, and Visitor lecturer, Hotel Management Department, Faculty of Tourism and Hotel Management, Helwan University, for his continuous support and encouragement, coupled with his invaluable advice. Finally I would like to express my deepest thanks to my dear family, and my friends, who supported me and encouraged me throughout the work on this Thesis.
  • 5.
    5 Table of Contents Page CHAPTERONE: THE PROBLEM AND ITS SETTINGS 1.1. Introduction 1 1.2. Organization of the Research 2 1.3. Abbreviations 3 1.4. Limitation of the Research 4 1.5. The Research Objectives 4 CHAPTER TWO: REVIEW OF LITERATURE 2.1. Overview on Fast-Food Operations 2.1.1 Fast Food Concept 5 2.1.2 Customers Perception on Fast-Food 8 2.1.3 Local and International Restaurant Chains 9 2.2. Quality of Food and Service 2.2.1 Quality Concept 2.2.2 Product Quality 11 2.2.3 Food Quality 12 2.2.4 Food Service Quality 14 2.3. Elements of Competition 2.3.1 Location 15 2.3.2 Pricing 16 2.3.3 Demand 16 2.3.4 Training 16 2.3.5 Operational Systems 17 2.3.6 The Element of Risk/Failure 18 2.3.7 Product Branding 21 2.3.8 Product Value 22 2.3.9 Marketing 24 2.3.10 Promotional Element 26
  • 6.
    6 2.3.11 Services forChildren 27 2.3.12 Atmosphere (Surroundings) 28 2.3.13 Customer Satisfaction 28 CHAPTER THREE: MATERIALS AND METHODS 3.1. Materials 3.1.1 Population Survey 31 3.1.2 Samples 31 3.1.2.1 Samples from Independent Establishments 3.1.2.2 Samples from Local Establishments 3.1.2.3 Samples from International Establishments 3.2. Methods 3.2.1 Primary Data 3.2.1.1 Guest Questionnaire 34 3.2.1.2 In-depth Personal Interviews 35 3.2.1.3 Checklist 35 3.2.2. Secondary Sources 36 3.2.3. Pilot Study 36 3.2.4. Data Analysis 37 CHAPTER FOUR: RESULTS AND DISCUSSIONS 4.1. Introduction 38 4.2. Questionnaire Response Rate 39 4.3. Questionnaire Analysis Results and Discussion 39 4.4. Interview Response Rate 67 4.5. Interview Analysis Results and Discussion 67 4.6. Checklist Analysis Results and Discussion 94
  • 7.
    7 CHAPTER FIVE: SUMMARY, CONCLUSIONAND RECOMMENDATIONS 5.1. Summary 111 5.2. Conclusion 114 5.3. Recommendations 118 REFERENCES 119 APPENDICES APPENDIX (A1) Guest Questionnaire Form 127 APPENDIX (A2) In-depth Personal Interviews Form 137 APPENDIX (A3) Checklist Form 143 ARABIC SUMMARY
  • 8.
    8 List of Tables TableTitle Page 1 Abbreviations list 3 2 The main features of modern fast food concepts 3 Samples from the establishments 32 4 Menu specialty of the selected Quick Service Restaurant QSR 33 5 Questionnaire response rate. 39 6 Customers' preferable meal 41 7 Statistics for customers' restaurants preferences 42 8 Statistics of important factors in QSR that attract customer 44 9 Statistics for restaurants factors' evaluation 47 10 Restaurant categories factors' ranking 48 11 Personal data analysis 66 12 Interview's response rate 67 13 Statistics of restaurants factors' evaluation 75 14 Restaurant categories factors' ranking according to their means 76 15 Checklist results 94 16 Exterior factors in independent restaurants 95 17 Interior factors in international chain restaurants 96 18 Interior factors in local chain restaurants 96 19 Interior factors in independent restaurants 97 20 Food quality factors in international chain restaurants 98 21 Food quality factors in local chain restaurants 99 22 Food quality factors in independent restaurants 100 23 Guest service factors in international chain restaurants 101 24 Guest service factors in local chain restaurants 102 25 Guest service factors in Independent restaurants 103
  • 9.
    9 26 Employee appearancein international chain restaurants 104 27 Employee appearance in local chain restaurants 104 28 Employee appearance in independent restaurants 105 29 Management behaviors/ functions in International chain restaurants 106 30 Management behaviors/ functions in local chain restaurants 107 31 Independent restaurants 108 32 Restaurant categories rating scale 107
  • 10.
    11 List of Figures FigureTitle Page 1 Customer's preferences to eat fast food. 40 2 Customers' reasons for restaurants type preferences. 44 3 Important factors in Quick Service Restaurant QSR that attract customer (service quality, consistence standard and atmosphere). 45 4 Important factors in QSR that attract customer (brand name and menu variety). 46 5 Important factors in QSR that attract customer (location and promotional activities). 46 6 Brand name factor's evaluation in QSRs. 50 7 Location factor's evaluation in QSRs. 51 8 Price factor's evaluation in QSRs. 52 9 Food quality factor's evaluation in QSRs. 53 10 Managers' evaluation for local fast food operations. 54 11 Consistence standard factor's evaluation in QSRs. 55 12 Menu variety factor's evaluation in QSRs. 56 13 Atmosphere factor's evaluation in QSRs. 57 14 Promotional activities factor's evaluation in QSRs. 58 15 Customers' evaluation for the experiment of Egyptian QSRs. 59 16 Customers' problems with Egyptian QSRs. 62 17 Managers evaluation for QSRs in Egypt. 68 18 Egyptian market expectations about fast food concept. 69 19 Egyptian customers' needs and preferences. 70
  • 11.
    11 20 Managers' waysto deal with customers' needs and preferences. 71 21 International chain restaurants' attributes. 72 22 Managers' evaluation for local fast food operations. 73 23 Managers' opinions in using international concept by local fast food operations. 74 24 Managers' evaluation of brand name factor in QSRs. 77 25 Managers' evaluation of location factor in QSRs. 78 26 Managers' evaluation of price factor in QSRs. 79 27 Managers' evaluation of food quality factor in QSRs 80 28 Managers' evaluation service quality factor in QSRs. 81 29 Managers' evaluation consistence standard factor in QSRs. 82 30 Managers' evaluation of atmosphere factor in QSRs. 83 31 Managers' evaluation of promotional activities factor in QSRs. 84 32 Labor turn over rate in QSRs . 85 33 Means to decrease turn over rate in QSRs. 86 34 Managers' evaluation of training level in QSRs. 87 35 Managers' evaluation for marketing strategies in QSRs. 88 36 Managers' evaluation for quality level in QSRs. 89 37 The extent of product development to meet customers' needs in QSRs. 90 38 Customers satisfaction measuring methods in QSRs. 91
  • 12.
  • 13.
    13 1.1 Introduction Food serviceaway from home is essential to tourism. Food service industry becomes one of the fastest growing industries, because of many social and commercial changes around the world. Most modern industry requires that individual travel and work at a distance from home; thus, food service industry plays a required supporting role in providing food for these individuals. In addition to food and beverage away from home, food service industry provides convenience, communication settings and a wide variety of outputs contributing to life's quality. Among the latter, entertainment / diversions; and ambiances are contributing to variety in living experiences. Food service industry is a major generator of jobs. The group of firms providing food and restaurant supplies has been found a substantial source of economic base in itself. Food service industry also supports the community infrastructure through utility systems and local taxes. Recently, fast food restaurant chains have spread out, blossoming all around the world. Such chains are based on some factors for their success: such as cleanliness, food quality, value, atmosphere, location, and speed of service. In Egypt there are many of fast food restaurant chains; some of which are domestic in origin, like Wessaya, Mo`Men, Cook Door, Felfela, Makani, and Gado, other chains such as McDonald's, Burger King, Hardee's, and Kentucky fried chicken (KFC), are international franchised operations. These domestic chains are seeking to compete with the international chains in quality, level of services offered, universal reach and spreading around the Arab and foreign countries. This can be achieved by a good reputation that will give better profits. Therefore, it is necessary to carry out a comparative study to evaluate the experiment of the local restaurant chains compared to the international restaurant chains running in Egypt.
  • 14.
    14 1.2. Organization ofthe Research With regard to the organization of the paper, this thesis has been developed over five chapters; Chapter One: "the Problem and its Settings". This chapter sets out the basic framework of the thesis. The components include an introduction, organization, a definition of terms and abbreviations, limitations, and objectives. Chapter Two: "Review of Literature". This chapter looks at the literature upon which the subject has been researched. Chapter Three: "Materials and Methods". This shows the way in which the data was collected. The information includes the population, research, the design, treatment of the data and the instruments used for the research. Chapter Four: "Results and Discussion". This sets out the analysis of the data in exactly the same way as chapter three concerning the points of research. Chapter Five: "Summary and Recommendations". This chapter provides a summary based upon the information’s received or suggested, the obtained results and recommendations of the study.
  • 15.
    15 1.3. Abbreviations Abbreviations usedthroughout the thesis are defined as follows: Table 1: Abbreviations list Professorprof Quick Service RestaurantQSR National Restaurant AssociationNRA Information TechnologyIT Quality ControlQC Quality AssuranceQA Total Quality ManagementTQM Continuous Quality ImprovementCQI NumberNO Define - Measure - Analyze - Improve- Control DMAIC Quality Function DevelopmentQFD Product Life CyclePLC Critical Control PointsCCPs New Product DevelopmentNPD Points of DistributionPODs Hazard Analysis Critical Control PointHACCP Designated Market AreaDMA Strengths, Weaknesses, Opportunities, and Threats SWOT On the Job TrainingOJT Skills Based PaySBP Electronic Point-of-SalesEPOS Target RestaurantTR Public RelationsPR Product, Price, Place, and Promotion4Ps Unique Servicing ProportionUSP Point of SalesPOS Identification DataID Other People DataOPD Chamber of Tourism EstablishmentsCTE Statistical Package for Social ScienceSPSS Standardstd X2 SignificationX2 sig
  • 16.
    16 1.4. Limitations ofResearch Study limitations are represented in the following points:- 1.4.1. Place limitation: Unfortunately, it was difficult to assess many of the fast food chains in Egypt due to, costs, time involved, and the accessibility to these chains. For these reasons, the ones which were looked at were limited to four samples from the independent fast food restaurants in Sharm El Sheikh, four from the famous local fast food chains as well as four international chains in Sharm El-Sheikh. 1.4.2. Time limitation: The field study was implemented in the period from September 2006 to August 2007. 1.5. Research Objectives  This study is aimed at : 1. Evaluating the experiment of local restaurant chains as compared with the international ones. 2. Defining the factors needed to development the local restaurant chains to reach the international standard. 3. Evaluating international chains product developing.
  • 17.
  • 18.
    18 2.1. Overview onFast-Food Operations 2.1.1 Fast Food Concept The National Restaurant Association (NRA) defines the food service industry as "encompassing all meals and snacks prepared outside the home". This definition therefore includes all take – out meals and beverages. Khan (1991) Ball (1992) agreed with Samle (1980) that the fast food restaurant, a place where a customer should be served within five minutes of entering the outlet even at peak periods. While Melaniphy (2005) classified fast food according to the product as it is prepared and cooked quickly, with a service delivery varying between 2 to 15 minutes, a low price, easily consumed with fingers or disposable cutlery. Brymer (1995) defined a quick service restaurant as a "firm with a mission to provide quicker service and core technology geared towards this mission. However, Walker (2006) considering that quick-service restaurants offer a quick service. Negl (2002) identified that as fast service restaurants in recognition of the fact that the service is fast, not the food. Lane and Duper (1997) explained that in preference to fast food restaurant tend to be located near highways, malls and down town areas which offer a standard menu with limited choices that attempt to satisfy a hungry audience. Moreover, Walker (2006) highlighted that quick- service restaurants have increased in popularity because of their location strategies. They are situated for convenience in every possible area. Their menus are limited, which makes it easy for customers to make quick decisions on what to purchase.  Classification of fast food operations according to according menu specialty Walker (2006) agreed with Brymer (1995) in that classifying the quick service restaurants segments is according to the menu specialty. That specialty could be hamburger, pizza, chicken, snacks, sandwich, Mexican, or seafood. They are the leaders for each segment according to the spread, the popularity, and the volume of sales
  • 19.
    19  Classification offast food operations according to restaurant characterization Traditional fast-food restaurants Ball (1992) reported that the traditional fast food operations include fish and chip shops, ethnic, take away and sandwich bar operations, they are mostly owned by individuals. Scanlon (1998) stated that the traditional fast - food restaurants are concentrated on items from the menu such as hamburgers, pizza and chicken, Modern fast food restaurants These have been identified with fast food chains, which are designed around systems of catering which have been linked to manufacturing production lines with the design and layout of restaurants, the scheduling and planning of a work place, etc., being systematically planned to produce consistently standardized products. Simplified menus characterize these restaurants and chains which dominate a high standard of service, training and decor. Modern operations usually offer a combination of eat on the premises, take away drive. The main features of modern fast food concepts are shown in Table 2 as suggested by Ball (1992).
  • 20.
    21 Table 2: Themain features of modern fast food concepts Features Description Food materials Consistent and controllable quality, precisely specified, equally portioned. Type of products Suitable for quick and retention for short periods without deterioration. Organization Highly organized routines with precise job specifications and procedures. Operation Usually planned for large throughput and high sales volume (including counter sales) Cost control Prices portion and cost control, permitting relatively small margins and competitive pricing. Quality control Standard preparation, cooking and serving routines laid down, including the discarding or sub-standard food (e.g. maximum time for keeping food before serving). Hygiene Exacting equipments emphasized as a part of product reliability, including measures to reduce litter (in store and neighborhood). Packing Products distinctively packaged (disposables), easy to handle (usually finger held, suitable for over-the- counter or table meals). Research Product research and consumer response testing essential. On-going research into changing food preference sand attitudes is necessary to develop concepts. Variety May be provided in product range offered or by variations in one basic product (dressings, fillings, supplements). Markets Usually targeted at wide, classless society, primarily young of family group. Promotion Emphasis is given to value for money, consistent quality and cleanliness. Particular products may be differentiated by originality, size, cost competitiveness, variety of choices or fillings, healthy eating, and friendly service. Source : Ball (1992)
  • 21.
    21 2.1.2 Customer Perceptions Johnsonand Clark (2005) illustrated that while the expectation- perception approach to understanding service quality is extremely useful in focusing on the outcome of customer satisfaction and helps identity on mismatches between operational and customer views of quality, which does have some downsides.  Service could be perceived to be 'good' when it is 'bad'.  Service could be perceived to be 'bad' when it is 'good'  Service that was 'good' last time may only be 'OK' this time.  Satisfied customers may switch. King and Ronald (2006) differentiated between quality in fact and in perception and they stated that quality in fact relates to our internal standard, we get what we expect, so set high expectations. Quality in perception is how our customers perceive our service. Customer differences Foster (1993) highlighted that different people have different nations about what type of food tastes good, but a successful food and beverage operation is able to consistently satisfy the majority of its guests. Peppers and Rogers (1997) argued that customers are different in two primary ways: They need different things from the enterprise, and they have different value to the enterprise. A customer's value will depend largely on how long the customer remains loyal, and even small increases in the state of customer retention add significantly to customer's value. Knowing what different customers need involves much more than simply tallying what they've bought, because two customers might buy the same product for quite different reasons. Powers and Barrows (2006) illustrated that the guest is also apart of the service transaction. A guest who is not feeding well or who takes a dislike to member of the staff may have a bad experience in spite of all efforts to please.
  • 22.
    22 2.1.3 Local andInternational Restaurant Chains Independents restaurants King and Ronald (2006) declared that independent is one who is not bound by or definitively committed to another, and it a particular brand or company. While Walker (2006) highlighted that one or more owners, usually involved in the day-to-day operation of the business, typically own individual restaurants (also called Indies). Even if the owners have more than one store, each functions independently. These restaurants are not affiliated with any national brand or name. They offer the owner independence, creativity and flexibility, but with an element of risk. Wade (2006) mentioned that between the independent and chains lies at least two other possibilities, some dependent operations are so successful that they open additional units without, however, becoming as large as to lose the hands on approach of the owner operator. Independent group operators are not exactly chains, but more a longer single unit. The other possibility and one that is pursued by thousands of business people are franchise operations. Chains restaurants King and Ronald (2006) defined chain as a group of enterprises or institutions of the same kind of function usually under a single ownership, management or control. Walker (2006) stated that chain restaurant comprises a group of restaurants, each identical in market, concept, design, service, food and name. Part of the marketing strategy of a chain restaurant is to remove uncertainty from the dining experience. The same menu, food quality, level of service and atmosphere can be found in any one of the restaurants, regardless of its location. Family run teams or other entrepreneurs usually own them. Wade (2006) agreed with Powers and Barrows (1999) in that chain are playing a growing role in food service. Moreover, they are prominent among the companies that recruit graduates for hospitality programs.
  • 23.
    23 Chains have strengthsof seven different areas: (1) Marketing and brand recognition (2) Site selection expertise (3) Access to capital (4) Purchasing economies (5) Centrally administered control and information systems (6) New product development (7) Human-resource development International versus local fast food chain According to Lan, and Khan (1995) fast food operations are divided into two categories; international chains and local chains where each have a different approach to the operating and management. The international fast food chains have a core product (hamburger, chicken or pizza). They focus on image building through progressive marketing which gains mass production and the central distribution international fast food chains are expanding through franchising. Meanwhile the local fast food chains are expanding through private ownership and building their image through products. Local fast food operations do not have mass production or central distribution; therefore, they became labor intensive.
  • 24.
    24 2.2. Quality ofFood and Service Quality Concept Wyckoff (2001) highlighted that quality is the degree of excellence for what is intended add to this a controlled variation in order to achieve that excellence, where the end result is meeting customer requirements. While Schroeder (2004) stated that quality is meeting and exceed customer requirements now and in the future." This means that the product or service is fit for the customer's use. Fitness for use has related to benefits received by the customer and to customer satisfaction. Only the customer, not the producer, can determine it. Noel and Cullen (1996) mentioned that quality is a process, not a procedure and as such is never finished. The culture of quality promotes and sustains change. Stutts and Wortman (2006) added that quality could be defined as "The consistent delivery of product and services according to expected standards. King and Ronald (2006) stated that the other half of the definition of quality is "doing things right." Doing things right simply means meeting customers needs and expectations more rapidly and at a reduced cost. It is customer orientation, innovation, teamwork, and everyone's responsibility. Quality importance Field (1999) reported that quality is the major driver of overall satisfaction, while price and service tied for second place. Sideman and Johnson (2002) argued that providing consistent quality service has become a challenge for the quick service industry. Schroeder (2004) indicated that quality can both improve revenues and reduce costs. The cost of quality measures the lack of conformance to customer requirements. Quality costs can be convention or appraisal. Failure costs may be due to internal or external failures.
  • 25.
    25 2.2.2. Product Quality Productconcept The actual good or service offered for sale. It could include all of the features of the good or service as well as the packaging and brand name of the good or service. Powers and Barrows (1999) illustrated that in a restaurant, this involves not only the food service the way the server and guest interact and the atmosphere of the place. Reid and Bojanic (2006) agreed with Etzel (2004) in that product refers to all of the goods and services that are bundled together and offered to consumers. Nearly, every product sold includes tangible and intangible elements. Product Quality and Customer Satisfaction Peppers and Rogers (1997) indicated that there is, of course, no substitute for quality. No customer will return for more of a bad product, so having product quality at least on a par with the competition is essential for 1:1 enterprise. Customer satisfaction is the opposite of customer dissatisfaction, and dissatisfaction is one sure route to defection. Keep in mind, however, that customer satisfaction by itself is usually not sufficient to generate loyalty. Wade (2006) agreed with Negl (2002) in that customer feedback is vital to keep the menu fresh. Feedback from customers helps to improve product quality, which in turn increases sales and products higher profits. 2.2.3. Food Quality Reay (1983) pinpointed that any food product specification involves consideration of factors such as those set out below: 1. The quantity of goods – based on the standard recipe. 2. The quality and grade of ingredients. 3. The dimensions of the finished item, e.g. the thickness of the pastry and the weight and type of filling. 4. The nature of the glaze. 5. The degree browning.
  • 26.
    26 6. The type,size and shape of the garnish. 7. The type of packaging to be used 8. The layout and wording of labels 9. The product life 10.The storage requirements Wiley and Sons (2006) illustrated that the quality of food depends on two factors: the skill with which it's prepared, and the basic quality of the foodstuffs use to this might be added the perception of novelty factor Briggs (2000) stated that food, whether raw or cooked is a perishable commodity and has a limited life and so caterers have to ensure that they buy produce in the correct quality and quantity in relation to customer demand and that it is correctly stored and processed. The choice of food and drink revolves around the menu, which is limited or extensive, and whether it concerns a particular product, if there is a varied choice, and the quality of the product offered, and it is fresh or convenience. Other factors include portion sizes and the availability of children's menus along with consistency, range of tastes, textures, aromas, and colours and presentation of the food and drink. Dharmaraj (2002) believes that poor quality food can destroy the commercial credibility. Seidman and and Johnson (2002) argued that keeping consistency of food quality is a though task for all suick service restaurant QSR chains.
  • 27.
    27 2.2.4 Food ServiceQuality ConceptServiceFood The service is all action and reactions that customers perceive whichthey have purchased. In hospitality, service performed for the guest by people or by systems. The emphasis in definition is on the guest's total experience. Indeed, from the guest's point of view, service is the performance of the organization and its staff. Schroeder (2004) mentioned that most definitions of service stress the intangible and cannot be easily quantified or defined. A better definition is that service is produced and summed simultaneously, and consumption. Reid and Bojanic (2006) defined a service as an intangible product that sold or purchased in the marketplace. Meanwhile Kotler and Armstrong (1996) stated that service means "all features, acts, and information that augment the customer's ability to realize the potential value of a product or service. Powers and Barrows (2006) confirmed that the basis of service strategy is market segmentation, largely on consumer service expectation. Successful service companies develop a service culture cased on commitment by top management. Consistency between policy and practice and well developed channels of communication. Because service people are a part of the product, a good service team is essential, service teams based on careful selection, training, and on motivational programs that include rewards and involvement in service planning. Because most hospitality products are strikingly similar, service is the most significant sustainable competitive advantage Noel and Cullen (1996) stated that zero defects is the standard that service organizations must set this very high standard, however, is set in the context of customer expectations for a particular segment and operation type. At a McDonald's waiting lines can expect during the rush hour and will accept as long as they move with reasonable speed. However, a dirty or cluttered McDonald's, even in a rush period, scents a defect. Zero - defects committee should formed from members of the quality improvement team.
  • 28.
    28 2.3. Elements ofCompetition 2.3.1. Location Powers and Barrows (2006) stated that marketing place refers to the location, the place where the good or service is offered. Place refers not only to the property's location, but also to the channels of distribution. Reid and Bojanic (2006) agreed with Powers and Barrows (1999) in that the place component refers to the manner in which the products and services being delivered to consumers. Ridgeway and Ridgeway (1994) indicated that location is, of course, extremely important. All businesses are near potential customers but this may be less important for an outside catering company than for a restaurant. Moreover Briggs (2000) reported that the location of the food service facility might said to be the most important feature. Services, which are not appropriately located, may not successfully perform. Powers and Barrows (1999) stated that the success of most restaurants also enhanced by a location near the heart of major traffic patterns. The technique for analyzing location potential requires a special kind of knowledge, and chains can afford real estate departments that possess that expertise. Seidman and Johnson (2002) considered that location is an old topic but with new content. Chinese QSR chains are entering various non-traditional venues. These venues include shopping mall food courts, leading supermarket, retail chains, neighborhood centers, key intersections, university and college campuses, and airports, casinos, and sports arenas. Powers and Barrows (2006) stated that restaurant companies have developed downsized units for places where a traditional unit will not fit. These units often take the form of a mobile cart requiring minimal investment. The name given these new units is points of distribution (PODs). Wade (2006) argued that the presents of quick-service operations in every market of any size is a key characteristic of quick service and one
  • 29.
    29 of the mainfactors sporting its growth over the past 50 years. Because of their many locations, they make eating out convenient. 2.3.2 Pricing The price is the amount of money and/or other items with utility needed to acquire a product. Recall that utility an attribute with the potential to satisfy wants. The price has a tremendous impact on the success or failure of a product. Etzel (2004) mention that price is significant in economy, in the costumer's mind, and in an individual firm let's consider each situation some prospective customers are interested primarily in law prices, whereas another segment is more concerned with other factors, such as service, quality, value, and brand image. It is safe to say that few, if any customers are attentive to price alone or are entirely oblivious to price. Powers and Barrows (2006) confirmed that there is a risk in price reduction, namely, that the lower price will denote a cheapened product to the customer. As with virtually all marketing activities, the key is to keep prices in line with customer expectations and to offer products that perceived to be a good value to the customer. 2.3.3 Demand The market demand is the demand for a product or service. 2.3.4. Training Stutts and Wortman (2006) agreed with Noel and Cullen (1996) in that training is the process of integrating personal and organizational goals. Donnelly et al. (1998) indicated that inadequate training can be a major barrier to quality. Hill and Jones (1998) found that a company that employs individuals with high skills is likely to be more efficient than one employing less skilled personnel.
  • 30.
    31 2.3.5 Operational Systems Powers(1995) declared that a standard exterior appearance gives many chain operators a high recognition value. Hill and Jones (1998) indicated that standardization refers to the degree to which a company specifies how decisions are to been made so that employees' behaviour becomes predictable. Gouville and Soman (2001) explained that the hospitality industry commonly bundles goods and services. Firms routinely offer single units of different products or multiple units of the same product, for one price. Seidman and Johnson (2002) described that the quick service industry is characterized by regular interaction between customer and employee. Built around service encounters designed to be consistent and predictable, the nations of reutilization and standardization are central to the industry. Donnelly et al. (1998) argued that once the quality characteristics have defined, the next step is to determine the desired quality standards. These standards quantify the specific quality requirements for the organization's output. Quality standards serve as the reference point for comparing what is "ideal" to what actually "is". Reid and Bojanic (2006) considered that before you can evaluate the level of service provided by employees within your organization, you must establish the standards by which they will judge. Wade (2006) believes that the marketing plan must specify the restaurant's standards for food quality and consistency, beverage operations, cleanliness, and service. Clearly stating the standards in the document provides management with a written document to reference. From point of view of Wade (2006) the broke bone of the operating system is typicality a set of comprehensive operations manuals and a complete set of recipes that cover all products on the menu. The operation manual sets forth operating procedures from opening to closing and nearly everything in between. All major equipment operations and routine maintenance are been described in the operation manual or a separate equipment manual. Define how things been done based on experience, organization standards, and customer expectations. Organizational systems also explain who is involved and why.
  • 31.
    31 As the productionis the process wherein the food is converted to the state in which it will be served. Pepper et al. (1984) illustrated that fast food operations handle huge amounts of food in a short time. They could never keep up with their customer's demands if they did not use mass production methods. Mass production means buying, preparing, and serving in large quantities. Powers and Barrows (2006) confirmed that some kinds of operations are ideally suited to the production-line approach to service. Quick service restaurants amusement parks and budget motels come to mind as having the need for the cost efficiency of the production approach. Powers (1995) mentioned that all of the quick service restaurants (QSR) operations try to simplify their production processes and use self-service. 2.3.6 The Element of Risk and Failure Risk concept Wiley and Sons (2006) described that many people will tell that the restaurant business is the highest-risk business in the retail spectrum. This simply is not true. The failure rate for eating places in the general is below the average business failure rate nationwide. Camera, furniture, and apparel stores regularly top the failure list. Powers and Barrows (1999) argued that franchising is not risk free. The franchisee is generally completely dependent on the franchise company for not only marketing but often or purchasing and other operations-oriented assistance. Wade (2006) explained that failure is much less common among franchised restaurants than among independent operation. Elements of restaurants success and failure Powers and Barrows (1999) believed that all advertising will be effective only if consumers get exactly what expect. Therefore, chains concentrate on ensuring consistency of quality and service in operations. Customers know what to expect in each of the units and, in an increasingly mobile society that is important.
  • 32.
    32 Parsa et al.(2005) pinpointed the elements of success and failure as follows: 1. Elements of success A. Have a distinctive concept that been well researched. B. Ensure that all decision make long-term economic sense. C. Adapt desirable technologies, especially for record keeping and tracking customers. D. Educate mangers through continuing education at trade shows and workshops an environment that fosters professional growth has better productivity E. Effectively and regularly communicate values and objectives to employees in one instance. F. Maintain a clear vision, mission, and operation strategies, but be willing to amend strategies as the situation changes. G. Create a cost conscious culture, which includes stringent record keeping. H. Focus on one concentrated theme and develop it well. I. Be willing to make a substantial time commitment both to the restaurant and to family. J. Create and build a positive organization culture through consistent management. K. Maintain management flexibility. L. Choose the location carefully, although having a good location. 2. Elements of failure: A. Lack of documented strategy; only informal or oral communication of mission and vision; lack of an organizational culture fostering success characteristics. B. Inability or unwillingness to establish and formalize operational standards; seat-of-the-pants management. C. Frequent critical incidents; managing operations by "putting out fires" appears to be a common practice. D. Focusing on one aspect of the business at the expense of the others. E. Poor choice of location. F. Lack of match between restaurant concept and location. G. Lack of business experience or knowledge of restaurant operations. H. Poor communication with consumers. Negative consumer perception of value price and product must match.
  • 33.
    33 I. Inability tomaintain operational standards leading to too many service gaps. Poor sanitary standards are almost guaranteed to kill a restaurant. Wiley and Sons (2006) pointed out that the stark reasons for business failure are worthy of study these include in competence, lack of line experience, lack of managerial experience and quite important, unbalanced experience. Inadequate funds run out of money before the restaurant attracts enough customers to go into profit. Poor management is a catchall phrase, but should not be dismissed on those grounds. The way to success Hill and Jones (1998) considered that avoiding failure requires a constant focus on the basic building blocks of competitive advantage, continuous improvement, learning identification, adoption of the best industrial practice, and victory over inertia. Huber and Pilmanis (2001) mentioned that there are primarily five customer sale channels: delivery, dining, takeout, pickup window and catering. In the QSR industry, IT has been commonly used for order processing, accounting, purchasing, marketing, consumer behavior and the location of new restaurants. Parsa et al. (2005) explained that perhaps the key finding was that a successful restaurant requires focus on a clear concept that drives all activities. In this finding, concept is distinct from strategy. A remarkable outcome of the interviews is that we found few differences in having a well-defined strategy between successful and failed restaurants owners but considerable differences in clarity Negl (2002) believed that restaurants are been designed to serve a basic meal quickly and affordably. Menus are usually limited and kitchens are designed to produce high volume in short periods. The customer expects quick service, low price, and consistency. Fast food establishments are those that serve food for which there is little or no waiting. From Wade (2006) point of view, the key to the success of quick service, nevertheless, is its simplicity. A key simplification remains quick services limited menu. Each item on the menu has been engineered to simplify and standardize its purchasing, production and service.
  • 34.
    34 Pepper et al.(1984) considered that a fast food operation has two main aims: to please the customer and to make a profit. The giant fast food chains were built on the belief that four things operating together will bring them their success, these four things are:- Limited menu Fast service Low price High sales volume Brian De Silva (2006) pointed the top tips of WOW success as follows:  Research market and area.  Establish budget.  Brief designer: Make sure choose a good designer.  Agree concept: What will be famous for?  Recruit the right team.  Inspire team and guests.  Market restaurant: Public relation and collateral, guest and staff incentives.  Make changes when need to.  Listen to staff and guests.  Remember: you're only as good as your last drink. 2.3.7 Product Branding Brand concept According to King and Ronald (2006) image is a popular conception (as of a person, institution, or nation) project especially through mass media importance of brand. Martina (1958) defined image as "the way in which a store is defined in the shopper's mined, partly by its functional qualities and partly by an aural of psychological attributes. From this, two key elements in the construction of image can be identified. o Functional qualities such as the restaurant layout, menu range, price levels and décor. o Psychological attributes: The less tangible elements such as feeling of friendliness or a sense of excitement.
  • 35.
    35 Importance of brand Blackett(2003) told that branding is a binary process. First the name, logo, pack design, advertising and purchasing environment must create the promise; and then the product or service concerned has to deliver. If the brand lives up to expectations then trust been rewarded; if it does not then the buyer will look elsewhere. So good brand management is all about managing customer confidence so that he or she can buy without fear of risk can be a source of strong cash flows Brand marketing Walker (2006) believed that brands are defined as unique that identify a product and set it apart from those of other producers or service providers. Today, brands are becoming a more and more important part of a company's marketing strategy, mostly because having a well-known brand tends to create brand identity. The most important considerations when developing a brand are these:  It must be easy to remember.  Guests need to associate the brand with value.  It must have a positive connotation. Name selection and logo Wade (2006) agreed with Ridgeway and Ridgway (1994) in that the restaurant name and any subtitle it may use give people an immediate impression as to the type of restaurant it is. A name must be memorable and should be easy to pronounce, original, attractive, and easy to remember and say. A logo is the restaurant's identifying mark that the public will recognize. In restaurant industry, Mc Donald's has developed its brand and logo-the golden arches - to be automatically identifiable worldwide.
  • 36.
    36 2.3.8 Product Value Productvalue concept Mattila (2001) mentioned that committed customers place a high value on a restaurant's social benefits, such as friendship and familiarity, in addition to good food and a fun atmosphere. Etzel (2004) defined that value is the ratio of perceived benefits to price and any other incurred costs. When we say a product has sample value, we do not necessarily mean it is inexpensive nor has a very low price. Rather, good value indicates that a particular product has the kinds and amounts of potential benefits such as quality, image, and purchase convenience consumers expect at a particular price level. Foster (1993) believed that value is a customer's satisfaction with a product in relation to the price. The value of a restaurant meal is a matter of perception how the customer views the quality of the dining experience. Johnson and Clark (2005) indicated that value is the customer's assessment of the benefits of the service weighed against all the costs involved. It is important to emphasis that the ultimate judge of value is the customer. Price value perception Etzel (2004) reported that a product's price has been affected by whether it is a new item or an established one. Over the course of a life cycle, price changes are necessary to keep the product competitive. Wade (2006) agreed with Negl (2002) in that price / value perception means consumers believe that they are receiving value for the price that they are paying, whether the customers are eating in a fast food restaurant or dining in the finest restaurant in the area. The décor, ambience, and service standards must all contribute to the customer's perception of the dining experience.
  • 37.
    37 2.3.9 Marketing Marketing concept VanHoof et al. (1996) illustrated that marketing is all of activates designed to move goods and services from the producer to the consumer. Walker (2006) said that marketing is attracting guests and establishing a relationship with the guests that ensure their continuous loyalty. Everyone from the corporate executive to the line employee should be involved with marketing. Reid and Bojanic (2006) stated that:  Marketing is the process of determining consumer needs, creating a product service mix that satisfies these needs, and promoting the product service mix in order to attain the goals and objectives of the firm.  Marketing concept is a framework for the marketing philosophy that consists of three interrelated elements: an organization's basic purpose is to satisfy customer needs; satisfying customer needs requires integrated and coordinated efforts throughout the organization; and organizations should focus on long-term success. The marketing mix Powers and Barrows (2006) agreed with Reid and Bojanic (2006) also in that the marketing mix is conventionally though of as encompassing the four Ps: product, price, place, and promotion. The researcher agree with this opinion. Ronald and Nykiel (2005) added that there are many different perspectives on marketing and marketing strategy especially in ever- changing environment. In the 1990s as we transitioned to a predominantly service-oriented economy and marketing environment, marketing strategies shifted to focus on the four Cs, as delineated by waterborne:  Consumer wants and needs  Cost to satisfy (want and needs)  Convenience to buy  Communication (creating a dialogue)
  • 38.
    38 In the currentdecade, while marketing must still focus on the four Ps and four Cs, marketing strategies appear to have shifted and are now more and more based on the new five Ps:  Preparation  Positioning  Perception  Proclamation  Power thrusts Market segment Walker (2006) defined that market segment is a smaller, identifiable group that can be defined using any set of, such as moose found in geographic, demographic, or psychographic. Van Hoof, et al. (1996) indicated that marketers go through a process called market segmentation and separate people into distinct group based on their individual characteristics and buying habits. The target market Wade (2006) agreed with Negl (2002) in that the target market is the type of customer who the restaurant is attempting to reach and entice to frequent the establishment. Writing a menu requires understanding the customer's wants, needs, and expectations. A customer will judge a restaurant on several critical areas: food quality and presentation, service, ambiance, cleanliness, and value. The menu informs customers of the choices available to them. This is known as menu engineering. The goal of menu engineering is not to force the customer to purchase an unwanted item, but rather to place certain items in high visibility locations. Marketing and selling Reid and Bojanic (2006) agreed with Medik (1999) in that the difference between selling and marketing is very simple. Selling focuses mainly on the firm's desire to sell products for revenue. Marketing is different from selling because marketing focuses on the needs of consumers, whereas selling focuses on the needs of the seller. In addition,
  • 39.
    39 the marketing conceptadvances the finical goals that the firm may have. The concept holds that if the consumer's needs and wants are very satisfied, then financial success will follow. The researcher agrees with this opinion. 2.3.10 Promotional Element Promotion concept From Etzel (2004) point of view the extent to which the product is promoted by the producer or intermediaries and the methods used are added considerations in pricing if major promotional responsibility is placed on retailers. Walker (2006) said that having an excellent product at a good price and in the right place is not enough. Sales goals will not be obtained unless the consumer is aware of the product's existence. There are several ways of doing this with promotion. Stutts and Wortman (2006) illustrated that have one single overriding common purpose: to fulfill a marking need. This need may be to build trial (new) business, develop a greater share of existing business, keep businesses, or get repeat business regardless of the type of promotion the objective is to help the overall marketing effort. Promotional mix Reid and Bojanic (2006) agreed with Reid (1989) in that the promotional mix elements include advertising, personal selling, sales promotion, and public relations. Sales promotion Schultz et al. (1993) stated that sales promotion: usually short-term tactical incentives offering something over and above the normal product offering to encourage customers to act in particular ways. Product-based sales promotions: sales promotions that centre on some kind incentive connected with the product: extra product free, or samples. In addition Reid (1989) agreed with Gottleb (1982) in that sales promotion is a direct inducement offering an extra incentive to
  • 40.
    41 take action. Salespromotions seek to accomplish several broad objectives and can be used for several reasons:  To increase consumer awareness  To introduce new products and services  To increase guest occupancy and customer counts.  To combat competition  To encourage present guests to purchase more.  To stimulate demand in no peak periods. 2.3.11 Services for Children Fast food restaurants and children Spurlock (2005) said that fast food chains make no secret of the fact that kids are their primary targets. Fast food restaurants are significantly more likely to be visited by respondents with children than those without. There is Happy Meal, launched nationally in 1979. It cost a buck in those days. Inside a cardboard box with a circus theme, kids found a McDonald stencil, a puzzle book, and a Mc Wrist wallet. The meal-plus-toys packaging proved to be an instant hit with the first star trek Happy Meals that very year. Hahm and Khan (2001) considered that parents with young children enjoy the conveniences of eating out, and they often take their young families to quick serve restaurants. They especially like to take their young families to those restaurants that are equipped with playgrounds or play areas, and those that offer give – always to their children. From Spurlock (2005) point of view, parents are their children's primary role models kids learn their life habits, good and bad, from their parents. Hahm and Khan (2001) stated that in the future healthy option for to – go kids meals could include carrot sticks instead of French fires, hand held yogurt stick such as Yoplait's Go-Curt, and flavored milks in aseptically packaged containers, these options meet the demand for hand held to – go food, but also provide a healthy alternative to traditional quick service restaurant menu items.
  • 41.
    41 2.3.12 Atmosphere (Surroundings) Atmosphere Briggs(2000) agreed with Pepper et al. (1984) in that atmosphere is the overall effect created by a restaurant's lighting, color scheme, furniture, and service. Wade (2006) highlighted that restaurant decor should support the overall concept and not be a haphazard collection of props, as the decor helps set the tone for the atmosphere.Wiley and Sons (2006) declared that a restaurateur who is largely dependent upon neighborhood business would do well to establish a friendly atmosphere, maintain consistent standards, and offer good value. A friendly greeting is the best possible start to a dining experience. People do not require heart, soul, and internal devotion, just a smile and a cheerful greeting. Cleanliness Pepper et al. (1984) stated that customers would stop coming if they feel a restaurant is not clean. Customers like to eat in clean surroundings. Constant attention to cleanliness keeps luncheonettes and chain restaurant dining areas attractive. Wade (2006) agreed with Negl (2002) in that the incidence of food-borne illness has increased as the food service system has become more complex and the number of operations has expanded. One case of food poisoning can seriously injure a restaurant's reputation. More than one can endanger an operation's survival. 2.3.13 Customer Satisfaction Customer satisfaction Johnson and Clark (2005) agreed with Cooper and Lawson (2004) in that satisfaction is the outcome of the consumer's evaluation of a service, which sometimes refer to as perceived service quality, and can be represented on a continue from delight to extreme dissatisfaction. Lillicrap et al. (2002) pinpointed the factors contributing to the meal experience were summarized. Factors, which might affect the customer's
  • 42.
    42 enjoyment of aspecific meal experience in a particular operation, could be:  The welcome, the décor, and the ambience.  Efficiency, has the booking been taken properly, using the customer's name.  Location of the table.  Menu and drinks list (presentation and cleanliness).  The order is been taken recognition of the host.  Availability of dishes / items.  Speed and efficiency of service.  Quality of food and drink.  Courteousness of staff.  Obtrusive / attentiveness of staff.  Ability to attract the attention of staff.  Other customer's behaviour.  Methods in which complaints are handled.  Methods of presenting bill / recovery payment.  Departure attentiveness. Schroeder (2004) told that customer satisfaction is a relative concept that varies from one customer to another. Also, a customer may be satisfied with today's products but not satisfied in the future. For example, while one customer may consider a Ford automobile perfectly satisfactory, another may not. Seidman and Johnson (2002) argued that customer satisfaction is regards as the highest mission by the chains. Johnson and Clark (2005) described that customer satisfaction is something that can be managed to some extent by influencing customers' perceptions and expectations of service delivery. This demands in-depth understanding of this subject. Pepper, et al. (1984) stated that satisfied customers are return customers, which means good business. Improving customer service and customer satisfaction Bateson (1995) mentioned that customer satisfaction is depends on the production of services as well as their consumption. Field (1999) pointed out that a common five – step process for developing a customer satisfaction program is:
  • 43.
    43  Identify theattributes of your product or service that are most important to customers.  Measure customer – satisfaction levels on these important attributes.  Link satisfactions levels to key customer behavior (use levels, member retention).  Identify and implement concrete actions that will improve customer satisfaction and correspondingly, customer behavior.  Track results. Reid and Bojanic (2006) illustrated that improving customer service should be a top priority of all managers working in the hospitality and tourism industry. Walker (2006) said that we not only need to keep guests happy during their stay, but also to keep them returning-with their friends. It costs several times more to attract new guests than to retain existing ones. Employee satisfaction Easerbrook (2006) agreed with Dube and Renaghan (1999) in that the best way to drive growth and profit is by looking after the company's staff. Healthy profit has to start with people, if you get the people part right, the rest will follow. Gregory and Brieiter (2001) found that satisfied employees are more likely to exhibit customer-oriented behavior, which in turn will lead to guest satisfaction. Seidman and Johnson (2002) agreed with Ghislli et al. (2001) in that job satisfaction as one key to turnover seems to be a job's characteristics.
  • 44.
  • 45.
    45 Materials and Methods Researchmethodology is the treatment that will be applied to the data collected. This includes the population, instrument, and analysis of the data. The aim of this chapter is to assign and define the limits of the sampling of the study, and to clarify the methods that will be used in this research in order to collect the desired information and data. 3.1. Materials 3.1.1. Population survey: The aim of this study is evaluating the experiment of the local restaurant chains compared to the international ones in Egypt. To obtain results representing enough the actual conditions. The research conducted three groups’ four samples from each group. Four samples from independent fast food restaurants in Sharm El Sheikh, four of the famous local fast food restaurants chains as well as four international chains in Sharm El Sheikh. 3.1.2. The Samples: 3.1.2.1. Samples from independent establishments (Quick Meals, Sharmawy Sharm, El Sheikh, Naama) 3.1.2.2. Samples from local establishments (Cook Door, Makani, Felfela, Gado) 3.1.2.3. Samples from international establishments (McDonald's,
  • 46.
    46 Burger King, Hardee's,KFC) Table 3: Samples from the establishments Old Sharm Hadaba Marina Samples from independent establishments Quick Meals 1 - - Sharmawy Sharm 1 1 - El Sheikh 2 - - Naama 1 - - Samples from local establishments Cook Door - 1 * Makani - 1 1 Felfela 1 - - Gado - 1 1 Samples from international establishments McDonald's - 1 2 Burger King - 1 - Hardee's - 1 1 KFC - 1 1 * Mean under preparation
  • 47.
    47 According Menu Specialtyof the selected QSR: Table 4: Menu specialty of the selected QSR. Restaurant Burger Pizza Chicken Snacks Sandwich Foul& Falafel Seafood Independent restaurants Quick Meals * - * * ** * * Sharmawy Sharm * - * * ** - - El Sheikh - - * * ** ** - Naama * - * * ** ** - Local restaurant chains Cook Door * - * * ** - - Makani - * * * ** - - Felfela * - * * ** * * Gado * - * * ** * * International restaurant chains McDonald's ** - * * ** - - Burger King ** - * * ** - - Hardee's ** - * * ** - - KFC * - ** * * - - - Not serving * Serving ** The core product Walker (2006) agreed with Brymer (1995) in that classifying.
  • 48.
    48 3.2. Methods The collecteddata has been divided into primary sources and secondary sources. Every type of this data will be illustrated and discussed in some details. 3.2.1. Primary Data Primary sources have been collected through the following methods: 3.2.1.1. Guest Questionnaire The guest questionnaire was designed and distributed at a sample of fast food guests. This questionnaire form has been developed based upon the relevant review of literature. The main purpose of this questionnaire is to know  How much does the guest like the fast food and at which meal he prefers.  The most important factor in a fast food restaurant which attracts the guest to select fast food chains.  Evaluation the local fast food restaurant chains experiment compared to the international chains.  The advantages and disadvantages in local fast food chains in Egypt.  Any problem has the guest ever met through his experiment with the local fast food restaurant chains? Questionnaire form distribution took nearly one year, starting at 15/9/2006 up till 1/8/2007. The questionnaire form was written and distributed in Arabic and English languages. The questionnaire form been shown in Appendix (A1).
  • 49.
    49 3.2.1.2. In-depth PersonalInterviews In- depth interviews were been carried out with the restaurants and chains managers under the investigation. The purposes of these interviews were:-  Identifying the guest evaluation for the fast food chains.  Egyptian market expectations, needs, and preferences of the Egyptian customer. And how do the chains deal with these needs and preferences?  Common attributes of local and international restaurant chains.  Training strategy in fast food ones.  Evaluating marketing strategies in fast food chains.  Evaluating quality levels in fast food chains, and what is quality assurance strategy in fast food chains.  The extent of product development according to customer needs in their chains.  Customer satisfaction measuring methods in fast food chains.  Strengths and weakness points in fast food chains. The in-depth personal interview are been shown in appendix (A2). 3.2.1.3. Observation Checklist The observation checklist has been designed to evaluate food service quality, cleanliness, atmosphere, staff and management performance. The checklist composed of six functional areas, which are: 1- Exterior 2- Interior 3- Food Quality 4- Guest Service 5- Employee Appearance 6-Managament Functions
  • 50.
    51 The observation checklisthas been shown in Appendix (A3). 3.2.2. Secondary sources All sources of secondary data been illustrated in the previous chapter "Review of Literature". The sources of secondary data include: 3.2.2.1. Government Publications This source includes the data mentioned by the Egyptian Ministry of Tourism and the Chamber of Tourism Establishments (CTE). 3.2.2.2. Periodicals and Books Books, theses, as well as periodicals such as, journal of food service business research™, Cornell quarterly, restaurant hospitality, and caterer and hotelkeeper and different articles from many sources. 1.2.2.3. Electronic Sources Internet websites related to the subject of research have been mentioned, illustrated and discussed. 3.2.3. Pilot study The thesis shows a research questionnaire and an interview which entailed three separate interviews with lecturer's and assistant lecturers from Helwan University, Faculty of Tourism and Hotel Management, Also entailed by McDonald's training consultancy team and their training managers, Americana Company, Gulf Aria human resource corporate manager, Cilantro, quality assurance managers and Cinnabon training manager. This helped towards shaping the final questionnaire and interviews. The pilot study of questionnaire has been conducted on a limited
  • 51.
    51 segment of guestsfrom independent restaurants, local and international fast food restaurant chains. The questionnaire form has been revised and adopted according to the guest’s comments. 1.2.3. Data Analysis Most data were then analyzed utilizing procedures of the SPSS (Statistical Package for Social Science) version 10.0 for windows. Frequencies standard deviation, percentages and cross-tabulation were calculated to determine which group differs significantly from each other and correlation between variables.
  • 52.
  • 53.
    53 4.1 Introduction The businessof food service deals with the preparation and service of food for consumption by others, whether the food is made from scratch or is convenience food products that are finished in microwave or deep fryer, whether the service is over the counter or at the table. Food service is "the service of food and beverages to internal and external guests in an efficient, safe and hygienic manner, and in a way that will create guest satisfaction" Food service may be defined as "that phase the food flow (that is, from the purchasing of the foods to service to the guest) mainly concerned with the delivery and presentation of the food to the guest, after the completion of the food production". In some situations food service may include an element of transportation due to the separation of the service facilities from the food production, for example of a centralized cook-freeze operation serving peripheral units. Food service establishments are those engaged in providing food service. These establishments include not only the obvious examples of restaurants and college dining halls but also the salad bars and sandwich counters in food markets and such" distant relations" as food vending machines. Food service enterprises range from full-service restaurants to self-service buffets, from fine restaurants to takeout operations, and from company cafeterias to hamburger stands. Quick service or fast food restaurant offer limited menus featuring food such as hamburgers, fries, hot dogs, various finger foods and other items for the convenience of people on to the go. Customers order their food at a counter under a brightly lit menu featuring color photographs of food items. Quick-service restaurants have increased in popularity because of their locations. They can usually be found in very convenient places in every possible area. Their menus are limited, which makes it easier for customers to make quick decisions on what
  • 54.
    54 to eat. 4.2 QuestionnaireResponse Rate The research targeted 1500 customers randomly in fast food operations. A total of 1248 usable replies were obtained, representing an effective response rate of 83.2 percent. Table 5: Questionnaire response rate Category Customers Number targeted 1500 Number shared 1248 Response rate 83.2 % 4.3 Questionnaire Analysis Results and Discussion The next evaluation of the questions is ranking according to the objectives of the questionnaire as follows.
  • 55.
    55 Question NO. (1):-Customers’ preferences to deal with fast food restaurants The aim of this question is to illustrate customers’ preferences to deal with fast food restaurants. Figure (1) shows this issue and illustrated that out of 1248 respondents who dealing with fast food restaurants; 16.3% of respondents deal with fast food restaurants always, 24.1% are usually preferred to deal with fast food restaurants usually. 45.2% of customers deal with fast food restaurants sometimes. While 14.4% of respondents indicated that they deal with fast food restaurants rarely. 16.3% 24.1% 45.2% 14.4% 0.0 10.0 20.0 30.0 40.0 50.0 AlwaysUsuallySometimesFew Figure 1: Customers preferences to eat fast foods. Cross tabulation analysis showed that 52.4% of category "from 15 to less than 25 years old" customers and 45.3% of category "from 25 to 40 years old " deal sometimes with fast food restaurants, while 33.3% of category "over 40 years old" respondents rarely deal with fast food restaurants. Also 44.4% of married with children customers and 47.4% of single respondents deal with fast food restaurants sometimes, besides 50% of female respondents and 43.1% of male respondents deal with fast food restaurants.
  • 56.
    56 Question NO. (2):-Customers' preferable meal The aim of this question is to illustrate customers' preferable meal. Data in table 6 show that most respondents prefer to have the lunch meal in fast food restaurants by mean 1.77. Statistically, X2 sig=0,000 showed a significant variances among respondent as (P<, 05) Finn et al. (2000). Breakfast meal came in the second position by mean 2.22 and std. deviation .94, while dinner was the least preferable meal to most of customers. Table 6: Customers' preferable meal Meal Mean Std. Error Std. Deviation Lunch 1.77 0.02 .80 Breakfast 2.22 0.03 .94 Dinner 2.29 0.02 .77 Cross tabulation analysis indicated that 37.5% of male respondents, 42.1% of single respondents and 37% of Egyptian customers indicated that breakfast was the most preferable meal to eat in QSRs. while 48.6% of male customers, 50% of married without children respondents and 52.2% of foreigner customers ensured that lunch was the most preferable meal. Finally, 31.3 of female customers, 25% of married without children respondents and 22.2% of Egyptian respondents enjoyed eating dinner in QSRs.
  • 57.
    57 Question NO. (3):-Customers' restaurants preferences The aim of this question is to illustrate customers' restaurants preferences. From the tabulated data in table (7), it could be noticed that local chain restaurants were the first category, which attracted most of customers by a mean of 1.87, and a std. deviation of .72. International chain restaurants came in the second position by a mean of 1.95 and a std. deviation of .92. The mean 2.32 highlighted that independent restaurants took the third place in the customers' restaurants preferences. Table 7: Statistics of customers' restaurants preferences Restaurant Mean Std. Error Std. Deviation Local chain restaurants 1.87 0.02 .72 International chain restaurants 1.95 0.03 .92 Independent restaurants 2.32 0.02 .84 Cross tabulation analysis indicated that 31.3% of female respondents, 25.9% of married with children respondents and 27.2% of Egyptian customers indicated that independent restaurants was the most preferable restaurants. In the other hand, 37.5% of male customers, 37% of married with children respondents and 35.8% of Egyptian customers ensured that local chain restaurants were the most preferable QSRs. Finally, 46.9 of female customers, 50% of married without children respondents and 65.2% of foreigner respondents enjoyed eating in international chain restaurants. Question NO. (4):- Customers reasons for restaurant type preference The aim of this question is to illustrate customers' reasons for restaurant type preference. From Figure (3), it could be noticed that 37% of respondents prefer international chain restaurants for the following reasons:
  • 58.
    58  Safe  Trust Cleanliness  Good promotions  Brand name  New product  Food quality  Consistence standard  Good location in every where  Good quality  Fast service  Atmosphere  Good price Besides, 38% of customers highlighted that they prefer local chain restaurants for the following reasons: Egyptian investment Know the source Egyptian traditional taste Trust Halal Quality Good service Good value Good price Safe Atmosphere Brand name Menu variety Only 25% of customers were satisfied with the independent restaurants' food for the following reasons:  Good price  Fair value  Egyptian taste  Delicious  Halal
  • 59.
    59  Fresh food Friendly service  Good quality  Atmosphere 25% 38%37% 0 10 20 30 40 Independent resturants Local chains resturants International chain resturants Figure 2: Customers' reasons for restaurants type preferences This agreed Lan, and Khan (1995) with see page 10. Question NO. (5):- Important factors in QSR that attract customer The aim of this question is to show important factors in QSR that attract customer. Data in Table (8) showed statistics (means, standard deviations, standard error) of important factors in QSR that attract customer. Table 8: Statistics of important factors in QSR that attract customer Important factors Mean Std. Error Std. Deviation X2 signification Food quality 4.40 0.03 .95 0.00 price 4.11 0.03 .95 0.00 Service quality 3.90 0.03 1.01 0.00 Consistence Standard 3.60 0.03 1.13 0.00 Atmosphere 3.48 0.04 1.25 0.00 Brand name 3.30 0.04 1.31 0.01 Menu variety 3.17 0.03 1.11 0.00 Location 3.11 0.03 1.00 0.00 Promotional 2.71 0.04 1.29 0.00
  • 60.
    61 activities Results indicated thatthe variables food quality, price and service quality were the first three important factors in QSRs that attract customers by means of 4.40, 4.11 and 3.90, respectively. Consistence standard, atmosphere and brand name came in the second position by means of 3.60, 3.48 and 3.30, respectively. The means of 3.17 and 3.11 highlighted that menu variety and location respectively took the third place in the customers' restaurant preference, while promotional activities were the last factor by a mean of 2.71 to choose restaurant. Statistically X2 sig=0,000 showed a significant variation among respondent as (P<, 05). This agreed with Ball (1992).see page 7. However, the X2sig=0,000 for the other factors indicated that there was a significant variation among respondents (P<, X2sig, 05) as follow: 2.9% 3.8% 26.9% 32.7%33.7% 4.8% 11.5% 28.8% 28.8% 26.% 8.7% 11.5% 30.8% 21.2% 27.9% 0.0 5.0 10.0 15.0 20.0 25.0 30.0 35.0 40.0 1 =Least im portant Low im portantIm portantHigh im portant5 =Most im portant Service quality Consistence Standard Atmosphere Figure 3: Important factors in QSR that attract customer (service Quality, consistence standard and atmosphere) Figure 3 shows that 93.3% (Important, High important & most important) of the respondents ranked service quality as an important factor in QSR that attracts customers, 83.6% of them gave the same rank to consistence standard variable and 79.9% (Important, High important & most important) of customers indicated the above ranks to atmosphere variable, while, only 6.7, 16.3 and 20.2% (Low important & least important) of respondents ranked service quality, consistence
  • 61.
    61 standard and atmosphere,respectively, as the lowest important factors. Agreed with Noel and Cullen (1996), see, p.14. Figure 4: Important factors in QSR that attract customer (Brand name and menu variety) Figure 4 highlighted that 74% (important, High important& most important) of respondents indicated that brand name is an important factor to chose a restaurant. 71.2% of them gave the same rank to menu variety variable, While 26% and 28.9% (Low and Least important) of respondents ranked brand name and menu variety respectively as the lowest important factors. 4.8% 22.1% 39.4% 25% 8.7% 25% 16.3% 31.7% 16.3% 10.6% 0.0 5.0 10.0 15.0 20.0 25.0 30.0 35.0 40.0 45.0 Least important Low important ImportantHigh important Most important Location Promotional activities Figure 5: Important factors in QSR that attract customer (Location and promotional activities) Figure 5 illustrates that 73.1% (Important, high important & most important) of the respondents indicated that the location is an important factor to choose a restaurant. While, 58.6% of them gave the 22.1% 14.4% 25%23.1% 26.9% 33.7% 12.5% 23.1% 13.5% 5.8% 0.0 5.0 10.0 15.0 20.0 25.0 30.0 35.0 Least important Low important ImportantHigh important Most important Brand name Menu variety
  • 62.
    62 same rank topromotional activities variable, 26.9, and 41.3% (Low and least important) of the respondents are ranked the location and promotional activities, respectively, as the lowest important factors. Question NO. (6):- Restaurant important categories factors' evaluation The aim of this question is to illustrate Restaurant categories factors' evaluation. From the table (9) it could be showed statistics of different restaurant categories in the study. Table 9: Statistics for restaurants factors' evaluation Independent Local chain International chain Important factors Mean Std. Deviatio n Mean Std. Deviati on Mean Std. Deviat ion Brand name 2.32 1.30 3.63 0.93 4.19 1.09 Location 2.63 1.33 3.55 0.97 4.07 1.07 Price 3.91 1.33 3.73 1.06 3.37 1.37 Food quality 2.93 1.38 3.87 1.07 4.22 0.94 Service quality 2.68 1.27 3.56 0.97 3.95 1.03 Consistence Standard 2.48 1.28 3.51 0.97 4.03 1.01 Menu variety 2.85 1.38 3.25 0.99 3.65 1.25 Atmosphere 2.27 1.18 3.12 1.04 3.80 1.16 Promotional activities 1.57 1.00 2.85 1.03 3.78 1.30 All factors statistics 2.63 0.28 3.5 0.09 3.89 0.34 Results proposed that the respondents evaluated all factors in independent restaurants as neutral factors by a grand mean of 2.63, while they evaluated the same factor in local chain restaurants and international chain restaurants as high level factors by a grand means 3.5 & 3.89, respectively (see table 9).
  • 63.
    63 From the tabulateddata in Table (10) it could be illustrated customers' ranking of preferable factors for different restaurant categories according to their means. Table 10: Restaurant categories factors' ranking According to their means Independent factors Mean Local chain factors Mean International chain factors Mean Price 3.91 Food quality 3.87 Food quality 4.22 Food quality 2.93 Price 3.73 Brand name 4.19 Menu variety 2.85 Brand name 3.63 Location 4.07 Service quality 2.68 Service quality 3.56 Consistence standard 4.03 Location 2.63 Location 3.55 Service quality 3.95 Consistence standard 2.5 Consistence standard 3.51 Atmosphere 3.80 Brand name 2.32 Menu variety 3.25 Promotional activities 3.78 Atmosphere 2.27 Atmosphere 3.12 Menu variety 3.65 Promotional activities 1.57 Promotional activities 2.85 Price 3.37 Results highlighted that price was the first preferable factor by the respondents for independent restaurants and they ranked it as a high level factor. Food quality, menu variety, service quality, location and consistence standard were respectively the second preferable factors by respondents in the independent restaurants, where customers ranked them as neutral factors by means ranged from 2.5 to 2.93. Brand name, atmosphere and promotional activities were the lowest level factors indicated by the respondents for independents restaurants. However the customers evaluated food quality, price, brand name, service quality, and location and consistence standard respectively, as high level factors to choose a local chain restaurant, while they ranked menu variety, atmosphere and promotional activities at the last position respectively, as neutral factors to eat in local chain restaurants.
  • 64.
    64 Finally, the respondentsevaluated the most attractive factors in international chain restaurants as follows; food quality, brand name, location, consistence standard, service quality, atmosphere, promotional activities and menu variety respectively. Price was the last factor mentioned by customers; where they ranked it as a neutral factor. X2 sig=0,00 illustrated that there is a significant variation between respondents' evaluation for restaurant categories' factors according to (P<,05) as follows:
  • 65.
    65 Brand name From theFigure 6, it could be noticed that international chain restaurants took the highest level among restaurant categories with that factor by 79.8% (Highest level & high level) of respondents. While local restaurant chains are in the second position by 54.8% (Highest level & high level) of them. Only 21.2% (Highest level & high level) of customers ranked brand name factor in independent restaurants as high-level factor. In the other side, 59.6% (Low level & lowest level) of respondents mentioned that independent restaurants had unknown brand name 37.5% 7.7% 13.5% 19.2% 22.1% 1.9% 19.2% 35.6% 36.5% 6.7% 4.8% 52.9% 26.9% 11.5% 3.8% 0.0 10.0 20.0 30.0 40.0 50.0 60.0 Lowest levelLow levelNeutralHigh levelHighest level Independent Local chains International chains Figure 6: Brand name factor's evaluation in QSRs. See Brand concept According to King and Ronald (2006), p.21. From the researcher point of view brand name is very important to built and to keep it.
  • 66.
    66 Location Figure 7 showscustomers' evaluation of locations for different restaurant categories. 27.9% 18.3% 27.9% 14.4% 11.5% 3.8% 6.7% 36.5%36.5% 16.3% 2.9%4.8% 22.1%23.1% 47.1% 0.0 5.0 10.0 15.0 20.0 25.0 30.0 35.0 40.0 45.0 50.0 Lowest levelLow levelNeutalHigh levelHighest level Independent Local chains International chains' Figure 7: Location factor's evaluation in QSRs. Results illustrated that 70.2% (Highest level & high level) of customers indicated that international chain restaurants had the most attractive locations. While the local chain restaurants took the second position by 52.8% (Highest level & high level) of them. Only 25.9% (Highest level & high level) of the respondents evaluated independent restaurants' locations as good places. In the other hand, 46.2% (Low level & lowest level) of customers unaccepted independent restaurants' locations. This agreed with Ridgeway and Ridgeway (1994). See page, 15.
  • 67.
    67 9.6% 6.7% 15.4% 19.2% 49% 2.9% 9.6% 26.9% 32.7%27.9% 11.5% 16.3% 27.9% 12.5% 31.7% 0.0 10.0 20.0 30.0 40.0 50.0 60.0 Lowest levelLow levelNeutalHighlevelHighest level Independent Local chains International chains Price From the figure 8 it could indicate customers' evaluation of price factor for different restaurant categories. Figure 8: Price factor's evaluation in QSRs. Results indicated that price was the most effective factor in independent restaurants; 68.2% (Highest level & high level) of the respondent proposed that the price in independent restaurant was reasonable. 60.6% (Highest level & high level) of the customers mentioned that local chain restaurants provide a logical price. International chain restaurants were in the third position by 44.2% (Highest level & high level) of the respondents expected that they provide rational price. The researcher agreed that the price has a tremendous impact on the success or failure of a product. Etzel (2004). See page 16.
  • 68.
    68 Food quality Figure 9shows customers' evaluation of food quality factor for different restaurant categories. Figure 9: Food quality factor's evaluation in QSRs. Results illustrated that, 77.9% (Highest level & high level) of the customers indicated that international chain restaurants had the maximum food quality level. While the local chain restaurants took the second position by 69.2% (Highest level & high level) of them. Besides, 37.5% (Highest level & high level) of respondents evaluated independent restaurants' food quality as a top level. In the other hand, 38.4% (Low level & lowest level) of customers disagreed with independent restaurants' food quality level. The researcher agree with that keeping consistency of food quality is a though task for all service restaurant in QSR chains Seidman and Johnson (2002). See page 13. 22.1% 16.3% 24.1% 21.2% 16.3% 4.8%4.8% 21.2% 37.5% 31.7% 1.9%1.9% 18.3% 27.9% 50% 0.0 10.0 20.0 30.0 40.0 50.0 60.0 Lowest levelLow levelNeutalHigh levelHighest level Independent Local chains International chains
  • 69.
    69 Service quality Figure 10shows customers' evaluation of service quality factor for different restaurant categories. Figure 10: Service quality factor's evaluation in QSRs. Results highlighted that, service quality was the most effective factor in international chain restaurants by 64.4% (Highest level & high level) of customers, While 50% (Highest level & high level) of the respondents were satisfied with service quality in local chain restaurants. Besides, 28.9% (Highest level & high level) of customers agreed with service quality in independent restaurants. In the other side, 45.2% (Low level & lowest level) of the respondents were unsatisfied with the level of service quality offered in independent restaurants. Service is an intangible product that sold or purchased in the marketplace. Reid and Bojanic (2006). See page 14 24% 21.2% 26% 20.2% 8.7% 3.8%4.8% 41.3% 31.7% 18.3% 2.9%2.9% 29.8% 25% 39.4% 0 5 10 15 20 25 30 35 40 45 Lowest levelLow levelNeutalHigh levelHighest level Independent Local chains International chains
  • 70.
    71 Consistence standard Figure 11shows customers' evaluation of consistence standard factor for different restaurant categories. Figure 11: Consistence standard factor's evaluation in QSRs. Results illustrated that, 71.1% (Highest level & high level) of the customers ensured that international chain restaurants had a consistence standard level for their products and services, 49% and 16.3% (Highest level & high level) of them claimed the same result for local chain restaurants and independent restaurants respectively. But, 50% (Low level & lowest level) of the customers mentioned that independent restaurants had no consistence standard level. Zero defects is the standard that service organizations must set this very high standard. Noel and Cullen (1996). See page 14. 29.8% 20.2% 33.7% 4.8% 11.5% 1.9% 11.5% 37.5% 31.7% 17.3% 1.9%5.8% 21.2% 29.8% 41.3% 0.0 5.0 10.0 15.0 20.0 25.0 30.0 35.0 40.0 45.0 Lowest levelLow levelNeutalHigh levelHighest level Independent Local chains International chains
  • 71.
    71 Menu variety Figure 12shows customers' evaluation of menu variety factor for different restaurant categories. Figure 12: Menu variety factor's evaluation in QSRs. Results indicated that, 51% (Highest level & high level) of the customers claimed that international chain restaurants provide a variety of choices in their menu, and 35.6 and 35.6% (Highest level & high level) of them ensured the same results for local chain restaurants and independent ones, respectively. But, 38.5 and 22.1% (Low level & lowest level) of the customers were disagreed with the above result for independent restaurants and local chain ones, respectively. Walker (2006) highlighted that quick-service restaurant menus are limited, which makes it easy for customers to make quick decisions on what to purchase. While the researcher agree with Ball (1992) in that QSRs may be provided in product range offered or by variations in one basic product (dressings, fillings, supplements). See page 5, 7. 26% 12.5% 26% 22.1% 13.5% 1.9% 20.2% 42.3% 22.1% 13.5% 5.8% 11.5% 31.7% 13.5% 37.5% 0 5 10 15 20 25 30 35 40 45 Lowest levelLow levelNeutalHigh levelHighest level Independent Local chains International chains
  • 72.
    72 Atmosphere Figure 13 indicatesthat, 62.5% (Highest level & high level) of the customers claimed that international chain restaurants had the most attractive atmosphere, as 37.5 and 14.4% (Highest level & high level) of them ensured the same results for local restaurant chains and independent restaurants, respectively. On the other side, 53.8%, 28.9 and 13.5 (Low level & lowest level) of respondents were disagreed with the above results for independent restaurants, local restaurant chains and international restaurant chains, respectively. Figure 13: Atmosphere factor's evaluation in QSRs. The researcher agreed with Wiley and Sons (2006). that a friendly atmosphere, maintain consistent standards, and offer good value. A friendly greeting is the best possible start to a dining experience. See page 28. 37.5% 16.3% 31.7% 10.6% 3.8% 5.8% 23.1% 33.7% 28.8% 8.7% 4.8% 8.7% 24% 26.9% 35.6% 0.0 5.0 10.0 15.0 20.0 25.0 30.0 35.0 40.0 Lowest levelLow levelNeutalHigh levelHighest level Independent Local chains International chains
  • 73.
    73 Promotional activities Figure 14showed customers' evaluation of promotional activities factor for different restaurant categories. Figure 14: Promotional activities factor's evaluation in QSRs. Results indicated that, 66.4% (Highest level & high level) of the customers claimed that international chain restaurants had the most attractive promotional activities, as 23 and 4.8% (Highest level & high level) of them ensured the same result for local restaurant chains and independent restaurants respectively. On the other hand, 80.8, 35.6 and 16.4 % (Low level & lowest level) of the respondents were disagreed with the above results for independent restaurants, local chain restaurants and international chain restaurants, respectively. The researcher agrees with that having an excellent product at a good price and in the right place is not enough. Sales goals will not be obtained unless the consumer is aware of the product's existence. There are several ways of doing this with promotion.Walker (2006).see page 26. 70.2% 10.6% 14.4% 1.9%2.9% 9.6% 26% 41.3% 16.3% 6.7% 10.6%5.8% 17.3% 27.9% 38.5% 0.0 10.0 20.0 30.0 40.0 50.0 60.0 70.0 80.0 Lowest levelLow levelNeutalHigh levelHighest level Independent Local chains International chains
  • 74.
    74 Question NO. (7):-Customers' evaluation for the experiment of local fast food restaurant chains. The aim of this question is to illustrate customers' evaluation for the experiment of local fast food restaurant chains. The mean of 1.4 and standard deviation of 0.49 proposed that the most of respondents found the experiment of local fast food restaurants as successful. Figure 15: Customers' evaluation for the experiment of Egyptian QSRs. Figure 15 shows that 59.6% of the customers indicated that the experiment of local fast food restaurants is successful, while 40.4% of them mentioned that the experiment is acceptable. The researcher agrees with that the experiment of local fast food restaurant chains is successful. 59.6% 40.4% 0 10 20 30 40 50 60 SuccessfulAcceptable
  • 75.
    75 Question NO. (8):-Advantages and disadvantages of local fast food restaurant chains. The aim of this question is to illustrate customers' evaluation for the advantages and disadvantages of local fast food restaurant chains. Results highlighted that 21.2% of the respondents had no experience to know the advantages and disadvantages of local fast food restaurant chains. While, 78.8% of customers had enough experience to indicate the advantages and disadvantages of local fast food restaurant chains as follows: A- Advantages:  Egyptian investment  Know the source  Egyptian taste  Trust  Halal  Quality  Good service  Good value  Good price  Save  Atmosphere  Brand name  Menu variety  Specialist  Suitable for youth B- Disadvantages:  Few promotional activities.  Not very strong marketing  Doesn’t have a very strong brand name.  Low level of consistence standard  Not very well atmosphere.  Few outlets, limited locations  Service time is not always fast
  • 76.
    76  Price notreasonable for many segments in the society  Nutritional facts aren’t shown for the guest.  Not serve soups, or fruits.  Need more care of kids  Need more attention for the languages level (English, Russian, and Italian).  Need to offer more services for the guest such as Wi – Fi, art channels, and visa card payment.  Need to have hot line.
  • 77.
    77 Question NO. (9):-Customers' problems with local fast food restaurant chains. The aim of this question is to illustrate customers' problems with local fast food restaurant chains. As Figure 16 presents this issue and illustrates that 48% of the respondents had no problems with Egyptian fast food restaurant chains. Yes 52% No 48% Figure 16: Customers' problems with Egyptian QSRs. However, 52% of customers had real problems during their experience with local fast food restaurant chains; and these problems include:  Late ordered.  Cold food.  Long service time.  Low service level.  Wrong order.  Some items in the menu but not available.  Their no enough care about special order.  Low level of cleanliness.  No consistence standard.  There is no kids’ corner.  There is not a non-smoking corner.  There is not a family corner.  Chairs aren’t comfortable.  Tables aren’t stabilized.
  • 78.
    78  Need moreattention for the languages level (English, Russian, and Italian).  Nutritional facts aren’t shown for the guest.  More care about nutrition value should be taken.  Need more variety in soups, salads, and fresh fruits fresh vegetables, cereals, and other group products.  Need more variety for the kid's fun box and toys for the children meals.  The price of the meal should be related according to perceived value for money and be in line with customer's expectations.  Home delivery need to be covering most the distances, Single- telephone-number systems in delivery firms use computerized guest histories to facilitate order taking, could make the order through the internet.  Need more care about carhop, drive in, and drive through services.  Credit card payment should be acceptable, and credit card machine should be available.  New product should be frequency every limited period.  Creating a web site, hot line or other advertisement that makes the users meeting with your product or service memorable, fun or useful.  Need enough area for the youth (comfortable chairs, ART channels, Wi- Fi wireless connection with the Internet.  More care for the kids (kid's meals, kid's gifts, kid's birthdays, kid's area, and kids in the school.
  • 79.
    79 Question NO. (10):-Customers' suggestions and recommendations. The main aim of this question is to guess customers' suggestions and recommendations. Results highlighted that, 24% of the respondents had no experience to propose suggestions and recommendations. In the other side, 76% of the customers had enough experience to indicate some suggestions and recommendations include the following:  Should have corporation for the restaurant staff avoid individualism.  More attention for staff selecting.  Listen to your staff and your guests and chair them.  More attention for the languages level (English, Russian, Italian).  Need more awareness of personnel hygiene and sanitation.  Staff should be aware of the standard importance.  Make changes when you need to.  Marketing research study and customer needs analysis should be frequency.  Chains should be aware of market new trends.  The effective use for the Internet through survey, or questionnaire for the guest through the Internet.  A name must be memorable and should be easy to pronounce.  A logo is the restaurant's identifying mark that the public will recognize.  The price of the meal should be related according to perceived value for money and be in line with customer's expectations.  Nutritional facts should be shown for the guest chain should include nutritional information on the packaging of all of its products.  Fresh juices, decaffeinated, water or low fat milk making good choices when the guest are eating out will help the guest maintain a healthy diet care about nutrition value should be taken.  More variety in soups, salads, and fresh fruits, fresh vegetables, cereals, and other group products.  Special meals for diabetic, heart problems, high blood, sports, healthy food items.
  • 80.
    81  More carefor the kids (kid's meals, kid's gifts, kid's birthdays, kid's area, and kids in the school.  Soda is highly caloric and not nutritious – kids should have water or milk instead.  Avoid chicken nuggets – fried nuggets are sorry imposters of very chicken  Skip the fries - consider taking along a bag of mini carrots, grapes or other fruits and vegetables to have instead. This will add vitamins and fiber to the meal.  Order the kids meal with some substitutions.  In sit-down restaurants, help them for chicken and vegetables rather than a big plate of macaroni and cheese.  Chain should not try to find more customers for its products, but to find more products for its customers.  Home delivery need to be covering all the distances, single- telephone-number systems in delivery firms use computerized guest histories to facilitate order taking, could make the order through the internet.  Development of, drive in, and drive through services.  Credit cards are convenient to the guest, credit card payment should be acceptable, and credit card machine should be available.  New product should be frequency every limited period.  Creating a web site, hot line or other advertisement that makes the users meeting with your product or service memorable, fun or useful.  Need enough area for the youth (comfortable chairs, ART channels, Wi- Fi wireless connection with the Internet.  More care about catering for banks, schools, factories.  Customer feedback is vital to improve product quality.  Value is a big lure.  Chains have to reach the customer in a way that is compatible with their beliefs, language, needs and expectations.  To be flexible with the changing times, chains have to be flexible with the needs of the guest.  Aligning your customer service with your brand is the best way
  • 81.
    81 to build asolid relationship.  More and more sales are taking place in trade outlets such as forecourt shops and convenience stores.  Dealing well with problems and queries.  Providing a personal touch.  Customers expect fast foods to be served quickly.  Mention portion control, plate design. Personal data analysis.-Question NO. (11): Table 11: Personal data analysis. Variables Categories Percent Gender Male Female 69.2% 30.8% Level of age Less than 25 years From 25 to 40 More than 40 40.3% 51% 8.7% Martial status Single Married without children Married with children 54.8% 19.2% 26% Nationality Egyptian Foreigner 77.9% 22.1%
  • 82.
    82 4.4 Interview ResponseRate Out of 42 fast food restaurants' managers in Sharm El Sheikh (study population), 36 of them accepted to make interview with the researcher and they appear greet cooperation with the researcher, only 8 persons apologized to make interview with the researcher saying that they are not ready to deal with the researcher as they are too busy. Table 12: Interview's response rate Category Independent Local chains International chains Total Number targeted 12 16 16 44 Number shared 9 15 12 36 Response rate 75 % 93.8 % 75 % 81.8 % 4.5 Interview Analysis Results and Discussion The next analysis of the questions is ranking according to the objectives of the interview as follows.
  • 83.
    83 Question NO. (1):-Managers evaluation for QSRs in Egypt The main aim of this question is to illustrate managers’ evaluation for QSRs in Egypt. Figure 17 helps this aim and highlights that 88.9% of managers accepted the fast food chains in Egypt as a successful experiment, while; only 11.1% of the respondents indicated that it was acceptable. 11.1% 88.9% 0.0 20.0 40.0 60.0 80.0 100.0 SuccessfulAcceptable Figure 17: Managers evaluation for QSRs in Egypt. Restaurant managers proposed the following reasons for that success:  Operations provide fast service with good quality.  Good meals with cheap prices  Very famous, very clean and trust.  Customers can find it in every place and it's easy to deal with.  The man and woman are working and there is no time for cooking.
  • 84.
    84 38.9% 61.1% 33.3%36.1%38.9% 0.0 10.0 20.0 30.0 40.0 50.0 60.0 70.0 Healthy and good meal Goodand fast service Good qualityCheap prices and fair value Others Question NO. (2):- Egyptian market expectations about fast food concept. The main aim of this question is to guess the Egyptian market expectations about fast food concept. Data in Figure 18 showed restaurant managers' viewpoint about the expectations of Egyptian market about fast food concept. Figure 18: Egyptian market expectations about fast food concept. Results indicated that, 38.9% of managers mentioned that customers expect a healthy and good meal, 61.1% of them proposed that customers want good and fast service, good quality is a prerequisite for customers as listed by 33.3% of managers, and 36.1% of the respondents claimed that cheap prices and fair value is the essential prerequisite for customers. Finally, 38.9% of the managers highlighted other reasons include the followings:  Continuous development for the operations.  Good style and decorations.  Good promotion.  Meeting customers demanded.  The market accepts more fast food operations.
  • 85.
    85 Question NO. (3):-Egyptian customers' needs and preference The main aim of this question is to guess the managers opinion about the Egyptian customers' needs and preference. The data in figure 19 helped that aim and illustrated that 61.1% of the managers mentioned that customers need a meal with a good value and a cheap price, 33.3% of them proposed that customers want big quantity meal, while fast and friendly service is a prerequisite for customers as listed by 47.2% of managers, as, 22.2 and 19.4% of the respondents claimed that attractive atmosphere and good and near places for friend meeting, respectively, which are the essential prerequisite for customers. Finally, 22.2% of the managers highlighted other needs and preferences include the followings:  Providing new trends.  Local products, traditions taste.  Hospitality and good treatment.  Restaurants' reputation. 61.1% 33.3% 47.2% 22.2%19.4% 21.2% 0.0 10.0 20.0 30.0 40.0 50.0 60.0 70.0 Good valu and cheap prices Big quantityfast and fiendly service Attractive atmosphere Good and near places for friend meetings Others Figure 19: Egyptian customers' needs and preferences.
  • 86.
    86 Question NO. (4):-Managers' ways of dealing with customers' needs and preferences. The main aim of this question is to illustrate managers' ways of dealing with customers' needs and preferences. Figure 20 showed managers' ways to deal with customers' needs and preferences in fast food operations. 47.2% 55.6% 41.7% 19.4%17.5% 0.0 10.0 20.0 30.0 40.0 50.0 60.0 Offering good quality withgood value Offering good service Trying to meet customers' exepectaions Research studyOthers Figure 20: Managers' ways to deal with customers’ needs and preferences. Results highlighted that, offering good service and offering good quality with good value were the most common ways used by managers to deal with customers' needs with percents 55.6 & 47.2% ,respectively. 41.7% of managers were trying to meet customers' expectations, and 19.4% of them used research study to expect customers' needs and deliver it. Some managers (17.5%) provided other solutions to handle customers needs include the followings:  Continues training.  Providing standardizations.  Handling customers' problems.  Product and place development.
  • 87.
    87 Question NO. (5):-International Chain restaurants' attributes. The main aim of this question is to illustrate international chain restaurants' attribues. Data in figure 21 supported this aim and illustrated managers' viewpoint about the common attributes for international fast food restaurant chains in Egypt. 36.1% 44.4% 33.3% 47.2%44.4% 19.7% 0.0 5.0 10.0 15.0 20.0 25.0 30.0 35.0 40.0 45.0 50.0 Marketingand promotional activities Famousand brandname International, trustandin everywhere Goodservice and standardization Standard service Others Figure 21: International chain restaurants' attributes. Results illustrated that 36.1% of the managers mentioned that the most common attributes of international chain restaurants were marketing and promotional activities, 44.4% of them proposed that famous and brand name variable was one of international chain restaurants' attributes. Besides, 47.2, 44.4 and 33.3% of the respondents claimed that good service & standardization, standard service, and international, trust in every where, respectively, were included by the managers to the most international chain restaurants' attributes. Finally, 19.7% of the managers highlighted other attributes for international fast food restaurants include the followings:  Specialist.  Good management.  Training and research center.  Apply good services for the youth such as comfortable chairs, attractive TV channels, and Internet services.
  • 88.
    88  Special careabout the children ( kids corner – kids meals – kids toys).  Apply special dishes or sandwiches meet the Egyptian traditions (kofta –falafel – shawerma).  Good crises management polices.  Care about Egyptian habits and sharing festivals.  Respect the believes and religions ( no wine – no pork).  Employing the national people. Question NO. (6):- Managers' evaluation for local fast food operations. The main aim of this question is to illustrate managers' evaluation for local fast food operations. As shown in figure 22, that 83.3% of the managers accepted the local fast food restaurants in Egypt as a successful operation, while; only 16.7% of the respondents indicated that it was acceptable. 16.7% 83.3% 0.0 20.0 40.0 60.0 80.0 100.0 SuccessfulAcceptable Figure 22: Managers' evaluation for local fast food operations. Restaurant managers proposed the following reasons for that success:  Good quality and good price.  Following good management style.  Unique locations and decoration.  Application of chains systems.  Meet the Egyptian traditions.
  • 89.
    89 Question NO. (7):-Managers' opinions in using international concept by local fast food operations. The main aim of this question is to illustrate managers' opinions in using international concept by local fast food operations. Figure 23 shows this issue. 58.3% 41.7% 0.0 20.0 40.0 60.0 AgreeDisagree Figure 23: Managers' opinions in using international concept by local fast food operations. Results proved that, 58.3% of the respondents disagreed with that local fast food operation use international concept for the following reasons:  No need for making copies.  They should be different.  It's better to add more.  They can take only management system.  Not meet our habits.  Should have special taste.  Must be independent personality. In the other hand, 41.7% of the managers accepted that local fast food restaurants use international concept for the following reasons:  Good concept and successful system.  Good management system.  Standardization.  Good hospitality concept.  Meet customers' needs.
  • 90.
    91  Standard qualityand standard service.  Standard promotional activities. Question NO. (8):- Managers' evaluation of restaurant categories factors The main aim of this question is to illustrate managers' evaluation of restaurant categories factors. From the tabulated data in table (13), it could be noticed the statistics of different restaurant categories in the study. Table 13: Statistics of restaurants factors' evaluation Independent Local chain International chain Important factors Mean Std. Deviation Mean Std. Deviation Mean Std. Deviation Brand name 2.5 1.32 4.3 0.74 4.8 0.41 Location 2.6 1.18 4.1 0.68 4.7 0.55 Price 4 1.29 4.3 0.68 3.1 1.08 Food quality 3.2 1.18 4.4 0.65 4.2 0.70 Service quality 2.5 1.06 4 0.86 4.3 0.96 Consistence Standard 2.5 1.38 3.8 0.78 4 0.77 Atmosphere 1.5 0.83 3.5 1.02 4.8 0.44 Promotional activities 2.5 1.32 4.3 0.74 4.8 0.41 All factors statistics 2.7 0.71 4.03 0.31 4.3 0.54 Results proposed that the respondents evaluated all factors in independent restaurants as neutral factors by a grand mean of 2.7, while they evaluated the same factors in local chain restaurants and international chain ones as high level factors by grand means of 4.03 & 4.3, respectively. Statistically, X2 sig=0,00 illustrated that there is a significant variation between respondents' evaluation for restaurant categories' factors according to (P<,05).
  • 91.
    91 Table (14) illustratedmanagers' ranking of preferable factors for different restaurant categories according to their means. Table 14: Restaurant categories factors' ranking according to their means. Independent factors Mean Local chain factors Mean International chain factors Mean Price 4.0 Food quality 4.4 Brand name 5 Food quality 3.2 Brand name 4.3 Promotional activities 4.8 Location 2.6 Price 4.3 Location 4.7 Service quality 2.5 Location 4.1 Consistence standard 4.4 Brand name 2.5 Service quality 4.0 Atmosphere 4.3 Atmosphere 2.5 Atmosphere 3.9 Service quality 4.3 Consistence standard 2.5 Consistence standard 3.8 Food quality 4.2 Promotional activities 1.5 Promotional activities 3.5 Price 3.1 Results highlighted that, price was the first preferable factor by the respondents for independent restaurants and they ranked it as a high level factor. Food quality, location, service quality, brand name, atmosphere and consistence standard were respectively the second preferable factors by the respondents in the independent restaurants, managers ranked them as neutral factors by means ranged from 2.5 to 3.2. Promotional activities were the lowest level factor indicated by the respondents for independents restaurants. In the other hand, the managers evaluated food quality, brand name, price, service quality, location and atmosphere respectively, as high level factors to choose a local chain restaurant, besides; they ranked consistence standard respectively, as high level factors to eat in local chain restaurants and promotional activities at last position. Finally, respondents evaluated the most attractive factors in international chain restaurants as follows; brand name, promotional
  • 92.
    92 activities, location, consistencestandard, atmosphere, service quality, and food quality respectively. Price was the last factor mentioned by managers; they ranked it as neutral factor. X2 sig=0,00 illustrated that there is a significant variation between respondents' evaluation for restaurant categories' factors according to (P<,05) as follow: Brand name Figure 24 highlighted that international chain restaurants took the highest level among restaurant categories with that factor by 100% (Highest level & high level) of respondents, while local chain restaurants had the second position by 83.4% (Highest level & high level) of them. Only 25% (Highest level & high level) of managers ranked brand name factor in independent restaurants as high-level factor. In the other side, 54.2% (Low level & lowest level) of the respondents mentioned that independent restaurants had unknown brand name 29.2%25%20.8% 16.7% 8.3% 16.7% 41.7%41.7% 20.8% 79.2% 0.0 10.0 20.0 30.0 40.0 50.0 60.0 70.0 80.0 90.0 Lowest levelLow levelNeutralHigh levelHighest level Independent Local chains' Internationalchains Figure 24: Managers' evaluation of brand name factor in QSRs.
  • 93.
    93 Location Figure 25 showsmanagers' evaluation of locations for different restaurant categories. Figure 25: Managers' evaluation of location factor in QSRs. Results illustrated that, 95.8% (Highest level & high level) of the managers indicated that international chain restaurants had the most attractive locations. While the local chain restaurants took the second position by 83.4% (Highest level & high level) of them. Only 25% (Highest level & High level) of the respondents evaluated independent restaurants' locations as good places. In the other hand, 50% (Low level & lowest level) of the managers unaccepted independent restaurants' locations. 20.8% 29.2%25% 20.8% 4.2% 16.7% 54.2% 29.2% 4.2% 20.8% 75% 0.0 10.0 20.0 30.0 40.0 50.0 60.0 70.0 80.0 Lowest levelLow levelNeutralHigh levelHighest level Independent Local chains International chains
  • 94.
    94 Price Figure 26 showsmanagers' evaluation of price factor for different restaurant categories. Figure 26: Managers' evaluation of price factor in QSRs. Results indicated that, price was the most effective factor in independent restaurants; 70.8% (Highest level & high level) of the respondent proposed that the price in independent restaurant was reasonable. 87.5% (Highest level & high level) of managers mentioned that local chain restaurants provide a logical price. International chain restaurants were in the third position by 29.2% (Highest level & high level) of the respondents expected that they provide rational price. 8.3%4.2% 16.7%20.8% 50% 12.5% 50% 37.5% 8.3%12.5% 50% 16.7% 12.5% 0.0 10.0 20.0 30.0 40.0 50.0 60.0 Lowest levelLow levelNeutralHigh levelHighest level Independent Local chains International chains
  • 95.
    95 Food quality Figure 27shows managers' evaluation of food quality factor for different restaurant categories. Figure 27: Managers' evaluation of food quality factor in QSRs. Results illustrated that, 83.3% (Highest level & high level) of the managers indicated that international chain restaurants had the maximum food quality level. While the local chain restaurants took the first position by 91.7% (Highest level & high level) of them. Besides, 37.5% (Highest level & high level) of the respondents evaluated independent restaurants' food quality as a top level. In the other hand, 25% (Low level & lowest level) of the managers disagreed with independent restaurants' food quality level. 8.3% 16.7% 37.5% 20.8% 16.7% 8.3% 41.7% 50% 16.7% 50% 33.3% 0.0 10.0 20.0 30.0 40.0 50.0 60.0 Lowest levelLow levelNeutralHigh levelHighest level Independent Local chains International chains
  • 96.
    96 Service quality Figure 28shows managers' evaluation of service quality factor for different restaurant categories. Figure 28: Managers' evaluation service quality factor in QSRs. Results highlighted that, service quality was the most effective factor in international chain restaurants by 87.5% (Highest level & high level) of managers, while 75% (Highest level & high level) of the respondents were satisfied with service quality in local restaurant chains. Besides, 12.5% (Highest level & high level) of the managers agreed with service quality in independent restaurants. In the other side, 41.6% (Low level & lowest Level) of the respondents were unsatisfied with the level of service quality offered in independent restaurants. 20.8%20.8% 45.8% 8.3%4.2% 4.2% 20.8% 41.7% 33.3% 4.2% 8.3% 33.3% 54.2% 0.0 10.0 20.0 30.0 40.0 50.0 60.0 Lowest levelLow levelNeutralHigh levelHighest level Independent Local chains International chains
  • 97.
    97 Consistence standard Figure 29shows managers' evaluation of consistence standard factor for different restaurant categories. Figure 29: Managers' evaluation consistence standard factor in QSRs. Results illustrated that, 83.4% (Highest level & high level) of the managers ensured that international chain restaurants had a consistence standard level for their products and services, and 45.9 and 20.8% (Highest level & high level) of them claimed the same result for local chain restaurants and independent restaurants, respectively. But, 54.1% (Low level & lowest level) of managers mentioned that independent restaurants had no consistence standard level. 33.3% 20.8% 25% 8.3%12.5% 4.2% 29.2% 50% 16.7% 16.7% 29.2% 54.2% 0.0 10.0 20.0 30.0 40.0 50.0 60.0 Lowest levelLow levelNeutralHigh levelHighest level Independent Local chains International chains
  • 98.
    98 Atmosphere Figure 30 indicatesthat, 87.5% (Highest level & high level) of the managers claimed that international chain restaurants had the most attractive atmosphere, besides 75% and 20.8% (Highest level & high level) of them ensured the same result for local chain restaurants and independent restaurants respectively. On the other side, 50%, (Low level & lowest level) of the respondents disagreed with the above result for independent restaurants. Figure 30: Managers' evaluation of atmosphere factor in QSRs. 20.8% 29.2%29.2% 20.8% 4.2%4.2% 16.7% 50% 25% 4.2% 8.3% 37.5% 50% 0.0 10.0 20.0 30.0 40.0 50.0 60.0 Lowest levelLow levelNeutralHigh levelHighest level Independent Local chains International chains
  • 99.
    99 Promotional activities Figure 31shows managers' evaluation of promotional activities factor for different restaurant categories. Figure 31: Managers' evaluation of promotional activities factor in QSRs. Results indicated that, 100% (Highest level & high level) of managers claimed that international chain restaurants had the most attractive promotional activities, besides 45.9% (Highest level & high level) of them ensured the same result for local chain restaurants. On the other hand, 79.1 and 12.5 % (Low level & lowest level) of respondents were disagreed with the above result for independent restaurants, and local chain restaurants, respectively. 70.8% 8.3% 20.8% 4.2%8.3% 41.7% 29.2% 16.7% 25% 75% 0.0 10.0 20.0 30.0 40.0 50.0 60.0 70.0 80.0 Lowest levelLow levelNeutralHigh levelHighest level Independent Local chains International chains
  • 100.
    111 Question NO. (9):-Labors turn over rate. The aim of this question is to illustrate labors turn over rate. Figure 32 shows this issue and illustrates that 41.7% of restaurants' managers indicated that, turn over rate was high in their establishments. On the other hand, 45.8% of the respondents had a reasonable turn over rate in their restaurants. Finally, 12.5% of the managers had a poor turn over rate in their operations. 12.5% 45.8% 41.7% 0.0 10.0 20.0 30.0 40.0 50.0 Highacceptedpoor Figure 32: Labor turn over rate in QSRs. The analysis shows that, 85.7% of independent restaurant managers had a high turn over rate in their establishments. Besides, 50% of international chain restaurant managers ensured the same result. In the other hand, 69.2% of local chain restaurant managers indicated that turn over rate in their restaurants was acceptable. Finally, 25% of international chain restaurant managers had a fair turn over rate in their establishment.
  • 101.
    111 foodin fastdecrease turnover rateMeans to-Question NO. (10): operations. The aim of this question is to illustrate means to decrease turn over rate in fast food operations. Figure 33 indicates that, 83.3% of managers' proposed good treatments of the staff as a suitable mean to decrease staff turn over in their establishment. Besides, 58.3% of them advocated that, good salary and with the same percent, respect and good position were essential to keep staff in their organizations. Also, 25% of the respondents claimed that insurance is an important variable to decrease staff turn over. 83.3% 58.3% 16.7%16.7% 58.3% 25% 0.0 10.0 20.0 30.0 40.0 50.0 60.0 70.0 80.0 90.0 Good treatment for the staff Good salary Employee of the month Festival &thanks letters Respect &good position Insurance Figure 33: Means to decrease turn over rate in QSRs. Finally, choosing employee of the month, and holding festivals & sending thanks letter were another means to reduce staff turn over as mentioned by 16.7% of the managers for each of them.
  • 102.
    112 Question NO. (11):-Managers' evaluation of training level in fast food operations. The aim of this question is to illustrate managers' evaluation of training level in fast food operations. Figure 34 shows that, 70.8% of the managers mentioned that training level was good in their restaurants. While 25% of the respondents indicated that training level was fair. Finally, 4.2% of the managers proposed that training level was poor in their establishments. 4.2% 25% 70.8% 0.0 20.0 40.0 60.0 80.0 GoodFairPoor Figure 34: Managers' evaluation of training level in QSRs. Cross tabulation analysis showed that 100% of international chain restaurant managers had a high training level in their establishments. Besides, 76.9% of local chain restaurant managers ensured the same result. In the other hand, 57.1% of independent restaurant managers indicated that training level in their restaurant was acceptable. Question NO. (12):- Training strategies in fast food operations. The aim of this question is to illustrate training strategies in fast food operations. Most of the respondents indicated that they had training strategies for their operations that strategies include:  On- job- training (83.3% of the managers)  Off-job- training (41.7% of the managers)  Language courses (37.5% of the managers)  Daily and monthly meeting (75% of the managers)
  • 103.
    113  Daily briefing(83.3% of the managers)  Old employee train new employee (25% of the managers) Question NO. (13 ):- Managers' evaluation for marketing strategies in fast food operations. The aim of this question is to illustrate managers' evaluation for marketing strategies in fast food operations. Data in figure 35 showed that, 62.5% of managers mentioned that marketing strategies was good in their restaurants. While 20.8% of respondents indicated that marketing strategies was fair. Finally, 16.7% of managers proposed that training level was poor in their establishments. 16.7% 20.8% 62.5% 0 20 40 60 80 GoodFairPoor Figure 35: Managers' evaluation for marketing strategies in QSRs. Restaurant managers proposed the following implemented means as strategies for marketing in their establishments:  Word of mouth (58.3% of managers)  Magazine and newspapers (75% of managers)  TV promotion (50% of managers)  Billboard (41.7% of managers)  Souvenirs & gifts (75% of managers)  Kids gifts (25% of managers)  Flyers and brochures Cross tabulation analysis showed that 100% of international chain restaurant managers had a high marketing strategy plan in their establishments. Besides, 69.2% of local chain restaurant managers ensured the same result. In the other hand, 42.9% of independent
  • 104.
    114 restaurant managers indicatedthat they had a poor marketing strategy in their restaurants. Question NO. (14):- Managers' evaluation for quality level in fast food operations. The aim of this question is to illustrate managers' evaluation for quality level in fast food operations. Figure 36 showed that, 83% of the managers mentioned that quality level was good in their restaurants. While 17% of the respondents indicated that quality level was fair. Fair 17% Good 83% Figure 36: Managers' evaluation for quality level in QSRs. The analysis showed that 100% of international chain restaurant managers had a high quality level in their establishment. Besides 75 & 57.1% of local chain restaurant managers and independent restaurant managers respectively ensured the same result. In the other hand, 42.9% of independent restaurant managers indicated that quality level in their restaurant was acceptable.
  • 105.
    115 Question NO. (15):-Quality development strategies in fast food operations The aim of this question is to illustrate managers' evaluation for quality development strategies in fast food operations. 91.7% of managers indicated that they had quality development strategies; which include the following means:  Follow up.  Check every time.  Guest survey.  Deal with special companies for evaluating the quality service cleanliness.  Mastery shopper.  Quality, service, and cleanliness analysis.  Special department for quality development.  Quality measuring systems. Question NO. (16):- The extent of product development to meet customers' needs The aim of this question is to illustrate managers' evaluation for the extent of product development to meet customers' needs. Figure 37 shows that, 79% of the managers mentioned that the extent of product development to meet customers' needs was good in their restaurants. While 21% of the respondents indicated that the extent of product development to meet customers' needs was fair. Good 79% Fair 21% Figure 37: The extent of product development to meet customers' needs in QSRs.
  • 106.
    116 Restaurant managers proposedthe following implemented means as tools for product development in their establishments:  Adding new products.  Market research.  Customer needs analysis.  New trend follow up.  New systems application.  Guest survey. Question NO. (17):- Customers satisfaction measuring methods in fast food operations The aim of this question is to illustrate managers' evaluation for customer's satisfaction measuring methods in fast food operations. Figure 38 indicates that, 66.7% of the managers proposed guest comment card as a suitable mean to measure customers' satisfaction in their establishments. Besides, 58.3% of them advocated that, meeting with guest was a second mean to measure customers' satisfaction in their organizations. Also mastery shopper and guest survey were another means to measure customers' satisfaction; mentioned by the managers with percents of 29.2 and 25%, respectively. 66.7% 58.3% 29.2% 25% 8.3%8.3% 0.0 10.0 20.0 30.0 40.0 50.0 60.0 70.0 Guest comment card Meeting with guest Mastery shopper Guest survey Hot lineGuest book Figure 38: Customers satisfaction measuring methods in QSRs. Finally, hot line and guest book were the last means to measure customers' satisfaction as mentioned by 8.3% of the managers for each of them.
  • 107.
    117 Question NO. (18):-Strengths and weakness points in local fast food operations The aim of this question is to illustrate managers' evaluation for strengths and weakness points in local fast food operations. As indicated by 87.5% of the managers there were strengths and weakness points in fast food operations as follows: 4.5.18.1 Strengths points in local food operations Restaurant managers highlighted the following points as strengths points in local fast food restaurants:  High quality.  Fast and friendly service.  Reasonable price.  Product variety.  Adopting new managerial systems.  Using planned strategy.  Continuous training.  Planned marketing strategy. Question NO. (18.2):- Weakness points in local fast food operations Restaurant managers highlighted the following points as weakness points in fast food restaurants:  Un qualified employees.  Changeable raw material price.  Technology adoption.  Distribution channels.  Promotion.  Healthy and hygiene aspects.  Higher staff expectations.
  • 108.
    118 Question NO. (19):-Opportunity’s and threats’ points in local fast food operations. The aim of this question is to illustrate managers' evaluation for opportunity’s and threats points’ in local fast food operations. As indicated by 79.2% of the managers, there were opportunities and threats’ points in fast food operations as follows: fast foodlocalpoints in’sOpportunity-):.1Question NO. (19 operations. Restaurant managers highlighted the following points as opportunities points in fast food restaurants:  Brand extensions.  New market share.  New distribution channels.  Increasing delivery service.  New opening.  Using technology. Question NO. (19.2):- Threats’ points in local fast food operations.  Restaurant managers highlighted the following points as threats points in local fast food restaurants:  Competitive aspects with different food and beverages categories.  Increased competition for fixed or demanding markets.  Labor availability.  Changeable market.  New trends.  Increasing customers' awareness with nutrition and safety and hygiene aspects.  There is no special department in schools and universities for the fast food restaurant studies.  Fresh graduates aren’t qualified enough.  Changeable market trends.  Declining demand.  Higher customer expectations. Walker (2006) and Ronald and Nykiel (2005)
  • 109.
    119 4.6 Checklist Analysis,Results, and Discussion Table 15 shows checklist results for restaurant categories' factors in the study. Table 15: Checklist results Measured area Exterior Interior Foodquality Guestservice Employee appearance Management functions Overall score Weight factor .10 .10 .30 .30 .10 .10 A- International chain restaurants McDonald's .100 .095 .291 .278 .100 .090 95.4% Burger King .100 .100 .295 .270 .100 .095 96% Hardee's .100 .095 .291 .267 .100 .100 95.3% KFC .100 .100 .264 .279 .094 .080 92% Mean .100 .098 .285 .274 .099 .091 .95 % 100% 98% 95% 91% 99% 91% 95%B- Local chain restaurants Cook Door .100 .090 .275 .280 .091 .087 92.3% Makani .100 .095 .264 .243 .086 .063 85.1% Felfela .100 .088 .255 .251 .084 .051 82.9% Gado .100 .083 .256 .273 .081 .053 84.6% Mean .100 .089 .263 .262 .086 .064 .86 % 100% 89% 87.6% 87.3% 86% 64% 86% C-Independent restaurants Quick Meals .092 .080 .189 .219 .052 .026 65.8% Sharmawy Sharm .083 .078 .195 .210 .073 .043 67.9% El Sheikh .100 .088 .174 .210 .091 .027 69% Naama .090 .083 .182 .230 .061 .028 67.4% Mean .091 .082 .185 .217 .069 .031 .68 % 91.3% 82.3% 61.7% 72.4% 69.3% 31% 68%
  • 110.
    111 Results highlighted that;international chain restaurants were the first category by a mean of 95% of all factors in the study. This result indicated that all most international chain restaurants were outstanding level in the rating scale. In the other hand, local chain restaurants came in the second position by a mean of 86% which proposed that most of local chain restaurants took the level more than effective in the rating scale. Finally, independent restaurants were in the last rating scale level "poor" by a mean of 68 %. These differences between restaurants categories were for the following reasons: 4.6.1 Exterior factors As illustrated in Table 16 that the differences between exterior factors for all restaurants categories were not significant; International chain restaurants and local chain restaurants took full mark for that factor. But, independent restaurants took .091 from the factor total rating (0.10) for the following reasons: Table 16: Exterior factors in independent restaurants Factors No.of(No) repetitions Percentage Parking lot/ landscape/ planters/ adjoining property litter free. 2 50 % Parking lot in good repair (no spot holes; bumpers unbroken). 1 25 % All exterior signs clean; good repair; working. 1 25 % Menu board is clean, clear. 2 50 % 6
  • 111.
    111 4.6.2 Interior factors Resultsproposed that the mean of international chain restaurants for that factor was .098 for the following reasons: Table 17: Interior factors in international chain restaurants Factors No.of(No) repetitions Percentage Wet floor signs clean; in good repair. 1 25 % Vents clean, in good repair. 1 25 % 2 In the other hand the mean for local chain restaurants was .089 from the total factor rate (0.10); Table 18: Interior factors in local chain restaurants Factors No.of(No) repetitions Percentage Wet floor signs clean; in good repair. 3 75 % Vents clean, in good repair. 2 50 % Air vents free of dust/build up; in good repair. 1 25 % Tables clean; in good repair. 3 75 % 9
  • 112.
    112 Independent restaurants wereat the last position for that factor by a rating mean of .082 for the following reasons: Table 19: Interior factors in Independent restaurants Factors No.of(No) repetitions Percentage Wet floor signs clean; and in a good repair. 3 75% Vents clean, and in a good repair. 2 50 % Air vents free of dust/build up; in good repair. 2 50 % Tables clean; in good repair. 3 75 % All lights working, light covers clean. 1 25 % Dining room music is on; volume level allows normal conversation. 1 25 % Ceiling tiles clean, in good repair, lighting in good repair, clean. 2 50 % Dining room chairs clean; free of food debris, in good repair. 2 50 % All wall décor and plants clean. 2 50 % 18
  • 113.
    113 4.6.3 Food qualityfactors Table 20 highlights that international chain restaurants were in the first position by a mean of .285 from the total factor rate of 0.30; for the following reasons: Table 20: Food quality factors in international chain restaurants Factors No.of(No) repetitions Percentage All produce within code date. 2 50 % Thaw/tempering chart posted and use. 1 25 % Safety materials available, in good repair, in use. 1 25 % Hand sinks are available clean; there are soap, sanitizer, and drier. 1 25 % 5
  • 114.
    114 On the otherside, local chain restaurants came in the second position by a mean of .263 for the followings: Table 21: Food quality factors in local chain restaurants Factors No.of(No) repetitions Percentage All bread products within code date. 2 50 % All produce within code date. 2 50 % All prepared or open product properly covered. 1 25 % Thaw/tempering chart posted and use. 2 50 % All thawed/tempered items are properly thawed. 1 25 % Ice scoop used to portion, cup never touch the ice, stored scoop handle not touching ice. 1 25 % Safety materials available, in good repair, in use. 3 75 % Hand sinks are available clean, there are soap, sanitizer, and drier. 2 50 % Measuring scales are available, in good repair, in use. 1 25 % Sanitizers are available, in exact concentrate, in use. 1 25 % 16
  • 115.
    115 Independent restaurants werethe lowest food quality levels by a mean of .185 for the following reasons: Table 22: Food quality factors in independent restaurants Factors No.of(No) repetitions Percentage Products on cooks line/dress station fresh; condiments not mixed with each other, not over stocked. 3 75 % Tongs used to handle cooked meat patties. 2 50 % Fries cooked in proper fry basket. 2 50 % All bread products within code date. 3 75 % All meat products within code date. 2 50 % All produce within code date. 1 25 % All dairy products within code date. 2 50 % All prepared or open product properly covered. 1 25 % Thaw/tempering chart posted and use all. 2 50 % Thawed/tempered items are properly thawed. 2 50 % All fried products properly prepared and portioned. 2 50 % Ice scoop used to portion, cup never touch the ice, stored scoop handle not touching ice 2 50 % Safety materials available, in good repair, in use. 3 75 % Hand sinks are available clean, there are soap, sanitizer, and drier 2 50 % Measuring scales are available, in good repair, in use. 3 75 % Sanitizers are available, in exact concentrate, in use. 3 75 % 35
  • 116.
    116 4.6.4 Guest servicefactors Table 23 proposed that international chain restaurants were in the first position by mean .274 from the factor total rate 0.30; for the following reasons: Table 23: Guest service factors in international chain restaurants Factors No.of(No) repetitions Percentage Employees present to great the guest immediately with a smile and friendly greetings. 1 25% Back line station prepared, properly stocked. 1 25 % Cash machine, or visa card machine are available, in use as needed. 3 75 % Service times sometimes more than 5 minutes. 1 25 % 6 The researcher agrees with that the fast food restaurant, a place where a customer should be served within five minutes of entering the outlet even at peak periods. Ball (1992) agreed with Samle (1980). See page 5.
  • 117.
    117 On the otherside, local chain restaurants came in the second position by mean .262 for the following: Table 24: Guest service factors in local chain restaurants Factors No.of(No) repetitions Percentage Employees present to great the guest immediately with a smile and friendly greeting. 1 25 % Employees are making good eye contact. 1 25 % Employees have good posture, standing up straight, not leaning. Looking their best. 1 25 % Appropriate suggestive selling occurs (up sell, add drinks, etc). 2 50 % Backline station is coordinated, teamwork; hospitality shown. 1 25 % Cash machine, or visa card machine are available, in use as needed. 4 100% Service times some times more than 5 minutes. 1 25 % 11
  • 118.
    118 Independent restaurants hadthe lowest food quality level by mean .217 for the following reasons: Table 25: Guest service factors in independent restaurants Factors No.of(No) repetitions Percentage Employees are making good eye contact. 2 50 % Employees have good posture, standing up straight, not leaning. Looking their best. 2 50 % Appropriate suggestive selling occurs(up sell, add drinks, etc) 2 50 % The order is repeated back to the guest, when appropriate. 2 50 % Back line station communication evident; directing, acknowledgement. 1 25 % Backline station is coordinated, teamwork; hospitality shown. 2 50 % Back line station prepared, properly stocked. 2 50 % Employees knowledgeable, well trained 3 75 % Cash machine, or visa card machine are available, in use as needed. 4 100 % Service times more some times than 5 minutes. 2 50 % 22
  • 119.
    119 4.6.5 Employee appearance Resultsproposed that the mean of international chain restaurants for that factor was .099 for the following reasons: Table 26: Employee appearance in international chain restaurants Factors No.of(No) repetitions Percentage Management name badge is worn and name is readable. 1 25% 1 In the other hand the mean for local chain restaurants was .086 from the total factor rate (0.10); this result was for the following: Table 27: Employee appearance in local chain restaurants Factors No.of(No) repetitions Percentage Employees refrain from chewing gum, eating, and drinking while on duty. 1 25% Name badges are worn and name legible 2 50 % Hands are washed frequently per sanitation standards. 1 25% Management name badge is worn and name is legible. 3 75% 7
  • 120.
    121 At the lastposition for that factor were independent restaurants by a rating mean of .069 for the following reasons: Table 28: Employee appearance in independent restaurants Factors No.of(No) repetitions Percentage All employees are wearing approved uniform. 1 25% Uniform is clean; free of wrinkles; properly fitted; in good repair. 2 50% Aprons are clean; in good repair. 1 25% Name badges are worn and name legible. 2 50% Hands are washed frequently per sanitation standards. 1 25% Male employees are clean, well shaven; mustaches are neatly trimmed. 2 50% Management is wearing a clean, pressed, approved uniform. 1 25% Management displays a professional image 3 75% Management name badge is worn and name is legible. 3 75% 16
  • 121.
    121 4.6.6 Management functions Resultsproposed that the mean of international chain restaurants for that factor was .091 for the following reasons: Table 29: Management functions in international chain restaurants Factors No.of(No) repetitions Percentage Safety/accident prevention program in place. 1 25% First aid cabinet is available, equipped, in use. 1 25% Shift readiness/food quality checklist completed and posted. 2 50% Employee break area is available, neat, clean and organized. 1 25% 5
  • 122.
    122 In the otherhand, the mean for local chain restaurants was .064 from the total factor rate (0.10); and this result was for the followings: Table 30: Management functions in local chain restaurants Factors No.of(No) repetitions Percentage Training materials are current, posted and used. 2 50 % Proper security standards are followed – office door, back door. 3 75% Safety/accident prevention program in place. 2 50% First aid cabinet is available, equipped, in use. 2 50% Shift readiness/food quality checklist completed and posted. 3 75% Communication board posted and used 2 50% Manager's office available, neat, and organized. 2 50% Employee break area is available, neat, clean and organized. 3 75% 19
  • 123.
    123 At the lastposition for that factor were independent restaurants by rating mean .031 for the following reasons: Table 31: Independent restaurants Factors No.of(No) repetitions Percentage Management is visible. 3 75% Training materials are current, posted and used. 4 100% Proper security standards are followed – office door, back door. 3 75% Safety/accident prevention program in place. 3 75% First aid cabinet is available, equipped, in use. 3 75% Shift readiness/food quality checklist completed and posted. 4 100% Communication board posted and used. 4 100% Manager's office neat and organized. 3 75% Employee break area is neat, clean and organized. 3 75% 30
  • 124.
    124 Table 32 showsthe final restaurant categories rating scale. Table 32: Restaurant categories rating scale Rating scale Excellent (92-100) Verygood (86<92) Good (80<86) Acceptable (72<80) Fair (Below72) A- Independent restaurants Quick Meals  Sharmawy Sharm  El Sheikh * Naama * B- Local chain restaurants Cook Door  Makani * Felfela * Gado * C- International chain restaurants McDonald's * Burger King * Hardee's  KFC 
  • 125.
    125 Summary, Conclusion andrecommendations The food service industry may be classified in many different ways. One way is to categorize it according to various markets. Food service operations may also be classified according to the economic objectives of the operation. There are three main categories of food service operations under this type classification: Commercial, instructional, and military. It should be differentiate between food serving and food service ; food serving is "the process of moving the food and/or beverage items that have been prepared from production staff to service personnel"; while food service is " the process of transferring food and/or beverage products from service staff to guests". Fast food establishments are those that serve foods for which there is little or no waiting. Many people in the industry are beginning to identify these as fast service restaurants in recognition of the fact that the service is fast not the food. Fast food based on current concepts falls into three basic categories:-  Utilization of time saving equipment.  Utilization of labour saving equipment.  Utilization of self - service devices or methods to reduce labour overhead.
  • 126.
  • 127.
    127 5.1. Summary The researcherdirects towards evaluating the experiment of the local restaurant chain in Egypt. The study intended to assess the actual state of the local restaurant chains experiment in the population being selected and assess its prospective impact upon customer satisfaction. The research is dependent on the descriptive annalistic methodology. It is finally put data into diagrams. 83 % is the average response rate for the guest questionnaire and 82 % is the average response rate for the in – deep personnel interview. Statistical Package for Social Sciences (SPSS) program was used when analyzing data. Results obtained indicated that most of managers and customers’ estimating for the experiment of the fast food concept in Egypt was acceptable. Results obtained indicated that most of managers and customers’ evaluation for the experiment of local restaurant chains in Egypt was successful. Results obtained indicated that the variables of food quality, price and service quality were the first three important factors in QSRs that attract customers. At the same time results obtained indicated that 61.1% of the managers mentioned that the customers need a meal with a good value and cheap price, 33.3% of them proposed that customers want big quantity meal, fast and friendly service is a prerequisite for customers as listed by 47.2% of managers. At the same time results obtained indicated offering a good service and a good quality with good value which were the most common ways used by managers to deal with customers needs with percent of 55.6 & 47.2% respectively. 41.7% of the managers were trying to meet customers' expectations, and 19.4% of them used research study to expect customers' needs and deliver it.
  • 128.
    128 Results obtained indicatedthat 77.9% (Highest level & high level) of the customers indicated that international chain restaurants had the maximum food quality level. While the local chain restaurants took the second position by 69.2% (Highest level & high level) of them. More over the observation checklist point out that food quality level in local restaurant chains 90%while the international chains come in the first level by 93%. On the other side results illustrated that 83.3% (Highest level & high level) of the managers indicated that international chain restaurants had the maximum food quality level. While the local chain restaurants took the first position by 91.7% (Highest level & high level) of them. Results obtained indicated that service quality was the most effective factor in international chain restaurants by 64.4% (Highest level & high level) of the customers, while 50% (Highest level & high level) of the respondents were satisfied with service quality in local chain restaurants. Also, service quality was the most effective factor in international chain restaurants by 87.5% (Highest level & high level) of the managers, while 75% (Highest level & high level) of the respondents were satisfied with service quality in local restaurant chains, Moreover the observation checklist point out that guest service level in local restaurant chains by 83% while the international chains come in the first level by 91%. Results obtained indicated that 66.4% (Highest level & high level) of the customers claimed that international chain restaurants had the most attractive promotional activities, besides 23% (Highest level & high level) of them ensured the same result for local restaurant chains. Also 100% (Highest level & high level) of managers claimed that international chain restaurants had the most attractive promotional activities, besides 45.9% (Highest level & high level) of them ensured the same result for local chain restaurants. Results obtained indicated that 71.1% (Highest level & high level) of customers ensured that international chain restaurants had a consistence standard level for their products and services, and 49% (Highest level & high level) of them claimed the same result for local chain restaurants. Also, 83.4% (Highest level & high level) of managers ensured that international chain restaurants had a consistence
  • 129.
    129 standard level fortheir products and services, 45.9% (Highest level & high level) of them claimed the same result for local chain restaurants. Results obtained indicated that a 100% of international chain restaurant managers had a high quality level in their establishments. Besides, 75 & 57.1% of local chain restaurant managers and independent restaurant managers respectively ensured the same result. Results obtained indicated that 91.7% of the managers indicated that they had quality development strategies. At the same time results obtained indicated that 79% of the managers mentioned that the extent of product development to meet customers' needs was good in their restaurants. While 21% of the respondents indicated that the extent of product development to meet customers' needs was fair. Results obtained indicated that 100% of international chain restaurant managers had a high training level in their establishment. Besides, 76.9% of local chain restaurant managers ensured the same result. Results obtained indicated that 85.7% of the independent restaurant managers had high turn over rate in their establishment. Besides, 50% of international chain restaurant managers ensured the same result. However, 69.2% of local chain restaurants managers indicated that turn over rate in their restaurant were acceptable. Results obtained indicated that 58.3% of the respondents disagreed with that local fast food operation use international concept. However, 41.7% of the managers accepted that local fast food restaurants use international concept. Results obtained indicated that, 100% of international chain restaurant managers had a high marketing strategy plan in their establishments. Besides, 69.2% of local chain restaurant managers ensured the same result. Results obtained indicated that, 66.7% of managers proposed guest comment card as a suitable mean to measure customers' satisfaction in their establishments. Besides, 58.3% of them advocated that, meeting with guest was a second mean to measure customers' satisfaction in their organizations.
  • 130.
    131 5.2. Conclusions The researchused guest questionnaire forms, in-depth personal interviews, and checklist to collect its primary data. Data obtained were analyzed by using statistical analysis and qualitative analysis. Results obtained support hypotheses being claimed. As previously discussed throughout the researcher concludes different issues concerning the problem being studied and the findings include: 1. Evaluating the level of local restaurant chains compared with the international chains. (Each of the following attributes ranked from 1 to 5 according to its level) 1 2 3 4 5 Lowest Highest Level Level Attributes Guest opinion Managers opinion local international Thegab local international Thegab Brand name 3.6 4.2 -0.6 4.3 5 0.7- Location 3.6 4.1 -0.5 4.1 4.7 -0.6 Price 3.7 3.4 0.3 4.3 3.1 1.2 Food quality 3.9 4.2 -0.3 4.4 4.2 0.2 Service quality 3.6 4 -0.4 4.0 4.3 -0.3 Consistency standard 3.6 4 -0.4 3.8 4.4 -0.6 Atmosphere 3.1 3.8 -0.7 3.9 4.3 -0.4 Promotional activities 2.9 3.8 -0.9 3.5 4.8 -1.3
  • 131.
    131 2. Define theneeded factors to develop the local restaurant chains level to reach the international standard. o Implement human developing strategies to develop the human element  Evaluating the human element  Maintain a clear vision, mission, and operation strategies, specify the roles.  Applying system for staff (salary, staff meal, accommodation, transportation)  Motivational activities (employee of the month, birthdays, festivals, thanks letters, incentive). o Affecting follow up for sanitation and hygiene.  Well awareness of personnel hygiene and sanitation.  Hand sink with hot and cold water, soap, drier, and sanitizer should be available.  Private toilet for the staff and another for the guest should be available.  Use sanitizer gel for sanitation.  Follow up for shaven and hand washing frequency and in the right way per sanitation standard.  Smoking in front of the store, or front of the guest should be forbidden.  Applicator the hazard analysis of critical control Points (HACCP) system. o Clarifying safety and security roles and effecting use for tools  First aid cabinet should be available
  • 132.
    132  Improving safetyand security awareness.  Applying a strong fair system, and fair alarm system.  Frequency training for fair fighting.  Execute safety materials (stainless gloves, cotton gloves, safety apron, safety face cover, and wet floor sign)  Implementing safety procedures in usual cleaning for the hood o Applying a developing strategy through training and the effective use for training material.  Applying a developing strategy through training.  Developing staff languages level (English, Russian, Italian, etc…).  Offering training material (Projector - video – screen-data show) should be available and in use.  Implementing operation systems (products mix analysis, sales mix analysis, lunch production control, sales forecasting). o Implementing executing operation procedures  Measuring scales should be available  Implementing receiving and storage procedures  Using tempering day dot system (in, use, out).  Use different cutting board with different colors.  Occupying delivery bag to keep the food in the reasonable temperature.  Fit wrapping and bagging materials needed.  Affective use of the information technologies (IT). Computer system should be in use control, analyses, inventory, scheduling, directing, training, order processing, accounting, purchasing, marketing, consumer behavior, and the location of new restaurants.  Consistence standard for service time.  Work with mystery shopper companies to evaluate the quality, service-cleaning level in the chain compared with the other chains and compared with the standard.
  • 133.
    133 o Nutritional value Planning the menu based on nutritional value, profitability, and publicity analysis.  Stating nutritional facts in the main massage to the guest.  Fresh juices, decaffeinated, water or low fat milk needed for nutritional value.  Special meals for diabetic, heart problems, high blood, and healthy food are needed. o Frequency follows up marketing and research study.  Marketing research study and customer needs analysis should be frequency.  Well effective promotional activities.  Continuing gust feedback and sensitivity analyses (guest comment, surveys, comment cards, recommendation box, guest complains, thanks letters).  The effective use for the internet through survey, or questionnaire for the guest through the internet.  A logo is the restaurant's identifying mark that the public will recognize.  Analyzing competitor.  Selecting well location in retail outlets such as forecourt shops, clubs, and convenience stores. o Focusing on guest satisfaction and following new trends.  Covering most distances by home delivery  Single-telephone-number systems in delivery firms use computerized guest histories to facilitate order taking  Well cares about carhop, drive in, and drive through, delivery and catering.  Accepting credit card payment, and offering credit card machine.
  • 134.
    134  Applying newproduct frequency.  Creating a web site, hot line or other advertisement that makes the users meeting with your product or service memorable.  Applying enough area for the youth (comfortable chairs, attractive television channels, and the Internet services).  Caring for the kids (kid's meals, kid's gifts, kid's birthdays, kid's area, and kids in the school.  Customer feedback is vital to improve product quality.  Solving problems and meeting queries.  Providing a personal touch (treating the customer as an individual). o Reduced clarified strategy to offer qualified elements for the restaurant field by ministry of education and ministry of tourism.  Supporting languages studying (English, Russian, Italian, etc…).  Special courses for the restaurant staff about (Personnel hygiene, security, safety, service, customer satisfaction, hospitality).  Special department for restaurant services (back line, front line).  Special courses for the restaurant managers about (team built, time management, leadership, supervisor skills, management skills, staff direction, delegation, empowerment, sales forecasting, and lunch production control). 3. Evaluating international chains product developing flexibility to meet national taste. o Applying special dishes or sandwiches meet the Egyptian traditions (kofta – falafel– shawerma). o Applying crises management polices. o Studying Egyptian habits and sharing festivals. o Respect believes and religions (no wine – no pork). o Employing the national people.
  • 135.
    135 5.3. Recommendations The studyraises the following recommendations for further study. The researcher to develop the experiment of local restaurant chains in Egypt suggests varied recommendations. Here are some of these recommendations: 1. Implement human developing strategies to develop the human element. 2. Affecting follow up for sanitation and hygiene roles. 3. Clarifying safety and security roles and effecting use for tools. 4. Applying a developing strategy through training and the effective use for training material. 5. Implementing executing operation procedures. 6. Planning the menu based on nutritional value, profitability, and publicity analysis. 7. Frequency follows up marketing and research study. 8. Focusing on guest satisfaction and following new trends.
  • 136.
  • 137.
    137  Ball, S.D. (1992): "Fast Food Operations and their Management", Edward Arnoldo Publishers LTD, England, pp.19, 172,252.  Bateson, J. E. (1995): "Managing Services Marketing", Text and Readings, 3rd Ed, the Dryden Press, Harcourt Brace College Publishers Fort Worth Philadelphia San Diego, New York, pp.558- 570.  Blackett, T. (2003): "Brand Channel Com Brand Trust Customer Attraction and Retention Brand Brands Branding.Htm". http://.www.Brandchannel.Com/Brand_Speak.asp?bs_id=70  Brian, D. S. (2006): "Caterer and Hotelkeeper", 12-18 October 2006, pp.71.  Briggs, R. (2000): "Food Purchasing and Preparation", Cassell, New York, pp. 198-205.  Brymer, R.A. (1995): "Hospitality Management an Introduction to the Industry", 7th Ed, U.S.A.: Kendall/ Hunt Publishing Company, pp. 417-419.  Cooper, C., and Lawson, R. (2004): "Hospitality, Tourism, and Lifestyle Concepts: Implications for Quality Management and Customer Satisfaction", THHP the Haworth Hospitality Press An Imprint of the Haworth Press, Inc. New York, pp, 2-7, 37, 38.  Dharmaraj, E. (2002): "Food, and Hotel Legislations, and Policies", New Age International (P) Limited, Publishers, New Delhi, pp. 58 - 67.  Donnelly, Jr.J., Gbson, J.I., and Ivancevich, J.M. (1998): "Fundamentals of Management", Irwin Mc Grew-Hill, New York, pp. 483- 493.
  • 138.
    138  Dube, L.,and Renaghan, L, M. (1999): "Cornell Hotel and Restaurant Administration Quarterly", December 40, No 4, pp. 16.  Easerbrook. (2006): "Caterer and Hotelkeeper", 12-18 October, pp.11.  Etzel, M.J. (2004): "Marketing", 13th Ed. John Wiley and Sons, London, pp. 318 - 329.  Field (1999): "Cornell Hotel and Restaurant Administration Quarterly", Volume 40, No 1, pp. 69, 72.  Finn, M. E .,White, M, and Walton, M. (2000): "Tourism and Leisure Research Methods", Data Collection, Analysis and Interpretation", Longman, England, pp.226.  Foster, D.L. (1993): "Hospitality Professional Series, Food and Beverage: Operations, Methods, and Cost Controls'', Glencoe Macmillan / MC Graw-Hill Lake Forest, pp. 22-33.  Ghislli, R. F., La Lopa, J.M, and Billy B. (2001): "Cornell Hotel and Restaurant Administration Quarterly", Volume 42, No 2, pp.29.  Gottleb, L. (1982): "Food Service Hospitality Advertising and Promotion", Bobbs-Merrill Educational Publishing Indianapolis Printed in the United States of America, pp. 158-161.  Gouville, J. T., and Soman, D. (2001): "Cornell Hotel and Restaurant Administration Quarterly", Volume 42, No 3, pp.29.
  • 139.
    139  Gregory, S.,and Brieiter,D. (2001): "Leveling the Playing Field: E-Marketing's Impact on Loading Operations", Journal of Hospitality and Leisure Marketing, Volume 7, No 4, pp.45.  Hahm, S, P., and Khan, A.M. (2001): "Journal of Restaurant and Food Service Marketing ™", Volume 4, Number 3, Haworth Hospitality Press ® New Trend in Lodging, Tourism and Food Service Managements, pp. 66, 77, 121.  Hill, C.W., and Jones, G.R. (1998): "Strategic Management Theory", An Integrated Approach, 4th Ed, Houghton Mifflin Company, New York, pp. 157-163, 395.  Huber, M., and Pilmanis, P. (2001): "Journal of Restaurant and Food Service Marketing™", Volume 4, Number 4, Haworth Hospitality Press ® New Trend in Lodging, Tourism and Food Service Managements, pp. 199-209.  King, Jr. J, and Ronald F. (2006): "Managing for Quality in the Hospitality Industry", Person Prentice Hall Upper Saddle River, New Jersey 07458, pp, 3-12, 49-79.  Kotler, P., and Armstrong, G. (1996): "Principles of Marketing", Prentice Hall International, New Jersey, pp. 272.  Khan, M.A. (1991): "Concepts of Food Service Operations and Management", 2nd Ed, John Wiley and Sons, Inc. New York, pp. 13-15  Lan, L., and khan, M. A. (1995): "Cornell Hotel and Restaurant Administration Quarterly", Volume 22, No 1, P. 21.
  • 140.
    141  Lane, H.E.and Duper, D. (1997): "Hospitality World an Introduction", Van Nostrand Reinhold, U S A, PP. 217-228, pp.39.  Lillicrap, D., Cousins, J., and Smith, R. (2002): "Food and Beverage Service", 6th Ed, Hodder and Stoughton a Member of the Hodder Headline Group, pp. 6, 404.  Martina, P. (1958): "The Personality of the Retail Store", Havrd Business Review, Vol.36, C.F. Ball, S. (1992):. Fast Food Operations and their Management, 1st Ed, Stanley Thrones Ltd .pp. 133.  Mattila, A. S. (2001): "Cornell Hotel and Restaurant Administration Quarterly", Volume 42, No 4, pp. 73-78.  Medik, S. (1999): "The Business of Hotels", 3rd Ed, Butterworth - Heinemann.pp.79, 134- 138.  Melaniphy, J, C. (2005): "Restaurant and Fast Food Site Selection", 2nd Ed, John Wiley and Sons, New York, pp. 9, 16.  Negl, J. (2002): "Marketing and Sales Strategies for Hotels and Travel Trade", S.CH and Company LTD. Ram Nagar, New Delhi -110 055, pp. 23, 95-98.  Noel, C., and Cullen, E. D. (1996): "The World of Culinary Supervision, Training, and Management", Prentice Hall, Englewood Cliffs, NJ 07632, pp. 29, 38, 156, 174.  Parsa, H. G., Self, J. T. Njte, D., and King, T.(2005): Cornell hotel and restaurant administration quarterly, Volume 45, No 3, August 2005, pp. 311-317.
  • 141.
    141  Pepper, M.,Pratt, G., and Winnick, A. (1984): "Customer Service, Food Service Skills Services", Bonnet Publishing Company, Peoria, Illinois 61615, pp. 15, 16, 60.  Peppers, D., and Rogers, M. (1997): "Enterprise One-to-One, Tools for Building Unbreakable Customer Relationships in the Interactive Get", Great Britain, pp.197-202.  Powers, T. (1995b): "Introduction to Professional Food Service ", 5th Ed, John Wiley and Sons, USA, , pp, 176-200.  Powers, T. (1995a): "Introduction to the Hospitality Industry", 3rd Ed John Wiley & Sons, INC New York,pp. 30, 120 - 131.  Powers, T., and Barrows, C.W. (1999): "Introduction to Management in the Hospitality Industry", 6th Ed, John Wiley and Sons, Inc New York, pp. 148-157.  Powers, T., and Barrows, C.W. (2006): "Introduction to Management in the Hospitality Industry", 8th Ed, John Wiley and Sons. Inc, pp.53-58.  Reay, J. (1983): "A Guide to Catering Organization", Stanley Thrones Ltd, London, pp.70 - 89.  Reid, R. D. (1989): "Hospitality Marketing Management", 2nd Ed, Van Nostrand Reinhold Inc., New Yourk, pp 31-35, 108.  Reid, R. D, and Bojanic, D. C. (2006): "Hospitality Marketing Management", 4th ED, John Wiley and Sons, Inc, Canada, pp. 9-27, 553-562.
  • 142.
    142  Ridgeway, J.,and Ridgeway, B. (1994): "The Catering Management, The complete Judie to Hotel, Restaurant, and Outside Catering" Hand Book, Cogan Page, London, pp. 18-25.  Ronald, A., and Nykiel, P.D. (2005): "Hospitality Management Strategies", Pearson Prentice Hall Upper Saddle River, NJ 07458, pp. 142, 389-391.  Samle, P. T. (1980): "The UK Fast Food Market", An Operator View in Planning for Fast Foods, Report on Retail Planning Conference, December, C. F, pp.122.  Scanlon, N. (1998): "Quality Restaurant Service Guarantied", John Wiley and Sons, New York, pp. 17.  Schultz, D. E., Robinson, W.A., and Petrison, L.A. (1993): "Sale Promotion, Techniques of Sale", NTC Business Books, a Division of NTC Publishing Group, Lincolnwood, Illinois USA. pp. 2- 7.  Schroeder, R.G. (2004): "Operations Management", Contemporary Concepts and Cases, 2nd Ed, John Wiley and Sons, New York, pp. 33-40, 128-167.  Seidman, A., and Johnson, W. (2002): "Journal of Food Service Business Research™", Volume 5, no 3 2002, Haworth Hospitality Press ® New Trend in Lodging, Tourism and Food Service Managements, pp. 252 - 256.  Spurlock, M. (2005): "Don't Eat This Book, Fast Food and the Super Sizing of America", Printed in the United States of America, pp. 119-122, 149-153.
  • 143.
    143  Stutts, A.T.,and Wortman, J.F. (2006): "Management within Hotels / Lodgers ", an Introduction, 2nd Ed, pp. 113, 153, 222.  Van Hoof, H. B., McDonald, M. E., Lawrence, Y., and Vallen, G. K (1996): "A Host of: an Introduction to Hospitality Management", Printed in United State of America, pp. 319, 334, 369, 461-479.  Wade, D. (2006): "Successful Restaurant Management", From Vision to Execution Thomson Delmar Learning, Hospitality, Travel and Tourism, Donald Wade, United States, pp. 49, 81, 226 - 229.  Walker, J.R. (2006): "Introduction in Hospitality", Person Prentice Hall Upper Saddle River, New Jersey 07458, pp. 254-257, 545-523.  Wiley, J., and Sons. (2006) "How to Make a Restaurant a Success", 3rd Ed, John Wiley and Sons, Inc, pp. 4 - 15, 166.  Williams, A. (2002) "Understanding the Hospitality Consumer", John Wiley and Sons, New York, pp. 22-29, 68.  Wyckoff, D. (2001) "Cornell Hotel and Restaurant Administration Quarterly", Volume 42, No 4, pp. 26 - 33.
  • 144.
  • 145.
  • 146.
    146 Helwan University Faculty ofTourism &Hotel Management Hotel Management Department Guest Questionnaire Dear guest, This questionnaire is a part of a master degree study at Faculty of Tourism and Hotel Management; Helwan University. This study focusing on evaluating the experiment of the local restaurant chains compared to the international chains in Egypt. Your opinion is extremely valuable for this study. Answers are strictly confidential and will be used only for the purpose of the study. (Thank you) 1. Do you deal with fast food restaurants? a) Always b) Usually c) Sometimes d) Few e) Never
  • 147.
    147 2. Which mealdo you prefer to deal with fast food restaurant? (Please, rank the following meals from 1 to 3 according to your preferences) 1 2 3 Most Least Preferences preferences a) Breakfast b) Lunch c) Dinner 3. Which type of fast food restaurants do you prefer? (Please, rank the following kinds of fast food chains from 1 to 3 according to your preferences) 1 2 3 Least Most Preference Preference a) Independent restaurants b) Local chains c) International chains 4. Why
  • 148.
    148 5. What arethe most important factors in a fast food restaurant that attract you to select it? (Please, rank each of the following factors from 1 to 5 according to its effectiveness in your choice) 1 2 3 4 5 Least Most Important Important 54321Factors Brand name Location Price Food quality Service quality Consistence standard Menu variety Atmosphere ( Cleanliness- décor- music-lights- temperature) Promotional activities Others Specify
  • 149.
    149 6. Could yourank the level of each of independent restaurants, local restaurant chains, and international restaurant chains in these following factors? (Please, rank each of the following factors from 1 to 5 according to its level) 1 2 3 4 5 Lowest Highest Level Level International chains Local chains IndependentFactors Brand name Location Price Food quality Service quality Consistence standard Menu variety Atmosphere Promotional activities 7. What is your evaluation for the experiment of local fast food restaurant chains in Egypt? a) Successful b) Acceptable c) Not acceptable
  • 150.
    151 8. What arethe advantages and disadvantages in local fast food chains? 9. Have you ever met any problem through your experiment with local fast food restaurant chains? a) Yes b) No If your answer yes; please explain? 10. If, you have any suggestions or recommendations please mention here
  • 151.
    151 Personal data:- A. Gender a)Male b) Female B. Age a) Less than 25 years b) From 25 to 40 years c) More than 40 years C. Marital status a) Single b) Married with out children c) Married with children D. Nationality ( )
  • 152.
    152 ‫والفنادق‬ ‫السياحة‬ ‫كلية‬ ‫قسم‬‫ا‬‫أل‬‫داره‬‫الفندقية‬ ‫رأي‬‫استطالع‬ ‫استمارة‬ ‫العزيز‬ ‫ضيفنا‬:- ‫أرجو‬‫االستمارة‬ ‫هذه‬ ‫بمليء‬ ‫وقتكم‬ ‫يسمح‬ ‫أن‬,‫وهي‬‫ماجستير‬ ‫رسالة‬ ‫من‬ ‫جزء‬‫السياحة‬ ‫بكلية‬ ‫حل‬ ‫جامعة‬ ‫والفنادق‬‫وان‬.‫منها‬ ‫الهدف‬‫بالسالسل‬ ‫مقارنة‬ ‫المحلية‬ ‫المطاعم‬ ‫سالسل‬ ‫تجربة‬ ‫تقييم‬ ‫مصر‬ ‫في‬ ‫العالمية‬. ‫األهمية‬ ‫شديد‬ ‫رأيك‬‫هذه‬ ‫في‬‫الدراسة‬.‫البحث‬ ‫لغرض‬ ‫وهي‬ ‫التامة‬ ‫بالسرية‬ ‫تحاط‬ ‫اإلجابات‬ ‫هذه‬ ‫فقط‬ ‫العلمي‬. ‫معنا‬ ‫تعاونكم‬ ‫لحسن‬ ‫وشكرا‬. 1.‫هل‬‫مطاعم‬ ‫مع‬ ‫تتعامل‬‫السريعة‬ ‫الخدمة‬‫؟‬ ‫أ‬)‫دائ‬‫ما‬ ‫ب‬)‫عادة‬ ‫ج‬)‫أحيانا‬ ‫د‬)‫قليال‬ ‫ه‬)‫أبدا‬ 2.‫وجبة‬ ‫أي‬ ‫في‬‫تناول‬ ‫تفضل‬‫الوجبات‬‫السريعة؟‬ (‫من‬ ‫الوجبات‬ ‫رتب‬ ‫فضلك‬ ‫من‬1-3‫تبع‬‫ا‬‫تناولها‬ ‫ألفضلية‬) 123 ‫تفضيال‬ ‫اقل‬‫تفضيال‬ ‫أكثر‬ ‫أ‬)‫اإلفطار‬ ‫ب‬)‫لغذاء‬ ‫ج‬)‫العشاء‬
  • 153.
    153 3.‫ا‬ ‫مطاعم‬ ‫من‬‫نوع‬ ‫أي‬‫لخدمة‬‫تفضل‬ ‫السريعة‬‫؟‬ (‫رتب‬ ‫فضلك‬ ‫من‬‫المطاعم‬ ‫أنواع‬‫من‬1-3‫تناولها‬ ‫ألفضلية‬ ‫تبعا‬) 123 ‫اكثر‬‫تفضيال‬‫اقل‬‫تفضيال‬ ‫أ‬)‫المطاعم‬‫المستقل‬‫ة‬ ‫ب‬)‫المطاعم‬ ‫سالسل‬‫ال‬‫محلية‬ ‫ج‬)‫سالسل‬‫المطاعم‬‫ال‬‫عالمية‬ 4.‫لماذا؟‬ 5.‫أهم‬ ‫هي‬ ‫ما‬‫العناصر‬‫ا‬ ‫مطاعم‬ ‫في‬‫لخدمة‬‫السريعة‬‫تختار‬ ‫تجعلك‬ ‫التي‬‫األخر‬ ‫دون‬ ‫المطاعم‬ ‫أحد‬‫؟‬ )‫بترتيب‬ ‫قم‬ ‫فضلك‬ ‫من‬‫من‬ ‫عنصر‬ ‫كل‬‫من‬ ‫االتية‬ ‫العناصر‬1-5‫تبعا‬‫أ‬ ‫لمدي‬‫هم‬‫ية‬ ‫العن‬‫صر‬‫ل‬ ‫اختيارك‬ ‫في‬‫األخر‬ ‫دون‬ ‫مطعم‬) 12345 ‫أهمية‬ ‫اقل‬‫أهمية‬ ‫أكثر‬ ‫اإلقبال‬ ‫علي‬ ‫تؤثر‬ ‫التي‬ ‫العناصر‬12345 ‫المطعم‬ ‫شهرة‬ ‫المطعم‬ ‫موقع‬ ‫ا‬‫لسعر‬ ‫الطعام‬ ‫جودة‬ ‫الخدمة‬ ‫جودة‬ ‫المنتج‬ ‫جودة‬ ‫ثبات‬ ‫بقا‬ ‫األصناف‬ ‫تنوع‬‫الطعام‬ ‫ئمة‬ ‫العام‬ ‫الجو‬(‫نظافة‬-‫ديكور‬-‫موسيقي‬- ‫إضاءة‬-‫الحرارة‬ ‫درجة‬) ‫الترويجية‬ ‫األنشطة‬ ‫عناصر‬‫أخري‬------------------
  • 154.
    154 6.‫من‬ ‫كل‬ ‫مستوي‬‫تقييم‬ ‫تستطيع‬ ‫هل‬‫و‬ ‫المستقلة‬ ‫المطاعم‬‫السالسل‬‫المحلية‬‫والسالسل‬ ‫العالمية‬‫التالية؟‬ ‫النقاط‬ ‫خالل‬ ‫من‬ (‫فضلك‬ ‫من‬‫بترتيب‬ ‫قم‬‫من‬ ‫عنصر‬ ‫كل‬‫من‬ ‫االتية‬ ‫العناصر‬1-5‫للمستوي‬ ‫تبعا‬) 12345 ‫اقل‬‫مستوي‬‫مستوي‬ ‫اعلي‬ ‫العناصر‬‫مطاعم‬ ‫مستقلة‬ ‫سالسل‬ ‫محلية‬ ‫سالسل‬ ‫عالمية‬ ‫المطعم‬ ‫شهرة‬ ‫المطعم‬ ‫موقع‬ ‫ا‬‫لسعر‬ ‫ال‬ ‫جودة‬‫طعام‬ ‫الخدمة‬ ‫جودة‬ ‫المنتج‬ ‫جودة‬ ‫ثبات‬ ‫الطعام‬ ‫بقائمة‬ ‫األصناف‬ ‫تنوع‬ ‫العام‬ ‫الجو‬ ‫الترويجية‬ ‫األنشطة‬ 7.‫ل‬ ‫تقييمك‬ ‫هو‬ ‫ما‬‫؟‬ ‫مصر‬ ‫في‬ ‫المحلية‬ ‫المطاعم‬ ‫سالسل‬ ‫تجربة‬ ‫أ‬)‫ناجحة‬ ‫ب‬)‫مقبولة‬ ‫ج‬)‫غير‬‫مقبولة‬ 8.‫م‬‫نظرك‬ ‫وجهة‬ ‫ن‬,‫م‬‫أهم‬ ‫هي‬ ‫ا‬‫وا‬ ‫المميزات‬‫المطاعم‬ ‫سالسل‬ ‫بها‬ ‫تتحلي‬ ‫التي‬ ‫لعيوب‬ ‫المحلية‬‫؟‬
  • 155.
    155 9.‫خالل‬ ‫مشكالت‬ ‫أي‬‫قابلت‬ ‫هل‬‫سالسل‬ ‫مع‬ ‫تجربتك‬‫مطاعم‬‫الخدمة‬‫السريعة‬‫؟‬ ‫المحلية‬ ‫أ‬)‫نعم‬ ‫ب‬)‫ال‬ ‫اشرحها؟‬ ‫فضلك‬ ‫من‬ ‫نعم‬ ‫اإلجابة‬ ‫كانت‬ ‫إذا‬ 11.‫أراء‬ ‫أو‬ ‫اقتراحات‬ ‫أي‬ ‫لديك‬ ‫كان‬ ‫إذا‬‫من‬‫اذكرها‬ ‫فضلك‬‫؟‬ 11.‫شخصية‬ ‫بيانات‬ 1.‫النوع‬ ‫أ‬)‫ذكر‬ ‫ب‬)‫أنثي‬ ‫ب‬-‫العمر‬ ‫أ‬)‫من‬ ‫اقل‬25 ‫ب‬)‫من‬25-40 ‫ج‬)‫من‬40‫فأكثر‬ ‫سنة‬ ‫ج‬-‫االجتماعية‬ ‫الحالة‬ ‫أ‬)‫أعزب‬ ‫ب‬)‫متزوج‬‫أطفال‬ ‫لديه‬ ‫وليس‬ ‫ج‬)‫متزوج‬‫أطفال‬ ‫ولديه‬ ‫د‬-‫الجنسية‬ ()
  • 156.
  • 157.
    157 In-depth personal interviews withthe chains and restaurant managers Name:-……………… Profession:-………………. 1. What is your evaluation for fast food chains in Egypt? a) Successful b) Acceptable c) Not acceptable Explain? 2. What are the expectations of the Egyptian market about the fast food concept? 3. What are the needs and preferences of the Egyptian customer? 4. How do you deal with these needs and preferences? 5. What are the common attributes for the international fast food restaurant chains in Egypt? 6. What is your evaluation for the local fast food restaurant chains in Egypt? a) Successful b) Acceptable c) Not acceptable Explain?
  • 158.
    158 7. Some localrestaurant chains use the international concept. What is your opinion? Agree Disagree Why ? 8. Could you rank the level of each of independent restaurants local restaurant chains and international restaurant chains in the following factors? (Please, rank each of the following factors from 1 to 5 according to its level) 1 2 3 4 5 Lowest Highest Level Level International chains Local chains IndependentFactors Brand name Location Price Food quality Service quality Consistence standard Atmosphere Promotional activities 9. What is the labor turn over rate in your chain? a) Low b) Moderate c) High 10. What is your chain concept to decrease the turn over rate?
  • 159.
    159 11. What isyour evaluating for the training level in your chain? a) Good b) Fair c) Poor 12. What are the training strategies in your chain? 13. What is your evaluating for the marketing strategies in your chain? a) Good b) Fair c) Poor Explain 14. What is your evaluating for the quality level in your chain? a) Good b) Fair c) Poor 15. What is the quality develop strategy in your chain? 16. What is the extent of product development according to customer needs in your chain? a) Good b) Fair c) Poor Explain:- 17. What are the customer satisfaction measuring methods in your chain? 18. What are the strengths and weakness points for local restaurants chain? 19. What are the opportunities and threats points for local restaurants chain?
  • 160.
    161 ‫شخصية‬ ‫مقابالت‬‫والمطاعم‬ ‫السالسل‬‫مديري‬ ‫مع‬ ‫االسم‬:-‫الوظيفة‬:- 1.‫لسالسل‬ ‫تقييمك‬ ‫هو‬ ‫ما‬‫مطاعم‬‫السريعة‬ ‫الوجبات‬‫؟‬ ‫مصر‬ ‫في‬ ‫أ‬)‫ناجحة‬ ‫ب‬)‫مقبولة‬ ‫ج‬)‫غير‬‫مقبولة‬ ‫؟‬ ‫أشرح‬ 2.‫ما‬‫المص‬ ‫السوق‬ ‫توقعات‬ ‫هي‬‫ل‬ ‫بالنسبة‬ ‫ري‬‫الوجبات‬ ‫مطاعم‬ ‫مفهوم‬‫السريعة‬‫؟‬ 3.‫ما‬‫االحتياجات‬ ‫هي‬‫والتف‬‫ض‬‫؟‬ ‫المصري‬ ‫بالعميل‬ ‫الخاصة‬ ‫يالت‬ 4.‫كيف‬‫هذه‬ ‫تلبي‬‫االحتياجات‬‫والتفض‬‫؟‬ ‫يالت‬ 5.‫ما‬‫هن‬‫السريعة‬ ‫الوجبات‬ ‫لمطاعم‬ ‫الخاصة‬ ‫المميزات‬‫في‬ ‫العالمية‬‫مصر؟‬ 6.‫ما‬‫؟‬ ‫مصر‬ ‫في‬ ‫المحلية‬ ‫المطاعم‬ ‫سالسل‬ ‫لتجربة‬ ‫تقييمك‬ ‫هو‬ ‫أ‬)‫ناجحة‬ ‫ب‬)‫مقبولة‬ ‫ج‬)‫غير‬‫مقبولة‬ ‫أشرح‬:- 7.‫في‬‫المحلية‬ ‫المطاعم‬ ‫سالسل‬ ‫بعض‬ ‫اتخذت‬ ‫األخيرة‬ ‫الفترة‬‫الفكر‬‫العالمي‬.‫؟‬ ‫رأيك‬ ‫هو‬ ‫ما‬ ‫أ‬)‫موافق‬ ‫ب‬)‫غير‬‫موافق‬ ‫لماذا؟‬
  • 161.
    161 8.‫تستطيع‬ ‫هل‬‫تقييم‬‫من‬ ‫كل‬‫مستوي‬‫و‬ ‫المستقلة‬ ‫المطاعم‬‫ا‬‫لسالسل‬‫والسالسل‬ ‫المحلية‬ ‫النقا‬ ‫خالل‬ ‫من‬ ‫العالمية‬‫التالية؟‬ ‫ط‬ )‫م‬‫ن‬‫بترتيب‬ ‫قم‬ ‫فضلك‬‫من‬ ‫عنصر‬ ‫كل‬‫من‬ ‫االتية‬ ‫العناصر‬1-5‫للمستوي‬ ‫تبعا‬) 12345 ‫أ‬‫قل‬‫مستوي‬‫أ‬‫مستوي‬ ‫علي‬ ‫العناصر‬‫مطاعم‬ ‫مستقلة‬ ‫سالسل‬ ‫محلية‬ ‫سالسل‬ ‫عالمية‬ ‫المطعم‬ ‫شهرة‬ ‫المطعم‬ ‫موقع‬ ‫ا‬‫لسعر‬ ‫الطعام‬ ‫جودة‬ ‫الخدمة‬ ‫جودة‬ ‫المنتج‬ ‫جودة‬ ‫ثبات‬ ‫العام‬ ‫الجو‬ ‫الترويجية‬ ‫األنشطة‬ 9.‫مطاعمكم؟‬ ‫سالسل‬ ‫في‬ ‫العمالة‬ ‫دوران‬ ‫معدل‬ ‫ما‬ 11.‫هي‬ ‫ما‬‫أ‬‫ال‬ ‫ستراتيجية‬‫العمالة‬ ‫دوران‬ ‫معدل‬ ‫لتقليل‬ ‫منشأة‬‫مطاعمكم؟‬ ‫سالسل‬ ‫في‬ 11.‫التدريب‬ ‫لمستوي‬ ‫تقييمك‬ ‫هو‬ ‫ما‬‫سال‬ ‫في‬‫مطاعمكم؟‬ ‫سل‬ ‫أ‬)‫جيد‬ ‫ب‬)‫متوسط‬ ‫ج‬)‫ضعيف‬ 12.‫وما‬‫مطاعمكم؟‬ ‫سالسل‬ ‫في‬ ‫التدريب‬ ‫استراتيجية‬ ‫هي‬
  • 162.
    162 13.‫التسويقية‬ ‫للخطط‬ ‫تقييمك‬‫هو‬ ‫ما‬‫مطاعمكم‬ ‫سالسل‬ ‫في‬‫؟‬ ‫أ‬)‫جيد‬ ‫ب‬)‫متوسط‬ ‫ج‬)‫ضعيف‬ ‫اشرح‬:- 14.‫الجودة‬ ‫لمستوي‬ ‫تقييمك‬ ‫ما‬‫مطاعمكم‬ ‫سالسل‬ ‫في‬‫؟‬ ‫أ‬)‫جيد‬ ‫ب‬)‫متوسط‬ ‫ج‬)‫ضعيف‬ 15.‫استراتيجية‬ ‫هي‬ ‫وما‬‫تطوير‬‫مطاعمكم؟‬ ‫سلسلة‬ ‫في‬ ‫الجودة‬ 16.‫مطاعمكم؟‬ ‫سالسل‬ ‫في‬ ‫العمالء‬ ‫الحتياجات‬ ‫تبعا‬ ‫المنتج‬ ‫تطوير‬ ‫مدي‬ ‫ما‬ ‫أ‬)‫جيد‬ ‫ب‬)‫متوسط‬ ‫ج‬)‫ضعيف‬ ‫اشرح‬:- 17.‫سالسل‬ ‫في‬ ‫المستخدمة‬ ‫العمالء‬ ‫رضاء‬ ‫قياس‬ ‫طرق‬ ‫هي‬ ‫ما‬ ‫مطاعمكم؟‬ 18.‫سالسل‬ ‫بها‬ ‫تمتاز‬ ‫التي‬ ‫والضعف‬ ‫القوة‬ ‫نقاط‬ ‫هي‬ ‫ما‬ ‫ال‬‫مطاعم‬‫المحلية‬‫؟‬ 19.‫لسالسل‬ ‫بالنسبة‬ ‫والتهديدات‬ ‫الفرص‬ ‫هي‬ ‫ما‬‫ال‬‫مطاعم‬‫المحلية‬‫؟‬
  • 163.
  • 164.
    164 Checklist This checklist,s measureis covering quality, service, cleanliness, atmosphere, staff and management performance. Visit date / / 200 Restaurant name:- Restaurant area:- N/A means (Not available) NANoyes1- Exterior Parking lot/ landscape/ planters/ adjoining property litter free. 1 Parking lot in good repair (no potholes; bumpers unbroken). 2 Trash area grease free; doors, dumpster, grease receptacle lids closed; clean and in good repair. 3 All exterior signs clean; good repair; working. 4 All sidewalks clean (free of gum or stains; litter free) 5 Building and lot lights in good repair.6 Building walls/awnings/doors in good repair not needing painting clean. 7 8 Total
  • 165.
    165 2-Interior NANoyes2-1 Entryway/lobby Entrance doorsclean; glass clean; doors shut properly. 1 Wet floor signs clean; in good repair.2 Menu boards clean, lights working, translates clean. 3 Walls clean, in good repair4 Vents clean, in good repair5 Ceiling tiles clean, in good repair, lighting in good repair, clean. 6 7 Total 2-2 Dining Room Tables clean; in good repair.1 Dining room chairs clean; free of food debris, in good repair. 2 Ashtrays clean and available.3 Dining room doors clean; open smoothly; Exit signs lit (if electric). 4 Walls are clean; in good repair.5 All wall décor and plants clean.6 Windows, window ledges and glass dividers; in good repair. 7 Trash cans clean, not overflowing; trays not stacked up; in good repair. 8 All lights working, light covers clean.9 Ceiling and ceiling tiles clean; in good repair.10 Air vents free of dust/build up; in good repair. 11 Tables being cleaned regularly.12 Temperature is comfortable.13 Dining room music is on; volume level allows normal conversation. 14
  • 166.
    166 15 16 Total 3-Food quality 3-1 Productingredients/temperatures-cooks line Products on cooks line/dress station fresh; condiments not mixed with each other, not over stocked. 1 Lettuce and tomatoes prepared and held properly, fresh appearance. 2 Onions prepared and held properly, covered, fresh appearance. 3 Tongs used to handle cooked meat patties.4 5 6 7 8 Total NANoyes3-2 Food quality standards Fries cooked in proper fry basket.1 All bread products within code date.2 All meat products within code date.3 All produce within code date.4 All dairy products within code date.5 All prepared or open product properly covered. 6 Thaw/tempering chart posted and use.7 All thawed/tempered items are properly thawed and controlled. 8 French fries salted; hot, fresh, not greasy, within hold time. 9 Kids meals hot, fresh, not greasy, within hold time. 10 All fried products properly prepared and11
  • 167.
    167 portioned. Dessert fresh withinhold time.12 Chicken fillet portions cooked in proper fry basket. 13 Chicken fillet portions maintained at Proper temp. (150? min.). 14 Tongs used to handle cooked chicken product. 15 Safety materials available, in good repair, in use. 16 Hand sink are available clean, there are soap, sanitizer, and drier. 17 Measuring scales are available, in good repair, in use. 18 Sanitizer are available, in exact concentrate, in use. 19 20 21 22 Total NANoyes3-3 Beverage and front line dispensers Soft drinks filled1/4" from top; lidded and marked. 1 Dispenser is functional; wiped clean of soda splashes spills. 2 Ice scoop used to portion, cup never touch the ice, stored scoop handle not touching ice. 3 Coffee or tea filled 1/4" from top; served fresh; proper temperature. 4 Condiments, straws, stir sticks stoked; rack and pans clean. 5 Counter area and equipment surfaces clean, polished and in good repair. 6 Floors and counters free of trash or spills.7 8 9 Total
  • 168.
    168 4- Guest service NANoyes4-1Service quality Employees present to great the guest immediately with a smile and friendly Greeting. 1 Employees are making good eye contact.2 Employees have good posture, standing up straight, not leaning. Looking their best. 3 Appropriate suggestive selling occurs(up sell, add drinks, etc). 4 The order is repeated back to the guest, when appropriate 5 Proper money handling procedures are followed. 6 Employees say thank you to each guest.7 Receipt given with pick up/delivery instructions. 8 "to go" orders are properly packaged with courteous delivery. 9 Guest receive the exact items ordered10 Team work on the front line evident11 Hustle, sense of urgency, efficient motion/speed shown on front line. 12 Back line station communication evident; directing, acknowledgement. 13 Back line hustle shown, urgency efficient motion/speed shown 14 Backline station is coordinated, teamwork; hospitality shown. 15 Back line station prepared, properly stocked16 Employees knowledgeable well trained.17 Cash machine, or visa card machine are available, in use as needed. 18 19 Total
  • 169.
    169 4-2 Service times– must score all 5 (no NAs) 5 minutes or less = yes, over 5 minutes = no Guest 11 Guest 22 Guest 33 Guest 44 Guest 55 Guest 66 Guest 77 Guest 88 Guest 99 Guest 1010 Total NANoyes5- Employee/Management appearance Employees refrain from chewing gum, eating, and drinking while on duty. 1 All employees are wearing approved uniform.2 Uniform is clean; free of wrinkles; properly fitted; in good repair. 3 Aprons are clean; in good repair.4 Name badges are worn and name legible.5 Employees wearing hat at all times.6 Shoes are dark in colored leather; non-skid.7 Hair is neat, confined-above collar, away from face, off shoulders. 8 Hand are washed frequently per sanitation standards. 9 Male employees are clean shaven; mustaches are neatly trimmed. 10 Female nail polish; clean; not chipped; light color; no false nails/decals 11 Jewelry meets standard12 Management is wearing a clean, pressed, approved uniform. 13 Management displays a professional image.14 Management name badge is worn and name15
  • 170.
    171 is legible. Management shoesare dark, polished non- skid. 16 17 Total 6- Management behaviors/functions Management is visible.1 Management is directing crew.2 Management is setting the hospitality standard. 3 Training materials are current, posted and used. 4 Proper security standards are followed – office door, back door. 5 Safety/accident prevention program in place.6 First aid cabinet is available, equipped, in use.7 Shift readiness/food quality checklist completed and posted. 8 Communication board posted and used.9 Manager's office neat and organized.10 Employee break area is neat, clean and organized. 11 12 Total
  • 171.
    171 SCORE SHEET (=) total points (*) weight factor Rating% (Y/Adjusted) (=) Adjusted possible (-) NA points Total possible Measured area 0.1081-Exterior 0.10232- Interior 0.30393- Food quality 0.30294- Guest service 0.10175-Employee appearance 0.10126-Managament functions Over all score Rating scale (92-100)Excellent (86<92)Very good (80<86)Good (72<80)Acceptable (below 72)Fair Comments:-
  • 172.
  • 173.
  • 174.
    174 ‫مقارنة‬ ‫المحلية‬ ‫المطاعم‬‫سالسل‬ ‫تجربة‬ ‫تقييم‬‫بالسالسل‬‫مصر‬ ‫في‬ ‫العالمية‬ ‫ردة‬‫ر‬‫المتح‬ ‫رات‬‫ر‬‫الوالي‬ ‫رن‬‫ر‬‫م‬ ‫رة‬‫ر‬‫بداي‬ ‫رريعة‬‫ر‬‫الس‬ ‫رات‬‫ر‬‫الوجب‬ ‫راعم‬‫ر‬‫مط‬ ‫رل‬‫ر‬‫سالس‬ ‫ررة‬‫ر‬‫األخي‬ ‫رة‬‫ر‬‫ون‬ ‫ا‬ ‫ري‬‫ر‬‫ف‬ ‫ررت‬‫ر‬‫انتش‬ ‫ا‬‫العالم‬ ‫أنحاء‬ ‫كافة‬ ‫والي‬ ‫ألمريكية‬‫منها‬ ‫العناصر‬ ‫من‬ ‫مجموعة‬ ‫علي‬ ‫نجاحها‬ ‫في‬ ‫معتمدة‬:- ‫النظافة‬-‫الخدمة‬ ‫جودة‬-‫للسعر‬ ‫بالنسبة‬ ‫القيمة‬-‫العام‬ ‫الجو‬(‫ديكور‬-‫ا‬‫ضائة‬-‫موسيقي‬)-‫الموقرع‬ -‫الخدمة‬ ‫سرعة‬. ‫وكروك‬ ‫ووصاية‬ ‫مؤمن‬ ‫مثل‬ ‫محلي‬ ‫بعضها‬ ‫السريعة‬ ‫الوجبات‬ ‫مطاعم‬ ‫من‬ ‫العديد‬ ‫مصر‬ ‫في‬ ‫يوجد‬ ‫وفلفلة‬ ‫وجادو‬ ‫ومكاني‬ ‫دور‬,‫كير‬ ‫برجر‬ ‫و‬ ‫ماكدونالدز‬ ‫مثل‬ ‫عالمي‬ ‫والبعض‬‫وكنتراكي‬ ‫وهرارديز‬ ‫نج‬, ‫السال‬ ‫منافسة‬ ‫إلي‬ ‫المحلية‬ ‫السالسل‬ ‫وتسعي‬‫واأل‬ ‫الجرودة‬ ‫مسرتوي‬ ‫فري‬ ‫العالمية‬ ‫سل‬‫األنحراء‬ ‫فري‬ ‫نتشرار‬ ‫حسنة‬ ‫سمعة‬ ‫وتحقيق‬ ‫واألجنبية‬ ‫العربية‬. ‫مشكلة‬‫الدراسة‬ ‫االتي‬ ‫الدراسة‬ ‫مشكلة‬ ‫تشمل‬: 1.‫ريم‬‫ر‬‫تقي‬‫رتو‬‫ر‬‫مس‬‫رة‬‫ر‬‫المقدم‬ ‫رودة‬‫ر‬‫الج‬‫رو‬‫ر‬‫الج‬ ‫رتوي‬‫ر‬‫بمس‬ ‫رة‬‫ر‬‫مقارن‬ ‫رة‬‫ر‬‫المحلي‬ ‫راعم‬‫ر‬‫المط‬ ‫رل‬‫ر‬‫سالس‬ ‫ري‬‫ر‬‫ف‬‫دة‬ ‫المقدم‬‫ة‬‫العالمية‬ ‫السالسل‬ ‫في‬. 2.‫تدعيم‬ ‫الي‬ ‫تحتاج‬ ‫التي‬ ‫النقاط‬ ‫دراسة‬‫س‬ ‫في‬‫المحلية‬ ‫المطاعم‬ ‫السل‬. 3.‫رث‬‫ر‬‫حي‬ ‫رن‬‫ر‬‫م‬ ‫ره‬‫ر‬‫المحلي‬ ‫راعم‬‫ر‬‫المط‬ ‫رل‬‫ر‬‫سالس‬ ‫رتوي‬‫ر‬‫مس‬ ‫ريم‬‫ر‬‫تقي‬(‫رم‬‫ر‬‫المطع‬ ‫رهرة‬‫ر‬‫ش‬-‫رم‬‫ر‬‫المطع‬ ‫رع‬‫ر‬‫موق‬– ‫االسعار‬-‫الجودة‬ ‫مستوي‬-‫الطعرام‬ ‫جودة‬-‫الخدمرة‬ ‫جرودة‬-‫المنرتج‬ ‫جرودة‬ ‫ثبرات‬-‫الجرو‬ ‫العام‬-‫ا‬‫أل‬‫نشطة‬‫الترويجية‬-‫الغذائية‬ ‫بالقيمة‬ ‫االهتمام‬.) 4.‫تغيرات‬ ‫مع‬ ‫المطاعم‬ ‫سالسل‬ ‫تتعامل‬ ‫كيف‬‫السوق‬. ‫أهداف‬‫الدراسة‬ ‫تتمثل‬‫أ‬‫االتي‬ ‫في‬ ‫الدراسة‬ ‫هداف‬: 1.‫مص‬ ‫في‬ ‫بالعالمية‬ ‫مقارنة‬ ‫المحلية‬ ‫المطاعم‬ ‫سالسل‬ ‫تجربة‬ ‫تقييم‬‫ر‬. 2.‫المحلية‬ ‫المطاعم‬ ‫سالسل‬ ‫لتطوير‬ ‫الالزمة‬ ‫النقاط‬ ‫تحديد‬. 3.‫مدي‬ ‫تقييم‬‫مرونة‬‫س‬‫مع‬ ‫ليتالئم‬ ‫المنتج‬ ‫تطوير‬ ‫في‬ ‫المطاعم‬ ‫السل‬‫المحلي‬ ‫الذوق‬.
  • 175.
    175 ‫االول‬ ‫الفصل‬:‫المقدمة‬ ‫الدراسرة‬ ‫موضوع‬‫عن‬ ‫عامة‬ ‫مقدمة‬ ‫الفصل‬ ‫هذا‬ ‫يتضمن‬,‫أ‬‫بعادهرا‬,‫هيكلهرا‬,‫مجموعرة‬ ‫ا‬ ‫من‬‫أل‬‫تم‬ ‫التي‬ ‫ختصارات‬‫أ‬‫المختلفة‬ ‫الفصول‬ ‫في‬ ‫ستعراضها‬,‫الجزء‬ ‫هذا‬ ‫تناول‬ ‫ذلك‬ ‫علي‬ ‫عالوة‬ ‫و‬ ‫الدراسة‬ ‫محددات‬‫أ‬‫ه‬‫ميتها‬. ‫الثاني‬ ‫الفصل‬:‫المرجعية‬ ‫الدراسات‬ ‫وا‬ ‫ررات‬‫ر‬‫الدراس‬ ‫ررتعراض‬‫ر‬‫باس‬ ‫ررل‬‫ر‬‫الفص‬ ‫ررذا‬‫ر‬‫ه‬ ‫ررتذ‬‫ر‬‫يخ‬‫أل‬‫رروع‬‫ر‬‫بموض‬ ‫ررة‬‫ر‬‫المتعلق‬ ‫ررابقة‬‫ر‬‫الس‬ ‫ررال‬‫ر‬‫بح‬ ‫الدراسة‬,‫ثالثة‬ ‫ويتضمن‬‫أ‬‫جزاء‬‫أ‬‫ساسية‬:‫ا‬ ‫الجزء‬‫أل‬‫مطراعم‬ ‫علري‬ ‫عامرة‬ ‫نظررة‬ ‫بالقراء‬ ‫يتعلرق‬ ‫ول‬ ‫السريعة‬ ‫الوجبات‬,‫والخ‬ ‫االغذيرة‬ ‫جرودة‬ ‫علري‬ ‫ركرز‬ ‫فقد‬ ‫الثاني‬ ‫الجزء‬ ‫أما‬‫هرذا‬ ‫تعررض‬ ‫كمرا‬ ‫دمرة‬ ‫و‬ ‫الجودة‬ ‫لمفهوم‬ ‫الجزء‬‫أ‬‫وجودة‬ ‫الجودة‬ ‫دارة‬‫الخدمة‬ ‫و‬ ‫الغذاء‬ ‫و‬ ‫المنتج‬ ‫من‬ ‫كل‬.‫و‬‫أ‬‫يوضح‬ ‫خيرا‬ ‫السريعة‬ ‫الوجبات‬ ‫مطاعم‬ ‫في‬ ‫المنافسة‬ ‫عناصر‬ ‫الثالث‬ ‫الجزء‬. ‫للدراسة‬ ‫المنهجي‬ ‫االطار‬ ‫الثالث‬ ‫الفصل‬ ‫تحديد‬ ‫علي‬ ‫الفصل‬ ‫هذا‬ ‫ويحتوي‬‫الدراس‬ ‫مجتمع‬ ‫و‬ ‫الدراسة‬ ‫منهج‬‫و‬ ‫ة‬‫أ‬‫البيانرات‬ ‫جمع‬ ‫داة‬ ‫كاالتي‬ ‫وهي‬:- 1.‫الدراسة‬ ‫منهج‬ ‫أ‬‫علري‬ ‫االجابرة‬ ‫يتم‬ ‫بحيث‬ ‫المسحي‬ ‫الوصفي‬ ‫المنهج‬ ‫الدراسة‬ ‫هذه‬ ‫في‬ ‫تبع‬‫أ‬‫الردار‬ ‫سرللة‬ ‫خالل‬ ‫من‬‫أ‬‫سالسرل‬ ‫لتجربرة‬ ‫تقييمهرا‬ ‫مسرتوي‬ ‫علري‬ ‫للتعرف‬ ‫المجتمع‬ ‫عينة‬ ‫اراء‬ ‫ستطالع‬ ‫مصر‬ ‫في‬ ‫بالعالمية‬ ‫مقارنة‬ ‫المحلية‬ ‫المطاعم‬. ‫ا‬ ‫الدراسة‬ ‫لجاءت‬‫الخاصرة‬ ‫البيانرات‬ ‫جمرع‬ ‫يرتم‬ ‫خاللها‬ ‫من‬ ‫والتي‬ ‫الشخصية‬ ‫المقابالت‬ ‫لي‬ ‫صورة‬ ‫في‬ ‫وذلك‬ ‫التجربة‬ ‫بتقييم‬‫أ‬‫والسالسل‬ ‫المطاعم‬ ‫مديرو‬ ‫عليها‬ ‫يجيب‬ ‫سللة‬. ‫أ‬‫ري‬‫ر‬‫عل‬ ‫رة‬‫ر‬‫الدراس‬ ‫رتندت‬‫ر‬‫س‬‫أ‬‫رذ‬‫ر‬‫للفح‬ ‫رة‬‫ر‬‫قائم‬ ‫رالل‬‫ر‬‫خ‬ ‫رن‬‫ر‬‫م‬ ‫رك‬‫ر‬‫وذل‬ ‫رية‬‫ر‬‫الشخص‬ ‫رة‬‫ر‬‫المالحظ‬ ‫رلوب‬‫ر‬‫س‬ ‫رو‬‫ر‬‫والج‬ ‫رة‬‫ر‬‫والنظاف‬ ‫رام‬‫ر‬‫الطع‬ ‫رودة‬‫ر‬‫وج‬ ‫رة‬‫ر‬‫الخدم‬ ‫رودة‬‫ر‬‫ج‬ ‫رر‬‫ر‬‫عناص‬ ‫ري‬‫ر‬‫عل‬ ‫ريم‬‫ر‬‫والتقي‬‫رتوي‬‫ر‬‫ومس‬ ‫رام‬‫ر‬‫الع‬ ‫و‬ ‫الخدمة‬‫أ‬‫المطراعم‬ ‫سالسرل‬ ‫تجربرة‬ ‫لتقيريم‬ ‫وذلرك‬ ‫المطاعم‬ ‫داخل‬ ‫والمديرين‬ ‫العاملين‬ ‫داء‬ ‫مصر‬ ‫في‬ ‫بالعالمية‬ ‫مقارنة‬ ‫المحلية‬.
  • 176.
    176 ‫الدراسة‬ ‫مجتمع‬ ‫من‬ ‫الدراسة‬‫مجتمع‬ ‫يتكون‬: ‫ردارها‬‫ر‬‫مق‬ ‫رائيا‬‫ر‬‫احص‬ ‫ربة‬‫ر‬‫مناس‬ ‫روائية‬‫ر‬‫عش‬ ‫رة‬‫ر‬‫عين‬ ‫رذ‬‫ر‬‫باخ‬ ‫رث‬‫ر‬‫الباح‬ ‫رام‬‫ر‬‫ق‬1511‫رل‬‫ر‬‫عمي‬‫رالء‬‫ر‬‫عم‬ ‫رن‬‫ر‬‫م‬ ‫ال‬ ‫الوجبات‬ ‫مطاعم‬‫سريعة‬‫ب‬‫الشيخ‬ ‫شرم‬. ‫قام‬‫ت‬‫الدراسة‬‫مقدارها‬ ‫عينة‬ ‫باخذ‬44‫من‬ ‫مدير‬‫والسالسر‬ ‫المطراعم‬ ‫مديري‬‫الموجرودة‬ ‫ل‬ ‫الشيخ‬ ‫شرم‬ ‫في‬. ‫تم‬‫أ‬‫مقدارها‬ ‫عشوائية‬ ‫عينة‬ ‫خذ‬12‫مطعم‬‫من‬‫مطاعم‬‫الشيخ‬ ‫شرم‬. ‫أ‬‫البيانات‬ ‫جمع‬ ‫داة‬ ‫أ‬‫عتمد‬‫ت‬‫الدراسة‬‫ا‬ ‫علي‬‫أل‬‫بعرد‬ ‫سرتبيان‬‫أ‬‫بق‬ ‫العالقرة‬ ‫ذات‬ ‫النقراط‬ ‫مرن‬ ‫مجموعرة‬ ‫ضرافة‬‫طراع‬ ‫راعم‬‫ر‬‫المط‬.‫رميم‬‫ر‬‫تص‬ ‫رم‬‫ر‬‫ت‬ ‫رد‬‫ر‬‫وق‬‫أ‬‫رتمارة‬‫ر‬‫س‬‫أ‬‫راعم‬‫ر‬‫المط‬ ‫رل‬‫ر‬‫سالس‬ ‫رة‬‫ر‬‫تجرب‬ ‫ريم‬‫ر‬‫بتقي‬ ‫رة‬‫ر‬‫خاص‬ ‫راء‬‫ر‬‫ستقص‬ ‫رواد‬ ‫علري‬ ‫ووزعرت‬ ‫سرؤاال‬ ‫عشرر‬ ‫احردي‬ ‫من‬ ‫تتكون‬ ‫مصر‬ ‫في‬ ‫بالعالمية‬ ‫مقارنة‬ ‫المحلية‬ ‫رع‬‫ر‬‫توزي‬ ‫رم‬‫ر‬‫ت‬ ‫رث‬‫ر‬‫حي‬ ‫راعم‬‫ر‬‫المط‬ ‫رذه‬‫ر‬‫ه‬1511‫أ‬‫رتمارة‬‫ر‬‫س‬‫أ‬‫ري‬‫ر‬‫عل‬ ‫را‬‫ر‬‫منه‬ ‫رب‬‫ر‬‫جي‬1248‫أ‬‫رتمارة‬‫ر‬‫س‬‫أ‬‫ي‬ ‫بنسرربة‬83%‫مررن‬‫أ‬‫االسررتمارات‬ ‫رردد‬‫ر‬‫ع‬ ‫جمررالي‬.‫ررد‬‫ر‬‫وق‬ ‫هررذا‬‫أ‬‫سررتخدم‬‫ت‬‫الدراسررة‬‫ررامج‬‫ر‬‫برن‬ SPSS‫النتائج‬ ‫الي‬ ‫والوصول‬ ‫االستبيان‬ ‫لتحليل‬. ‫كما‬‫أ‬‫عتمد‬‫ت‬‫الدراسة‬‫بعرد‬ ‫الشخصرية‬ ‫المقرابالت‬ ‫علي‬‫أ‬‫ذات‬ ‫النقراط‬ ‫مرن‬ ‫مجموعرة‬ ‫ضرافة‬ ‫المطراعم‬ ‫بقطاع‬ ‫العالقة‬.‫تجربرة‬ ‫بتقيريم‬ ‫خاصرة‬ ‫شخصرية‬ ‫مقابلرة‬ ‫نمروذج‬ ‫تصرميم‬ ‫ترم‬ ‫وقرد‬ ‫في‬ ‫بالعالمية‬ ‫مقارنة‬ ‫المحلية‬ ‫المطاعم‬ ‫سالسل‬‫مصر‬‫م‬‫وقرد‬ ‫سرؤاال‬ ‫عشرر‬ ‫تسرعة‬ ‫من‬ ‫كونة‬ ‫حاول‬‫ت‬‫الدراسة‬‫عمل‬44‫ترم‬ ‫وقرد‬ ‫المطراعم‬ ‫مديري‬ ‫مع‬ ‫شخصية‬ ‫مقابلة‬‫أ‬‫تمرام‬36‫منهرا‬ ‫أ‬‫ي‬‫نسب‬‫ة‬81.8%‫من‬‫أ‬‫عدد‬ ‫جمالي‬‫وقد‬ ‫هذا‬ ‫المقابالت‬‫أ‬‫برنرامج‬ ‫الباحث‬ ‫ستخدم‬SPSS ‫ا‬ ‫لتحليل‬‫أل‬‫النتائج‬ ‫الي‬ ‫والوصول‬ ‫ستبيان‬. ‫وكذلك‬‫أ‬‫عتمد‬‫ت‬‫الدراسة‬‫الش‬ ‫المالحظة‬ ‫علي‬‫علري‬ ‫للتشييك‬ ‫قائمة‬ ‫خالل‬ ‫من‬ ‫وذلك‬ ‫خصية‬ ‫و‬ ‫رة‬‫ر‬‫الخدم‬ ‫رتوي‬‫ر‬‫ومس‬ ‫رام‬‫ر‬‫الع‬ ‫رو‬‫ر‬‫والج‬ ‫رة‬‫ر‬‫والنظاف‬ ‫رام‬‫ر‬‫الطع‬ ‫رودة‬‫ر‬‫وج‬ ‫رة‬‫ر‬‫الخدم‬ ‫رودة‬‫ر‬‫ج‬ ‫رر‬‫ر‬‫عناص‬‫أ‬‫داء‬ ‫راعم‬‫ر‬‫المط‬ ‫رل‬‫ر‬‫داخ‬ ‫رديرين‬‫ر‬‫والم‬ ‫راملين‬‫ر‬‫الع‬.‫ر‬‫ر‬‫قام‬ ‫رد‬‫ر‬‫وق‬‫ت‬‫رة‬‫ر‬‫الدراس‬‫ردد‬‫ر‬‫لع‬ ‫ريم‬‫ر‬‫تقي‬ ‫رل‬‫ر‬‫بعم‬12‫رم‬‫ر‬‫مطع‬ ‫كالتالي‬ ‫موزعة‬4‫و‬ ‫مستقلة‬ ‫مطاعم‬4‫و‬ ‫المختلفرة‬ ‫المحليرة‬ ‫المطاعم‬ ‫سالسل‬ ‫من‬ ‫مطاعم‬ 4‫العالمية‬ ‫المطاعم‬ ‫سالسل‬ ‫من‬ ‫مطاعم‬.
  • 177.
    177 ‫الرابع‬ ‫الفصل‬:‫والمناقشة‬ ‫النتائج‬ ‫رم‬‫ر‬‫ت‬‫رل‬‫ر‬‫الفص‬ ‫رذا‬‫ر‬‫ه‬ ‫ري‬‫ر‬‫ف‬‫أ‬‫رة‬‫ر‬‫الدراس‬ ‫ري‬‫ر‬‫ف‬ ‫را‬‫ر‬‫اليه‬ ‫رل‬‫ر‬‫التوص‬ ‫رم‬‫ر‬‫ت‬ ‫ري‬‫ر‬‫الت‬ ‫رائج‬‫ر‬‫النت‬ ‫رل‬‫ر‬‫وتحلي‬ ‫رتعراض‬‫ر‬‫س‬ ‫الميدانية‬, ,‫خالل‬ ‫من‬ ‫وذلك‬‫أ‬‫ا‬ ‫ستمارة‬‫أل‬‫الشخصية‬ ‫المالحظة‬ ‫و‬ ‫الشخصية‬ ‫والمقابالت‬ ‫ستقصاء‬, ‫الدراسرة‬ ‫انتهرت‬ ‫وقد‬ ‫هذا‬‫خرالل‬ ‫مرن‬‫أ‬‫ا‬ ‫تباعهرا‬‫أل‬‫سالسرل‬ ‫تجربرة‬ ‫وتقيريم‬ ‫بحرث‬ ‫فري‬ ‫العلمري‬ ‫سرلوب‬ ‫النتائج‬ ‫من‬ ‫مجموعة‬ ‫الي‬ ‫الدراسة‬ ‫محل‬ ‫المجتمع‬ ‫في‬ ‫بالعالمية‬ ‫مقارنة‬ ‫المحلية‬ ‫المطاعم‬,‫أ‬‫همها‬:- 1.‫من‬ ‫كل‬ ‫مستوي‬ ‫تقييم‬‫سالسل‬‫المطاعم‬‫و‬ ‫المحلية‬‫العالمية‬‫الجودة‬ ‫خواص‬ ‫حيث‬ ‫من‬ )‫االتية‬ ‫العناصر‬‫مرتبة‬‫من‬1-5‫تبعا‬‫للمستوي‬) 12345 ‫أ‬‫قل‬‫مستوي‬‫أ‬‫مستوي‬ ‫علي‬ ‫الخاصية‬‫اراءالعمالء‬‫المديرين‬ ‫اراء‬ ‫محلي‬‫عالمي‬‫الفارق‬‫محلي‬‫عالمي‬‫الفارق‬ ‫المطعم‬ ‫شهرة‬3.64.2-1.4‫محلي‬‫عالمي‬‫الفارق‬ ‫المطعم‬ ‫موقع‬3.64.1-1.54.35-1.7 ‫ا‬‫أل‬‫سعار‬3.73.41.34.14.7-1.6 ‫الطعام‬ ‫جودة‬3.94.2-1.34.33.11.2 ‫الخدمة‬ ‫جودة‬3.64-1.44.44.21.2 ‫المنتج‬ ‫جودة‬ ‫ثبات‬3.64-1.44.14.3-1.3 ‫العام‬ ‫الجو‬3.13.8-1.73.84.4-1.6 ‫ا‬‫أل‬‫الترويجية‬ ‫نشطة‬2.93.8-1.93.94.3-1.4 2.‫ال‬ ‫تحديد‬‫لتطوير‬ ‫الالزمة‬ ‫نقاط‬‫المحلية‬ ‫المطاعم‬ ‫سالسل‬. 3.‫يذوق‬‫ي‬‫ال‬ ‫يع‬‫ي‬‫م‬ ‫يتالئم‬‫ي‬‫لي‬ ‫يتج‬‫ي‬‫المن‬ ‫يوير‬‫ي‬‫تط‬ ‫يي‬‫ي‬‫ف‬ ‫ية‬‫ي‬‫العالمي‬ ‫ياعم‬‫ي‬‫المط‬ ‫يل‬‫ي‬‫سالس‬ ‫ية‬‫ي‬‫مرون‬ ‫يدي‬‫ي‬‫م‬ ‫ييم‬‫ي‬‫تقي‬ ‫المحلي‬.
  • 178.
    178 ‫ر‬‫أ‬‫العمالء‬ ‫ي‬‫أ‬‫نها‬:-‫أ‬‫منه‬-‫ثقة‬ ‫مصدر‬–‫نظيفة‬–‫جيرد‬‫ترويج‬–‫أ‬‫قروي‬ ‫شرهرة‬ ‫سرم‬ –‫باستمرار‬ ‫جديدة‬ ‫منتجات‬-‫الطعام‬ ‫جودة‬–‫الخدمة‬ ‫جودة‬–‫أ‬‫ختيا‬‫مميرز‬ ‫موقرع‬ ‫ر‬ –‫المستوي‬ ‫عالية‬ ‫جودة‬–‫الخدمة‬ ‫سرعة‬–‫جيد‬ ‫العام‬ ‫الجو‬–‫مناسب‬ ‫سعر‬. ‫ا‬ ‫مثل‬ ‫بالشباب‬ ‫خاصة‬ ‫خدمات‬ ‫توفير‬‫أل‬‫و‬ ‫نترنت‬‫ال‬‫التلفزيون‬ ‫قنوات‬‫الجذابة‬ ‫ية‬ ‫ا‬‫أل‬‫خرردمات‬ ‫بوجررود‬ ‫هتمررام‬‫لرر‬‫أل‬‫اطفررال‬(‫منطقررة‬‫أ‬‫ل‬‫عرراب‬–‫وجبررات‬‫أ‬‫طفررال‬–‫هرردايا‬ ‫ل‬‫أل‬‫طفال‬). ‫ا‬‫أل‬‫بوجود‬ ‫هتمام‬‫أ‬‫الرذوق‬ ‫تناسرب‬ ‫صناف‬‫مثرل‬ ‫المصرري‬(‫ال‬‫طعميرة‬-‫الشراورما‬– ‫الكفتة‬). ‫مثل‬ ‫االزمات‬ ‫مع‬ ‫الجيد‬ ‫التعامل‬(‫أ‬‫والمقاطعة‬ ‫البقر‬ ‫جنون‬ ‫زمة‬‫و‬‫أ‬‫الطيور‬ ‫نفلونزا‬). ‫االحتفاالت‬ ‫في‬ ‫بالمشاركة‬ ‫واالهتمام‬ ‫والتقاليد‬ ‫العادات‬ ‫مراعاة‬. ‫الديني‬ ‫الجانب‬ ‫مراعاة‬(‫عدم‬‫أ‬‫الخنزير‬ ‫لحم‬ ‫ستخدام‬‫أ‬‫المسلم‬ ‫البالد‬ ‫في‬ ‫الخمور‬ ‫و‬‫ة‬.) ‫أ‬‫ستخدام‬‫المحلية‬ ‫العمالة‬. ‫والتوصيات‬ ‫الملخص‬ ‫الخامس‬ ‫الفصل‬: ‫أ‬‫علي‬ ‫رتكازا‬‫ترم‬ ‫التري‬ ‫المراجرع‬‫أ‬‫الري‬ ‫التوصرل‬ ‫ترم‬ ‫فقرد‬ ‫الميرداني‬ ‫البحرث‬ ‫ونترائج‬ ‫ستعراضرها‬ ‫كاالتي‬ ‫وهي‬ ‫واالقتراحات‬ ‫التوصيات‬ ‫من‬ ‫مجموعة‬: 1.‫وضع‬‫ا‬‫النواحي‬ ‫كافة‬ ‫في‬ ‫البشري‬ ‫العنصر‬ ‫لتطوير‬ ‫فعالة‬ ‫سترتيجية‬. ‫ا‬‫أل‬‫ال‬ ‫ختيار‬‫البشري‬ ‫للعنصر‬ ‫جيد‬(‫يجب‬ ‫حيث‬‫أ‬‫الكفاءة‬ ‫البشري‬ ‫العنصر‬ ‫في‬ ‫يتوفر‬ ‫ن‬ ‫والرغبة‬.) ‫العمالة‬ ‫علي‬ ‫الضغط‬ ‫لتجنب‬ ‫الكافية‬ ‫العمالة‬ ‫توفير‬ ‫يجب‬. ‫و‬ ‫راتب‬ ‫توفير‬‫أ‬‫و‬ ‫قامة‬‫أ‬‫جيدة‬ ‫نتقاالت‬. ‫ا‬‫أل‬‫مثل‬ ‫التحفيزية‬ ‫باالنشطة‬ ‫هتمام‬(‫المثالي‬ ‫الموظف‬–‫أ‬‫المريالد‬ ‫عيراد‬–‫ا‬‫أل‬‫حتفراالت‬ ‫بالنجاح‬–‫المناسبات‬–‫ج‬‫الشكر‬ ‫وابات‬–‫المعايدة‬ ‫كروت‬-‫حوافز‬-‫مكافآت‬.) ‫وضوح‬‫أ‬‫تحقيرق‬ ‫فري‬ ‫بردوره‬ ‫فررد‬ ‫كرل‬ ‫ودرايرة‬ ‫العمرل‬ ‫لفريق‬ ‫المنشأة‬ ‫وخطط‬ ‫هداف‬ ‫ا‬ ‫هذه‬‫أل‬‫هداف‬. 2.‫ا‬ ‫من‬ ‫مزيد‬‫أل‬‫هتمام‬‫والنظافة‬ ‫الصحية‬ ‫بالنواحي‬. ‫ا‬ ‫لضرورة‬ ‫العاملين‬ ‫وعي‬ ‫زيادة‬‫أل‬‫الصحية‬ ‫بالنواحي‬ ‫هتمام‬. ‫ا‬‫أل‬‫بوجود‬ ‫هتمام‬‫أ‬‫لغسريل‬ ‫مخصصة‬ ‫حواض‬‫وصرابون‬ ‫وبرارده‬ ‫سراخنه‬ ‫ميراه‬ ‫بهرا‬ ‫اليرد‬ ‫ومطهر‬ ‫ومجفف‬. ‫وعدم‬ ‫للعاملين‬ ‫مستقل‬ ‫حمام‬ ‫وجود‬ ‫يجب‬‫أ‬‫بالعميل‬ ‫الخاص‬ ‫الحمام‬ ‫ستخدام‬. ‫الشخصية‬ ‫النظافة‬ ‫متابعة‬(‫االظافر‬ ‫وقذ‬ ‫الشعر‬ ‫و‬ ‫الذقن‬ ‫حالقة‬.)
  • 179.
    179 ‫التدخين‬ ‫منع‬‫أ‬‫في‬ ‫و‬‫العمل‬ ‫ثناء‬‫أ‬‫العمالء‬ ‫وجود‬ ‫ماكن‬. ‫ومتابعتها‬ ‫الحرجة‬ ‫النقاط‬ ‫تحديد‬. 3.‫ا‬‫أل‬‫لتزام‬‫و‬ ‫المهنية‬ ‫السالمة‬ ‫بقواعد‬‫ا‬‫أل‬‫كافة‬ ‫وتوفير‬ ‫الصناعي‬ ‫من‬‫ا‬‫أل‬‫د‬‫لذلك‬ ‫الالزمة‬ ‫وات‬. ‫ا‬ ‫االسعافات‬ ‫صندوق‬ ‫توفير‬‫أل‬‫المطعم‬ ‫في‬ ‫ولية‬. ‫الصناعي‬ ‫واالمن‬ ‫المهنية‬ ‫السالمة‬ ‫بقواعد‬ ‫العاملين‬ ‫توعية‬ ‫فى‬ ‫الزيادة‬. ‫ا‬‫أل‬‫نظام‬ ‫بوجود‬ ‫هتمام‬‫أل‬‫وجهاز‬ ‫الحريق‬ ‫طفاء‬‫أ‬‫للحريق‬ ‫نذار‬. ‫العا‬ ‫تدريب‬‫الحريق‬ ‫مكافحة‬ ‫كيفية‬ ‫علي‬ ‫ملين‬. ‫ا‬ ‫توافر‬ ‫يجب‬‫أل‬‫وا‬ ‫المهنية‬ ‫السالمة‬ ‫بقواعد‬ ‫الخاصة‬ ‫دوات‬‫أل‬‫الصرناعي‬ ‫من‬(‫الجروانتي‬ ‫ا‬‫أل‬‫سررتانلس‬–‫الوجرره‬ ‫حررامي‬ ‫و‬ ‫القطررن‬ ‫والجرراونتي‬–‫الحمايررة‬ ‫ومرايررل‬–‫وعالمررة‬ ‫أ‬‫مبتلة‬ ‫االرض‬ ‫حتر‬.) ‫باستمرار‬ ‫المطبخ‬ ‫شفاط‬ ‫نظافة‬ ‫متابعة‬. 4.‫ا‬‫أل‬‫هتمام‬‫اال‬ ‫وتوفير‬ ‫بالتدريب‬‫للتدريب‬ ‫الالزمة‬ ‫دوات‬‫وا‬‫أل‬‫ا‬ ‫ستخدام‬‫أل‬‫مثل‬‫االدوات‬ ‫لهذه‬. ‫ا‬ ‫يجب‬‫أل‬‫بالتدريب‬ ‫هتمام‬. ‫وضع‬‫أ‬‫التدريب‬ ‫خالل‬ ‫من‬ ‫للتطوير‬ ‫ستراتيجية‬. ‫التدريبية‬ ‫للبرامج‬ ‫االمثل‬ ‫التطبيق‬. ‫ا‬ ‫توفير‬‫أل‬‫للتدريب‬ ‫الالزمة‬ ‫دوات‬(‫العرض‬ ‫شاشات‬–‫تلفزيون‬–‫فيديو‬–‫كمبيروتر‬ -‫بروجيكتور‬)‫وا‬‫أل‬‫ا‬ ‫ستخدام‬‫أل‬‫مث‬‫لها‬ ‫ل‬. ‫ا‬‫أل‬‫باللغات‬ ‫هتمام‬(‫االنجليزية‬–‫الروسية‬–‫االيطالية‬.) ‫رة‬‫ر‬‫الخدم‬ ‫روات‬‫ر‬‫وخط‬ ‫رفات‬‫ر‬‫والوص‬ ‫رد‬‫ر‬‫القواع‬ ‫ري‬‫ر‬‫عل‬ ‫روي‬‫ر‬‫يحت‬ ‫رغيل‬‫ر‬‫تش‬ ‫راب‬‫ر‬‫كت‬ ‫روافر‬‫ر‬‫ت‬ ‫رب‬‫ر‬‫يج‬ ‫المعدات‬ ‫مع‬ ‫التعامل‬ ‫وكيفية‬. ‫السيلة‬ ‫السلوكية‬ ‫العادات‬ ‫مكافحة‬. 5.‫و‬ ‫يل‬ ‫تشي‬ ‫وخطيط‬ ‫داخليية‬ ‫عمل‬ ‫نظم‬ ‫وضع‬‫أ‬‫سيتكمال‬‫ا‬ ‫كافية‬‫أل‬‫دوات‬‫القييا‬ ‫لدقية‬ ‫الالزمية‬‫س‬ ‫المنتج‬ ‫ثبات‬ ‫الي‬ ‫للوصول‬ ‫والمعايرة‬. ‫ا‬‫أل‬‫ا‬ ‫التطبيق‬ ‫خالل‬ ‫من‬ ‫المنتج‬ ‫ثبات‬ ‫علي‬ ‫بالحفاظ‬ ‫هتمام‬‫أل‬‫القياسية‬ ‫للوصفات‬ ‫مثل‬. ‫توفير‬‫أ‬‫القيا‬ ‫دوات‬. ‫يجب‬‫أ‬‫المنتج‬ ‫ثبات‬ ‫باهمية‬ ‫دراية‬ ‫علي‬ ‫العاملين‬ ‫يكون‬ ‫ن‬.
  • 180.
    181 ‫أ‬‫با‬ ‫التوقع‬ ‫نظام‬‫ستخدام‬‫البيعي‬ ‫المزيج‬ ‫وتحليل‬ ‫لمبيعات‬. ‫الشاملة‬ ‫الجودة‬ ‫قواعد‬ ‫تطبيق‬. ‫ا‬ ‫قواعد‬ ‫تطبيق‬‫أل‬‫والتخزين‬ ‫ستالم‬. ‫أ‬‫ا‬ ‫رات‬‫ر‬‫العالم‬ ‫رتخدام‬‫ر‬‫س‬‫أل‬‫رييح‬‫ر‬‫التس‬ ‫رة‬‫ر‬‫عملي‬ ‫ري‬‫ر‬‫ف‬ ‫رادية‬‫ر‬‫رش‬(‫رييح‬‫ر‬‫التس‬ ‫ردء‬‫ر‬‫ب‬ ‫راريخ‬‫ر‬‫ت‬–‫راريخ‬‫ر‬‫ت‬ ‫أ‬‫االستخدام‬ ‫بداية‬ ‫مكانية‬–‫الصالحية‬ ‫انتهاء‬ ‫تاريخ‬.) ‫أ‬‫ررتخدام‬‫ر‬‫س‬‫أ‬‫ا‬ ‫ررة‬‫ر‬‫مختلف‬ ‫ررع‬‫ر‬‫تقطي‬ ‫ررواح‬‫ر‬‫ل‬‫أل‬‫رروان‬‫ر‬‫ل‬(‫رروم‬‫ر‬‫للح‬–‫ررروات‬‫ر‬‫للخض‬–‫ررماك‬‫ر‬‫لالس‬– ‫للدواجن‬.) ‫وصوله‬ ‫حتي‬ ‫ساخن‬ ‫الطعام‬ ‫تحفظ‬ ‫بحيث‬ ‫للمنازل‬ ‫التوصيل‬ ‫حقائب‬ ‫تطوير‬. ‫ا‬‫أل‬‫الحديثة‬ ‫للتكنولوجيا‬ ‫االمثل‬ ‫ستخدام‬(‫التحكم‬ ‫في‬–‫التحليرل‬–‫الجرداول‬ ‫تنسريق‬– ‫التخزين‬–‫الحسابات‬–‫الدعاية‬-‫التسويق‬.) ‫وجودتها‬ ‫الخدمة‬ ‫لوقت‬ ‫قياسية‬ ‫معايير‬ ‫وضع‬. ‫زيا‬‫دة‬‫أ‬‫وكفاءتها‬ ‫العمالة‬ ‫نتاجية‬. ‫أ‬‫رل‬‫ر‬‫والعمي‬ ‫ردور‬‫ر‬‫ال‬ ‫ريم‬‫ر‬‫التق‬ ‫رالل‬‫ر‬‫خ‬ ‫رن‬‫ر‬‫م‬ ‫رك‬‫ر‬‫وذل‬ ‫رة‬‫ر‬‫والمتابع‬ ‫ريم‬‫ر‬‫للتق‬ ‫رة‬‫ر‬‫الحديث‬ ‫رنظم‬‫ر‬‫ال‬ ‫رتخدام‬‫ر‬‫س‬ ‫و‬ ‫الخفىء‬‫أ‬‫االستقصاء‬ ‫ستمارات‬. 6.‫يوضع‬‫ا‬ ‫في‬‫أل‬‫عتبار‬‫الطعام‬ ‫قوائم‬ ‫تخطيط‬ ‫عند‬‫أ‬‫تكميل‬ ‫التيي‬ ‫الميواد‬ ‫جميع‬ ‫علي‬ ‫تحتوي‬ ‫ن‬ ‫ذائ‬ ‫ال‬ ‫الحقائق‬ ‫توضيح‬ ‫مراعاة‬ ‫مع‬ ‫ذائية‬ ‫ال‬ ‫القيمة‬‫للعميل‬ ‫ية‬. ‫يجب‬‫أ‬‫للعميل‬ ‫الغذائية‬ ‫الحقائق‬ ‫توضح‬ ‫ن‬(‫الغذائية‬ ‫القيمة‬–‫المكونرات‬–‫السرعرات‬ ‫الحرارية‬.) ‫وا‬ ‫التنوع‬‫أل‬‫يجب‬ ‫الغذائية‬ ‫بالقيمة‬ ‫هتمام‬‫أ‬‫ا‬ ‫فري‬ ‫توضرع‬ ‫ن‬‫أل‬‫قروائم‬ ‫تخطريط‬ ‫عنرد‬ ‫عتبرار‬ ‫الطعام‬. ‫ا‬‫أل‬‫رود‬‫ر‬‫بوج‬ ‫رام‬‫ر‬‫هتم‬(‫رائر‬‫ر‬‫والعص‬ ‫روب‬‫ر‬‫والحب‬ ‫رة‬‫ر‬‫الطازج‬ ‫ره‬‫ر‬‫والفواك‬ ‫رالطات‬‫ر‬‫والس‬ ‫رورب‬‫ر‬‫الش‬ ‫الطازجة‬‫الدسم‬ ‫منزوع‬ ‫واللبن‬ ‫والمياه‬)‫للوجبة‬ ‫الغذائية‬ ‫القيمة‬ ‫لرفع‬. ‫ا‬‫أل‬‫الخاصرررة‬ ‫بالوجبرررات‬ ‫هتمرررام‬(‫والنبررراتيين‬ ‫والقلرررب‬ ‫والضرررغط‬ ‫السررركر‬ ‫مرضررري‬ ‫والرياضيين‬.) 7.‫ا‬‫أل‬‫ه‬‫التسويقية‬ ‫بالبحوث‬ ‫تمام‬‫ا‬ ‫لتحديد‬‫أل‬‫حتياجات‬‫للعميل‬ ‫الفعلية‬. ‫المستمرة‬ ‫الدراسة‬‫أل‬‫العميل‬ ‫حتياجات‬‫ا‬ ‫ومواكبة‬‫أل‬‫الحديثة‬ ‫تجاهات‬‫للسوق‬. ‫ا‬‫أل‬‫الفعالة‬ ‫الترويجية‬ ‫باالنشطة‬ ‫هتمام‬. ‫يجب‬‫أ‬‫والمنافسين‬ ‫العميل‬ ‫وتوقعات‬ ‫القيمة‬ ‫مع‬ ‫مناسبا‬ ‫الوجبات‬ ‫سعر‬ ‫يكون‬ ‫ن‬ ‫ا‬‫أل‬‫المناسب‬ ‫الموقع‬ ‫باختيار‬ ‫هتمام‬. ‫المنافسين‬ ‫جيدة‬ ‫دراسة‬. ‫تجارية‬ ‫عالمة‬ ‫وجود‬(‫واضحة‬–‫جذابة‬–‫مميزة‬.)
  • 181.
    181 ‫ا‬‫أل‬‫فررري‬ ‫للمسررراعدة‬ ‫لالنترنرررت‬‫االمثرررل‬ ‫سرررتخدام‬‫أ‬‫سرررت‬‫ا‬ ‫مارات‬‫أل‬‫والبحرررول‬ ‫ستقصررراء‬ ‫التسويقية‬. ‫ا‬‫أل‬‫معظرم‬ ‫ليغطي‬ ‫المحلية‬ ‫السالسل‬ ‫فروع‬ ‫عدد‬ ‫زيادة‬ ‫طريق‬ ‫نتشارعن‬‫أ‬‫تواجرد‬ ‫مراكن‬ ‫وخاصة‬ ‫العمالء‬‫أ‬‫والجامعات‬ ‫الموالت‬ ‫مثل‬ ‫الشباب‬ ‫تجمع‬ ‫ماكن‬. 8.‫رغباتهم‬ ‫تحقيق‬ ‫خالل‬ ‫من‬ ‫العمالء‬ ‫رضاء‬ ‫علي‬ ‫التركيز‬‫ا‬ ‫ومتابعة‬‫أل‬‫تجاهات‬‫الحديثية‬ ‫للسوق‬. ‫العميل‬ ‫على‬ ‫التركيز‬(‫ا‬‫أل‬‫العميل‬ ‫ورضاء‬ ‫بالجودة‬ ‫هتمام‬.) ‫يجب‬ ‫والتي‬ ‫للمنازل‬ ‫التوصيل‬ ‫خدمة‬‫أ‬‫االنحاء‬ ‫معظم‬ ‫تغطى‬ ‫ن‬. ‫أ‬‫الطلب‬ ‫العميل‬ ‫على‬ ‫يسهل‬ ‫للسلسلة‬ ‫الموحد‬ ‫الرقم‬ ‫نظام‬ ‫ستخدام‬. ‫بالمطعم‬ ‫الكاش‬ ‫ماكينة‬ ‫وتوفير‬ ‫بالفيزا‬ ‫الدفع‬ ‫قبول‬. ‫وجود‬‫أ‬‫دورية‬ ‫بصفة‬ ‫جديدة‬ ‫صناف‬. ‫مسراحة‬ ‫تروفير‬‫أ‬‫روات‬‫ر‬‫والقن‬ ‫االنترنرت‬ ‫رل‬‫ر‬‫مث‬ ‫الخردمات‬ ‫رن‬‫ر‬‫م‬ ‫مزيرد‬ ‫روفير‬‫ر‬‫وت‬ ‫للشرباب‬ ‫رر‬‫ر‬‫كب‬ ‫الجذابة‬ ‫التلفزيونية‬. ‫ا‬ ‫زيادة‬‫أل‬‫والمدار‬ ‫والبنوك‬ ‫السياحة‬ ‫شركات‬ ‫بخدمة‬ ‫هتمام‬. ‫راء‬‫ر‬‫اعط‬‫أ‬‫رالل‬‫ر‬‫خ‬ ‫مررن‬ ‫رال‬‫ر‬‫باالطف‬ ‫خرراص‬ ‫رام‬‫ر‬‫هتم‬(‫ا‬ ‫ردايا‬‫ر‬‫ه‬‫أل‬‫طفررال‬–‫رة‬‫ر‬‫منطق‬‫أ‬‫لعرراب‬– ‫اطفال‬ ‫وجبات‬.) ‫ا‬‫أل‬‫للعميل‬ ‫المقدمة‬ ‫بالقيمة‬ ‫هتمام‬. ‫يجب‬‫أ‬‫ت‬ ‫ن‬‫حسب‬ ‫للتغيير‬ ‫مرونه‬ ‫وفر‬‫أ‬‫العميل‬ ‫ورغبات‬ ‫حتياجات‬. ‫مقابلة‬ ‫و‬ ‫العمالء‬ ‫لمشاكل‬ ‫الجيد‬ ‫الحل‬‫أ‬‫العميل‬ ‫حتياجات‬. 9.‫والسياحة‬ ‫التعليم‬ ‫وزارتي‬‫يجب‬‫أ‬‫ن‬‫ع‬ ‫تيوفير‬ ‫عليي‬ ‫يعملوا‬‫بمطياعم‬ ‫للعميل‬ ‫مههلية‬ ‫ناصير‬ ‫الوجبات‬‫السريعة‬. ‫رب‬‫ر‬‫يج‬‫أ‬‫راك‬‫ر‬‫هن‬ ‫رون‬‫ر‬‫يك‬ ‫ن‬‫أ‬‫ريم‬‫ر‬‫والتعل‬ ‫رة‬‫ر‬‫التربي‬ ‫ري‬‫ر‬‫وزارت‬ ‫رل‬‫ر‬‫قب‬ ‫رن‬‫ر‬‫م‬ ‫رحة‬‫ر‬‫واض‬ ‫رتراتيجية‬‫ر‬‫س‬ ‫من‬ ‫والسياحة‬‫أ‬‫للعمل‬ ‫مؤهلة‬ ‫كوادر‬ ‫تخريج‬ ‫جل‬‫السريعة‬ ‫الوجبات‬ ‫بمطاعم‬. ‫أ‬‫ا‬ ‫باللغات‬ ‫خاص‬ ‫هتمام‬‫أل‬‫جنبية‬(‫انجليزية‬–‫ايطالية‬–‫روسية‬.) ‫رن‬‫ر‬‫ع‬ ‫راعم‬‫ر‬‫بالمط‬ ‫راملين‬‫ر‬‫للع‬ ‫رة‬‫ر‬‫تدريبي‬ ‫دورات‬(‫رة‬‫ر‬‫العام‬ ‫رحة‬‫ر‬‫والص‬ ‫رية‬‫ر‬‫الشخص‬ ‫رة‬‫ر‬‫النظاف‬ ‫العمالء‬ ‫ورضاء‬ ‫الخدمة‬ ‫وفن‬ ‫المهنية‬ ‫والسالمة‬ ‫الطعام‬ ‫وتداول‬.) ‫دورا‬‫ررن‬‫ر‬‫ع‬ ‫رراعم‬‫ر‬‫المط‬ ‫ررديري‬‫ر‬‫لم‬ ‫ررة‬‫ر‬‫تدريبي‬ ‫ت‬(‫ررارات‬‫ر‬‫المه‬ ‫و‬ ‫ررادة‬‫ر‬‫والقي‬ ‫ررق‬‫ر‬‫الفري‬ ‫رراء‬‫ر‬‫بن‬ ‫ا‬‫أل‬‫وا‬ ‫شرافية‬‫أل‬‫المسبق‬ ‫التجهيز‬ ‫نظام‬ ‫و‬ ‫المبيعات‬ ‫توقع‬ ‫و‬ ‫والتفويض‬ ‫دارية‬). ‫م‬ ‫عمالة‬ ‫لتخريج‬ ‫الثانوية‬ ‫بالمدار‬ ‫خاص‬ ‫قسم‬‫ؤ‬‫بالمطاعم‬ ‫للعمل‬ ‫هلة‬.
  • 182.
    182 ‫والفنادق‬ ‫السياحة‬ ‫كلية‬ ‫الفنادق‬‫ادارة‬ ‫قسم‬ ‫ا‬ ‫سالسل‬ ‫تجربة‬ ‫تقييم‬‫مصر‬ ‫في‬ ‫العالمية‬ ‫بالسالسل‬ ‫مقارنة‬ ‫المحلية‬ ‫لمطاعم‬ ‫الفنادق‬ ‫ادارة‬ ‫في‬ ‫الماجستير‬ ‫درجة‬ ‫علي‬ ‫الحصول‬ ‫الستيفاء‬ ‫مقدمة‬ ‫رسالة‬ ‫الدار‬ ‫من‬ ‫مقدمة‬ ‫قزمال‬ ‫عاطف‬ ‫هاني‬ ‫بكال‬‫ور‬‫فنادق‬ ‫ادارة‬ ‫يو‬٠٢٢٢ ‫اشراف‬ ‫تحت‬ ‫أ‬.‫د‬/‫أ‬‫الدين‬ ‫نور‬ ‫حمد‬‫إ‬‫لياس‬ ‫المتفرغ‬ ‫األستاذ‬‫ب‬‫ا‬ ‫كلية‬ ‫الفنادق‬ ‫ادارة‬ ‫قسم‬‫الفنادق‬ ‫و‬ ‫لسياحة‬ ‫حلوان‬ ‫جامعة‬ ‫أ‬.‫م‬.‫د‬/‫دنانة‬ ‫رانيا‬ ‫أ‬‫ب‬ ‫مساعد‬ ‫ستاذ‬‫الفنادق‬ ‫و‬ ‫السياحة‬ ‫كلية‬ ‫الفنادق‬ ‫ادارة‬ ‫قسم‬ ‫حلوان‬ ‫جامعة‬ ‫د‬/‫ربي‬ ‫الم‬ ‫محمود‬ ‫سونستا‬ ‫لفنادق‬ ‫االقليمي‬ ‫الرئيس‬ ‫نائب‬‫األوسط‬ ‫الشرق‬ 2119